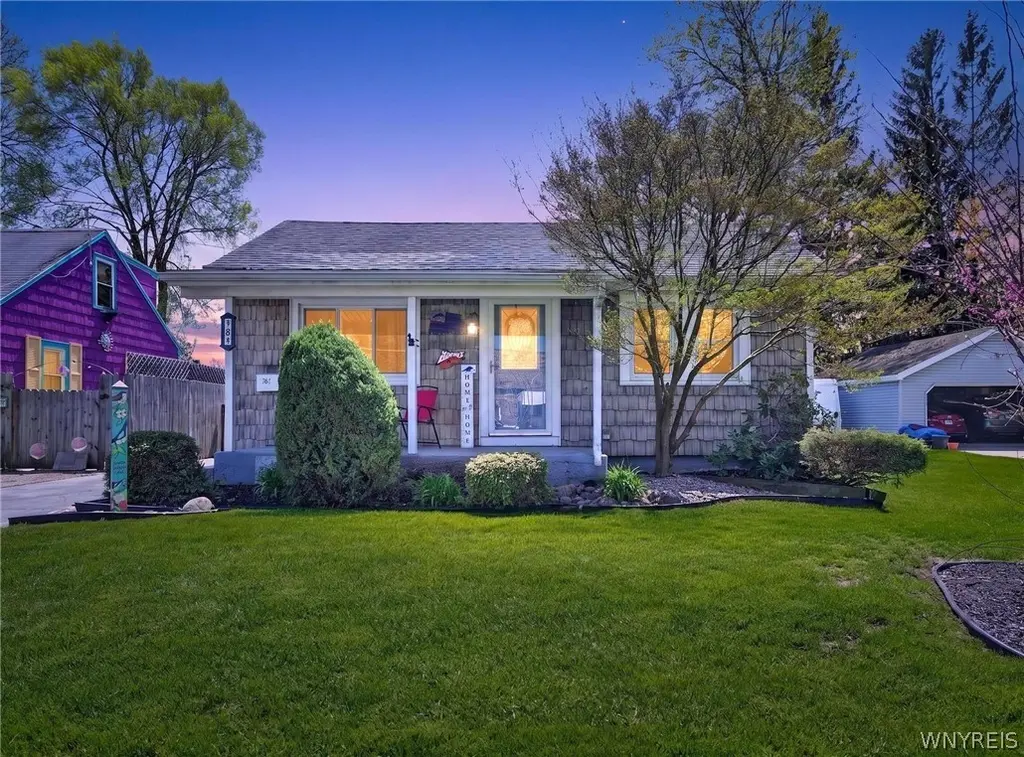
761 Lee Ave · North Tonawanda, NY
Flood risk 1/10 · Minimal
- FEMA flood zone
- X (unshaded)
- Chance of flooding over 30 yrs
- 0.0%
- Est. flood insurance / yr
- $473 – $860
Fire risk 1/10 · Minimal
- Est. fire insurance / yr
- $691 – $1,283
Heat risk 2/10 · Minimal
- Hot days now (above 94°F)
- 7 days/yr
- Hot days in 30 yrs
- 15 days/yr
Wind risk 1/10 · Minimal
- Chance of severe wind over 30 yrs
- —
Air-quality risk 3/10 · Minor
- Unhealthy air days now
- 3 days/yr
- Unhealthy air days in 30 yrs
- 4 days/yr
Risk factors via First Street. Map © Google.
Why this score? — see what drove the C- grade
The composite is a weighted blend of 9 inputs, each scored 0–100. Each bar is that input's sub-score; the figure is the points it added to the 100-point composite (weight × sub-score).
- ARV discount +15.0/15.0
- Cash flow +14.6/30.0
- DSCR +4.4/10.0
- Schools +4.2/10.0
- Livability +4.2/5.0
- Rent growth +4.0/5.0
- 1% rule +3.7/10.0
- Condition / age +2.5/5.0
- Appreciation +0.0/10.0
$169,900
🖨 Deal sheet 📄 Offer letter ✓ Due diligence
Listing remarks
761 Lee Ave is proof that smart updates and smart layout matter more than square footage. This Energy Star Certified ranch lives noticeably larger than you’d expect, with 3 bedrooms, an updated full bath, an eat-in kitchen, bright living room, and additional family room space in the basement for everyday living, hobbies, or game nights. Thoughtful design choices throughout make the home feel especially functional, including a clever refrigerator placement tucked over the basement stair area to free up valuable kitchen space and improve the overall layout. The kitchen also features Corian counters and a hands-free sink for added convenience. Over the past 20 years, the owners completed
Key facts
- Corian counters
- Updated full bath
- Bright living room
Tags
Property features AI
Finance
- Other: Some energy-efficient features for appliances, HVAC, lighting, and windows
Exterior
- Parking: Detached garage with electricity, storage and workshop space; Driveway parking
- Utilities: Electricity connected with circuit breakers; Public water connected; Sewer connected
- Home design: Single-story home; Resale property; City street frontage; Rectangular residential lot (approx. 40 x 117)
- Construction: Built existing (year not specified); Shake and vinyl siding; Asphalt and metal roof; Block foundation; Attic/crawl hatchway(s) insulated; PEX plumbing
- Exterior features: Blacktop driveway; Fully fenced yard; Open patio and porch; Patio; Porch
Interior
- Kitchen: Electric oven and electric range; Microwave; Dishwasher; Refrigerator; Solid surface counters; Eat-in layout
- Bedrooms: Three main-level bedrooms
- Flooring: Hardwood; Carpet; Ceramic tile; Luxury vinyl; Varies
- Bathrooms: One full bathroom (main level)
- Heating & cooling: Gas forced-air heating; Central air conditioning
- Interior features: Entrance foyer; Eat-in kitchen; Separate/formal living room; Pull-down attic stairs; Storage; Solid surface counters; Natural woodwork; Main level bedroom(s); Main level primary; Accessible doors; No stairs (accessible)
- Laundry & utility: Washer and dryer included; Laundry room located in basement; Gas water heater
Neighborhood map
What this means for you Summary
Snapshot
- This is a 3-bed/1.0-bath single-family listed at $170k.
Deal economics
- At list price, monthly cash flow is $40 ($480/yr) — positive.
- The deal already cash-flows at list — no discount required.
- To meet the 1% rule (rent ≥ 1% of price), the offer needs to be $148k (12.6% below list).
- Recommended offer: $148k (12.6% below list) — sets the bar for 1% rule.
- Cap rate 6.6% vs local median 4.0% in North Tonawanda — top-decile yield for the area; either an underpriced asset or a hidden risk that comps aren't pricing in. Stress-test before assuming the spread holds.
Location & tenants
- Location reads 85/100 on livability (#30 in NY, #518 nationally) — a professional / high-income tenant draw. Strengths: commute A+, housing A+, health & safety A+.
- North Tonawanda City School District (suburban): math 42% / reading 57% proficiency, ranked #398 of 590 in NY (top 68%) — families likely to look elsewhere, expect single-tenant / working-renter base with shorter leases.
- Market conditions: Rents rising fast (+6.0%/yr); 178 active listings in the ZIP; 8 comparable units currently listed for rent nearby; rentals leasing fast (median 10d on market — plan ~1-2 weeks tenant-placement turnaround); 167 units permitted in Niagara County in 2024 (0 in 5+ unit buildings).
Forward outlook
- Local home prices are declining (-3.0%/yr); year-one equity from $1k of loan paydown is wiped out by about $5k of value loss. Plan a longer hold.
- Niagara County population projected at -19% by 2050 — secular population decline; favor cash flow + early exit over multi-decade hold.
Negotiation context
- Only 8 days on market — expect competitive offers; lowballing is unlikely to land.
Risks & watch-outs
- Watch-outs: built in 1935 — expect roof / HVAC / electrical / plumbing capex.
Questions for the listing agent
- Built in 1935 — when were the roof, HVAC, electrical panel, plumbing, and water heater last replaced?
- Is there a deadline driving the sale (1031 exchange, divorce, estate, relocation)? That informs how much negotiation room exists.
- Schools are B-rated — typically a magnet for longer-tenancy family renters. What's the average tenant stay here, and is there a school-zone premium baked into asking?
- What's the average days-on-market for RENTAL listings here right now (not sales)? A rising rental-DOM trend means longer vacancies and softer asking-rent achievability than the comps imply.
- What's the recent tenant-quality profile in this submarket — average credit score on applications, eviction rate, late-payment / NSF rate, and stable-employment percentage? A property-management company in the area should have these aggregated.
- How much new for-sale + rental construction is in the pipeline within 1–3 miles? Heavy new supply typically softens prices + rents 12–24 months out; constrained supply supports both.
Investment metrics
- 1% rule
- 0.87% ✗
- Cap rate
- 6.58%
- Cash-on-cash
- 1.01%
- DSCR
- 1.04
- GRM
- 9.5
CMA / ARV
- ARV (median comp)
- $252,273
- List price
- $169,900
- Delta
- -32.65%
- Verdict
- UNDERPRICED
- Comps
- 20 within 1.0 mi
Show comp detail 11 sales within ~0.75 mi
| Address | Dist | Beds/Ba | Sqft | Sold | Price | $/sf | Match |
|---|---|---|---|---|---|---|---|
| 979 Nash Rd | 0.07mi | 3/1.0 | 808 (-3%) | 19mo | $220,000 | $272 | 76 |
| 33 Jesella Dr | 0.40mi | 3/1.0 | 864 (+4%) | 13mo | $165,000 | $191 | 64 |
| 922 Nash Rd | 0.16mi | 3/1.0 | 776 (-7%) | 22mo | $205,000 | $264 | 63 |
| 821 Revere Ave | 0.13mi | 3/1.5 | 936 (+12%) | 17mo | $183,000 | $196 | 57 |
| 317 Hedwig Dr | 0.62mi | 3/1.0 | 854 (+3%) | 13mo | $243,500 | $285 | 56 |
| 45 Jesella Dr | 0.38mi | 2/1.0 (-1) | 864 (+4%) | 18mo | $208,000 | $241 | 56 |
| 953 Erie Ave | 0.59mi | 3/1.0 | 906 (+9%) | 12mo | $195,000 | $215 | 48 |
| 959 Erie Ave | 0.59mi | 2/1.0 (-1) | 816 (-2%) | 24mo | $90,000 | $110 | 44 |
| 104 Oakwood | 0.54mi | 2/1.0 (-1) | 720 (-14%) | 8mo | $210,000 | $292 | 41 |
| 114 Oakwood Ter | 0.54mi | 2/1.5 (-1) | 900 (+8%) | 19mo | $140,000 | $156 | 39 |
| 1269 Master St | 0.57mi | 3/2.0 | 950 (+14%) | 22mo | $270,000 | $284 | 27 |
Match score weights: distance 35% · size 25% · config 20% · recency 20%. Top-matched comps best support the ARV.
Projected returns pro-forma
-3.0% appreciation · 5.96% rent growth · sell at horizon
- IRR
- -11.5%
- Equity multiple
- 0.57×
- Total profit
- $-20,433
- Equity at exit
- $25,333
- IRR
- 1.4%
- Equity multiple
- 1.11×
- Total profit
- $5,328
- Equity at exit
- $14,690
Cash invested: $47,572 (down + closing). Projections, not guarantees.
Landlord ↔ Tenant lean methodology
- Overall (STATE)
- 15 Strongly Tenant-Friendly
- State New York
- 15 Strongly Tenant-Friendly · D+10
- County
- — inherits STATE
- City
- — inherits STATE
ZIP-level market 14120
- Rents YoY
- 6.0%
- Active inventory
- 178
- Price-to-rent
- 9.5×
Monthly cashflow live
- Estimated rent
- $1,485 high interval (Pro) →
- Mortgage (P&I)
- −$891
- Tax from tax record
- −$171 /mo · $2,052/yr
- Insurance
- −$71
- HOA
- −$0
- Vacancy / Maint / Mgmt
- −$312
- Net cashflow
- $40
Break-even live
UW: 25.0% down · 7.5% · 30yr · 1.5% tax · 5.0% vac · 8.0% maint · 8.0% mgmt
Financing live
Cash to close
- Down payment
- $42,475
- Closing costs
- $5,097
- Reserves months
- —
- Total cash needed
- —
Loan-product check · same deal, 3 products live
Conventional
25% down · 7.5% · 30yr
- Down + closing
- —
- Monthly P&I
- —
- Monthly cashflow
- —
- DSCR
- —
- Eligible?
- —
Personal DTI + credit; lowest rate.
DSCR
20% down · 8.5% · 30yr
- Down + closing
- —
- Monthly P&I
- —
- Monthly cashflow
- —
- DSCR
- —
- Eligible?
- —
No personal income docs; deal must DSCR.
Hard money
10% down · 12.0% · 12mo
- Down + closing
- —
- Monthly P&I
- —
- Monthly cashflow
- —
- DSCR
- —
- Eligible?
- —
Short-term bridge; refi at stabilization.
Rent comps 8 comps
| Address | Beds | Baths | Sqft | Rent | $/sqft | DOM | Units | Dist |
|---|---|---|---|---|---|---|---|---|
| 757 Remington Dr Unit 1 North Tonawanda, NY | 3.0 | 1.5 | 1100 | $1,750 | $1.59 | 10d | 1 | 0.24mi |
| 317 Hedwig Dr Unit N North Tonawanda, NY | 3.0 | 1.0 | 864 | $1,350 | $1.56 | 10d | 1 | 0.61mi |
| 1400 Nash Rd North Tonawanda, NY | 1.0–2.0 | 1.0 | 750 | $1,225 | $1.63 | 1d | 1 | 0.78mi |
| 175 12th Ave North Tonawanda, NY | 3.0 | 1.0 | 1000 | $1,600 | $1.60 | 43d | 1 | 0.88mi |
| 399 Miller St North Tonawanda, NY | 2.0 | 1.0 | 750 | $1,250 | $1.67 | 23d | 1 | 0.95mi |
| 125 3rd Ave North Tonawanda, NY | 2.0 | 1.0 | 900 | $1,100 | $1.22 | 43d | 1 | 1.06mi |
| 900 E Robinson St North Tonawanda, NY | 2.0 | 1.0 | 900 | $1,350 | $1.50 | 1d | 1 | 1.24mi |
| 600 River Rd North Tonawanda, NY | 1.0–3.0 | 1.0–2.5 | 1320 | $4,995 | $3.78 | 1d | 12 | 1.44mi |
Listing history 2 events
-
2026-05-14status Pending 1313-char remark
-
2026-05-06$169,900 Active 1313-char remark
ⓘ Source: listings_history table (triggers on properties + properties_extension) + one-shot
backfill from property_details.listing_events for pre-trigger history.
Tax reassessment forecast NY · Partial reset (capped growth)
- Current annual tax
- $2,052 · $171/mo
- Projected year-2 tax
- $2,461 · $205/mo
- Expected delta
- +$410/yr (+$34/mo · 20.0%)
ⓘ Screening estimate from a state-policy table — verify with the county assessor before closing.
Climate risk First Street
- Flood 1/10 Low FEMA zone X (unshaded) · 0% chance over 30 yrs
- Wildfire 1/10 Low
- Heat 2/10 Low 7 d/yr ≥94°F today · 15 d/yr by 30 yrs out
- Wind 1/10 Low
- Air quality 3/10 Moderate 3 unhealthy d/yr today · 4 by 30 yrs out
Nearby sold comps map
Loading sold comps map…
Walkable amenities ~0.75 mi
Loading nearby amenities…
Taxation est. · year 1
- Rental income
- $17,814
- − Mortgage interest
- −$9,517
- − Property taxes
- −$2,052
- − Insurance
- −$850
- − Repairs & maintenance
- −$1,425
- − Management
- −$1,425
- − Depreciation
- −$4,943
- Taxable loss
- −$2,397
- Est. tax savings @ 24.0%
- +$575
- After-tax cash flow
- $1,056/yr
For passive investors: Depreciation is non-cash, so a rental often shows a tax loss while cash-flowing — sheltering income. Rental losses are passive: they offset passive income freely, and up to $25,000/yr can offset ordinary (W-2) income if you actively participate and your MAGI is under $100k (phasing out to $0 by $150k); unused losses carry forward. On sale, claimed depreciation is recaptured at up to 25%, and gains may owe capital-gains tax (a 1031 exchange can defer both). Figures are a year-1 estimate at your 24.0% rate — not tax advice; consult a CPA.
Schools (NCES district)
- District
- North Tonawanda City School District
- NCES district ID
- 3621240
- Math proficiency
- 42% ▼ -16.00%
- Reading proficiency
- 57% ▲ 4.00%
- Median HH income
- $48,348
- Composite
- 42.15/100
- National rank
- #3301
- State rank
- #398 of 590 in NY
Livability — North Tonawanda
- Score
- 85/100
- State rank
- #30
- US rank
- #518
Category grades
Schools grade is shown separately in the Schools card above.
Census & demographics
- Census place
- North Tonawanda, NY
- County
- Niagara County · 157,377 people
- City population
- 44,241
- Metro
- Buffalo-Cheektowaga, NY
- Population (ZIP)
- 44,241
- Household income
- $74,871
- Rent vs Own
- Severe rent burden
- 1303.0
Population outlook (Niagara County) Hauer SSP2
- Today (2025)
- 204,149 people
- By 2030
- 197,900 · -3.1%
- By 2040
- 182,239 · -10.7%
- By 2050
- 165,198 · -19.1%
- By 2075
- 129,416 · -36.6%
- By 2100
- 96,222 · -52.9%
Race, ethnicity, and origin ACS 2023
- Neighborhood character
- Predominantly White (91%)
- Race & ethnicity
- White 91% Two or more races 4% Hispanic / Latino 3% Black 2%
- Common ancestry
- Romanian 15% Lithuanian 2% Slovak 2%
- Foreign-born
- 4% · Canada, China
- Languages at home
- 95% English-only · Russian/Polish/Slavic 2% Spanish 1% Other Indo-European 1%
Political lean MEDSL · Niagara
- 2024 margin
- R (+14.9) · D 42.5% · R 57.5%
- 2008→2024 swing
- -15.9pp toward R · 2008: 1.0pp · 2024: -14.9pp
- All cycles
- 2024: R+14.9 2020: R+9.7 2016: R+19.0 2012: D+0.6 2008: D+1.0
Not yet ingested
- Civics
- —
Market trends
- HPI YoY
- ▼ -260.39%
- Current HPI
- 303.1744
- Rent YoY
- ▲ 5.96%
- Metro
- Buffalo-Cheektowaga, NY
- State GDP YoY
- ▲ 2.60%
- F500 in state
- 92
Industry mix (Fortune 500 HQ in NY)
| Industry | F500 HQs | Revenue |
|---|---|---|
| Financial Services | 10 | $950B |
|
||
| Consumer Goods | 9 | $162B |
|
||
| Insurance | 4 | $225B |
|
||
| Telecommunications | 2 | $144B |
|
||
| Pharmaceuticals | 2 | $112B |
|
||
| Media / Entertainment | 2 | $69B |
|
||
Price history
2 events — show timeline
- 2026-05-14 Pending — WNYREIS
- 2026-05-06 Listed $169,900 WNYREIS
Property tax history
+5.3%/yrLatest (2025): $2,052 · +2.1% YoY. Source: county tax records.
Cash-flow waterfall
monthlySold comps — $/sqft
last 12 mo · ≤1 miLoading sold comps…