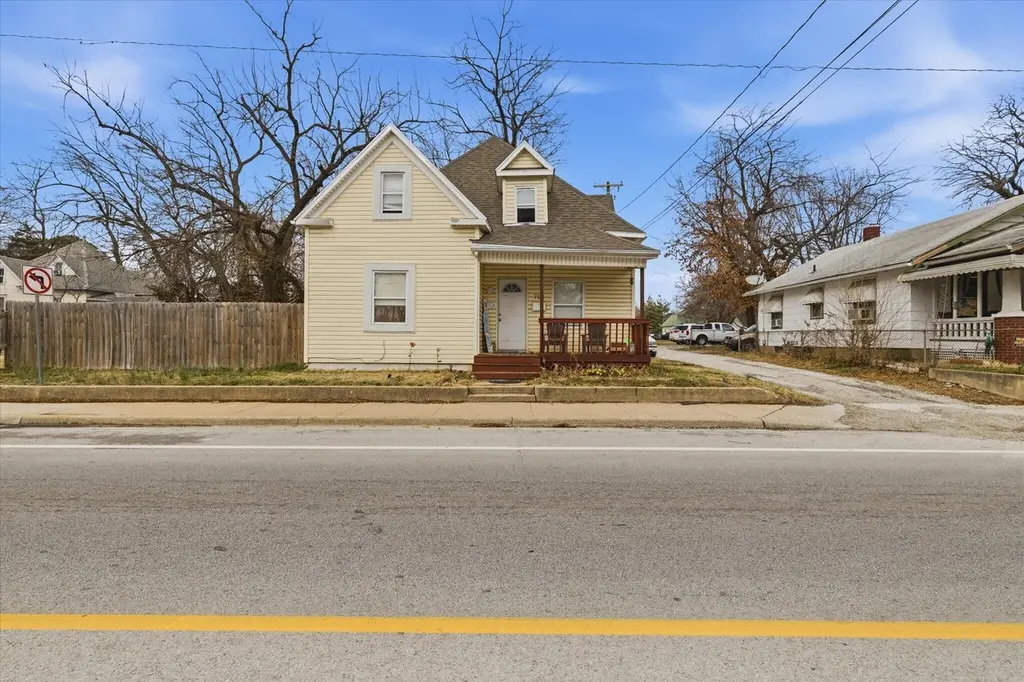
715 E Division St · Springfield, MO
Flood risk 1/10 · Minimal
- FEMA flood zone
- X (unshaded)
- Chance of flooding over 30 yrs
- 0.0%
- Est. flood insurance / yr
- $507 – $1,088
Fire risk 1/10 · Minimal
- Est. fire insurance / yr
- $1,054 – $1,958
Heat risk 5/10 · Moderate
- Hot days now (above 104°F)
- 7 days/yr
- Hot days in 30 yrs
- 18 days/yr
Wind risk 2/10 · Minimal
- Chance of severe wind over 30 yrs
- —
Air-quality risk 2/10 · Minimal
- Unhealthy air days now
- 1 days/yr
- Unhealthy air days in 30 yrs
- 2 days/yr
Risk factors via First Street. Map © Google.
Why this score? — see what drove the D grade
The composite is a weighted blend of 9 inputs, each scored 0–100. Each bar is that input's sub-score; the figure is the points it added to the 100-point composite (weight × sub-score).
- ARV discount +14.4/15.0
- Cash flow +10.3/30.0
- Livability +3.8/5.0
- Rent growth +3.6/5.0
- Schools +3.2/10.0
- DSCR +3.0/10.0
- Condition / age +2.5/5.0
- 1% rule +2.0/10.0
- Appreciation +0.0/10.0
$165,000
🖨 Deal sheet 📄 Offer letter ✓ Due diligence
Listing remarks MLS
Charming two-story home offering 4 bedrooms and 2 bathrooms! A covered front porch provides a welcoming entrance and a great place to relax. The location is ideal, just minutes from Drury University, OTC, Commercial Street, and Grant Avenue Parkway, offering convenient access to dining, shopping, and local attractions. Inside, the main level features a kitchen with wood cabinets and stainless steel appliances, offering both style and functionality. The home also includes a privacy-fenced yard, providing a great space for outdoor enjoyment. Recent updates include a roof that was replaced approximately four years ago, and gravel has been added to the driveway for convenient parking. This home offers a great combination of comfort and practical updates!
Key facts
- Covered front porch
- Recent updates
- Privacy-fenced yard
Tags
Neighborhood map
What this means for you Summary
Snapshot
- This is a 3-bed/2.0-bath single-family listed at $165k.
Deal economics
- At list price, monthly cash flow is $-90 ($-1k/yr) — negative.
- To cash-flow at today's rent, offer at most $149k (9.6% below list).
- To meet the 1% rule (rent ≥ 1% of price), the offer needs to be $116k (29.6% below list).
- Recommended offer: $116k (29.6% below list) — sets the bar for 1% rule.
- Cap rate 5.6% vs local median 4.6% in Springfield — meaningfully above typical; check what's discounted (condition, days-on-market, listing class) to confirm the premium yield is real.
Location & tenants
- Location reads 75/100 on livability (#57 in MO, #4,121 nationally) — a middle-class / working-renter tenant base. Strengths: commute A+, cost of living A+, housing A+; Watch: crime F, employment F.
- Springfield R-XII (urban): math 32% / reading 46% proficiency, ranked #174 of 324 in MO (top 54%) — families likely to look elsewhere, expect single-tenant / working-renter base with shorter leases.
- Market conditions: Rents rising fast (+4.2%/yr); 394 active listings in the ZIP; 40 comparable units currently listed for rent nearby; rentals at typical pace (median 24d on market — plan ~3-4 weeks tenant-placement turnaround); 1,302 units permitted in Greene County in 2024 (250 in 5+ unit buildings).
Forward outlook
- Local home prices are declining (-3.0%/yr); year-one equity from $1k of loan paydown is wiped out by about $5k of value loss. Plan a longer hold.
- Greene County population projected at +25% by 2050 — long-run rental-demand tailwind backs the buy-and-hold thesis.
Negotiation context
- It's been on market 100 days — a 9% lower offer ($150k) is reasonable based on typical stale-listing flexibility.
- 4 sale attempts since 12y ago with the ask held roughly flat each time — persistent listings suggest the price (not the market) is what's stuck; bring a comps-based counter.
Risks & watch-outs
- Watch-outs: built in 1916 — expect roof / HVAC / electrical / plumbing capex.
- Climate carrying-cost: extreme-heat days projected 7→18/yr by 2055 (HVAC capex compounding) — expect insurance premiums to compound above CPI over the hold.
Questions for the listing agent
- What do current leases actually rent for vs. the listed asking? Can we see a recent rent roll and the last 12 months of T-12 income?
- It's been on market 100 days. Have you received any prior offers? Is the seller open to a 30% concession, seller financing, or rate buy-down credit?
- Built in 1916 — when were the roof, HVAC, electrical panel, plumbing, and water heater last replaced?
- Why hasn't it sold? Are there any deal-killer items the seller is aware of (foundation, flood, title, zoning, code violations)?
- Is there a deadline driving the sale (1031 exchange, divorce, estate, relocation)? That informs how much negotiation room exists.
- Crime grade is F in this area — have there been break-ins, vandalism, or insurance claims at this property in the last 3 years? What carrier currently insures it and at what premium?
- The area grade is low — what's the realistic commute time and amenity access for the typical tenant pool here? Any planned neighborhood developments (good or bad) we should know about?
- What's the average days-on-market for RENTAL listings here right now (not sales)? A rising rental-DOM trend means longer vacancies and softer asking-rent achievability than the comps imply.
- What's the recent tenant-quality profile in this submarket — average credit score on applications, eviction rate, late-payment / NSF rate, and stable-employment percentage? A property-management company in the area should have these aggregated.
- How much new for-sale + rental construction is in the pipeline within 1–3 miles? Heavy new supply typically softens prices + rents 12–24 months out; constrained supply supports both.
Investment metrics
- 1% rule
- 0.70% ✗
- Cap rate
- 5.64%
- Cash-on-cash
- -2.33%
- DSCR
- 0.90
- GRM
- 11.8
CMA / ARV
- ARV (median comp)
- $195,073
- List price
- $165,000
- Delta
- -15.42%
- Verdict
- UNDERPRICED
- Comps
- 20 within 1.0 mi
Show comp detail 12 sales within ~0.75 mi
| Address | Dist | Beds/Ba | Sqft | Sold | Price | $/sf | Match |
|---|---|---|---|---|---|---|---|
| 424 E Locust St | 0.28mi | 2/2.0 (-1) | 1,256 (+1%) | 6mo | $159,900 | $127 | 74 |
| 1607 N Washington Ave | 0.18mi | 2/1.0 (-1) | 1,195 (-4%) | 6mo | $164,500 | $138 | 72 |
| 1454 N Sherman Ave | 0.16mi | 3/1.0 | 1,356 (+9%) | 3mo | $115,000 | $85 | 70 |
| 1850 N Robberson Ave | 0.54mi | 3/2.0 | 1,264 (+2%) | 3mo | $199,900 | $158 | 69 |
| 1121 E Thoman St | 0.58mi | 3/2.0 | 1,220 (-2%) | 2mo | $174,900 | $143 | 69 |
| 1530 N National Ave | 0.44mi | 3/1.0 | 1,318 (+6%) | 3mo | $135,000 | $102 | 62 |
| 2051 N East Ave | 0.61mi | 3/1.0 | 1,184 (-4%) | 3mo | $60,000 | $51 | 58 |
| 2027 N Summit Ave | 0.54mi | 3/2.0 | 1,120 (-10%) | 4mo | $150,000 | $134 | 56 |
| 1216 E Commercial St | 0.55mi | 3/2.0 | 1,389 (+12%) | 3mo | $55,000 | $40 | 52 |
| 1077 E Blaine St | 0.41mi | 2/2.0 (-1) | 1,060 (-14%) | 4mo | $149,000 | $141 | 48 |
| 1529 N Fremont Ave | 0.68mi | 3/1.0 | 1,144 (-8%) | 5mo | $99,900 | $87 | 47 |
| 2015 N Benton Ave | 0.57mi | 2/2.0 (-1) | 1,080 (-13%) | 3mo | $129,900 | $120 | 45 |
Match score weights: distance 35% · size 25% · config 20% · recency 20%. Top-matched comps best support the ARV.
Projected returns pro-forma
-3.0% appreciation · 4.24% rent growth · sell at horizon
- IRR
- -19.0%
- Equity multiple
- 0.33×
- Total profit
- $-31,046
- Equity at exit
- $24,602
- IRR
- -9.6%
- Equity multiple
- 0.38×
- Total profit
- $-28,478
- Equity at exit
- $14,266
Cash invested: $46,200 (down + closing). Projections, not guarantees.
Landlord ↔ Tenant lean methodology
- Overall (STATE)
- 81 Strongly Landlord-Friendly
- State Missouri
- 81 Strongly Landlord-Friendly · R+10
- County
- — inherits STATE
- City
- — inherits STATE
ZIP-level market 65803
- Home prices YoY
- -29.8%
- Rents YoY
- 4.2%
- Active inventory
- 394
- Price-to-rent
- 11.8×
Monthly cashflow live
- Estimated rent
- $1,161 high interval (Pro) →
- Mortgage (P&I)
- −$865
- Tax from tax record
- −$73 /mo · $873/yr
- Insurance
- −$69
- HOA
- −$0
- Vacancy / Maint / Mgmt
- −$244
- Net cashflow
- $-90
Break-even live
UW: 25.0% down · 7.5% · 30yr · 1.5% tax · 5.0% vac · 8.0% maint · 8.0% mgmt
Financing live
Cash to close
- Down payment
- $41,250
- Closing costs
- $4,950
- Reserves months
- —
- Total cash needed
- —
Loan-product check · same deal, 3 products live
Conventional
25% down · 7.5% · 30yr
- Down + closing
- —
- Monthly P&I
- —
- Monthly cashflow
- —
- DSCR
- —
- Eligible?
- —
Personal DTI + credit; lowest rate.
DSCR
20% down · 8.5% · 30yr
- Down + closing
- —
- Monthly P&I
- —
- Monthly cashflow
- —
- DSCR
- —
- Eligible?
- —
No personal income docs; deal must DSCR.
Hard money
10% down · 12.0% · 12mo
- Down + closing
- —
- Monthly P&I
- —
- Monthly cashflow
- —
- DSCR
- —
- Eligible?
- —
Short-term bridge; refi at stabilization.
Rent comps 40 comps
| Address | Beds | Baths | Sqft | Rent | $/sqft | DOM | Units | Dist |
|---|---|---|---|---|---|---|---|---|
| 716 E Locust St Unit A Springfield, MO | 2.0 | 1.0 | 915 | $850 | $0.93 | 23d | 1 | 0.08mi |
| 1409 N Washington Ave Springfield, MO | 2.0 | 1.0 | 839 | $1,405 | $1.67 | 13d | 2 | 0.21mi |
| 1306 N Frisco Ave Apt A Springfield, MO | 2.0 | 1.5–2.0 | 970 | $995 | $1.03 | 13d | 19 | 0.36mi |
| 1112 E Locust St Springfield, MO | 2.0 | 1.0 | 840 | $945 | $1.12 | 23d | 1 | 0.37mi |
| 1530 N Robberson Ave Springfield, MO | 3.0 | 2.0 | 1122 | $1,425 | $1.27 | 43d | 1 | 0.41mi |
| 1636 N National Ave Springfield, MO | 3.0 | 1.5 | 1000 | $995 | $0.99 | 43d | 1 | 0.47mi |
| 317 E Chase St Springfield, MO | 2.0 | 2.0 | 915 | $1,100 | $1.20 | 43d | 1 | 0.54mi |
| 805 E Garfield St Springfield, MO | 2.0 | 1.0 | 950 | $950 | $1.00 | 13d | 1 | 0.55mi |
| 203 W Commercial St Unit 2F Springfield, MO | 2.0 | 1.0 | 1000 | $1,150 | $1.15 | 21d | 1 | 0.58mi |
| 2034 N Washington Ave Springfield, MO | 2.0 | 1.0 | 800 | $875 | $1.09 | 43d | 1 | 0.59mi |
| 1339 E Division St Springfield, MO | 3.0 | 2.0 | 1186 | $1,350 | $1.14 | 23d | 1 | 0.60mi |
| 407 E Dale St Apt B Springfield, MO | 2.0 | 1.0 | 720 | $795 | $1.10 | 13d | 1 | 0.72mi |
| 603 W Division St Springfield, MO | 2.0 | 1.0 | 816 | $995 | $1.22 | 13d | 1 | 0.77mi |
| 1529 N Weller Ave Springfield, MO | 2.0 | 1.0 | 870 | $995 | $1.14 | 23d | 1 | 0.80mi |
| 616 W Webster St Springfield, MO | 2.0 | 1.5 | 1178 | $1,050 | $0.89 | 13d | 1 | 0.84mi |
| 2153 N National Ave Springfield, MO | 3.0 | 1.0 | 1163 | $1,195 | $1.03 | 13d | 1 | 0.85mi |
| 1501 E Blaine St Springfield, MO | 2.0 | 1.0 | 958 | $695 | $0.73 | 23d | 1 | 0.87mi |
| 2054 N Rogers Ave Springfield, MO | 2.0 | 1.0 | 888 | $925 | $1.04 | 13d | 1 | 0.89mi |
| 2230 N Campbell Ave Springfield, MO | 2.0 | 1.0 | 1084 | $1,095 | $1.01 | 43d | 1 | 0.99mi |
| 647 W Central St Springfield, MO | 3.0 | 1.0 | 882 | $1,050 | $1.19 | 23d | 1 | 1.01mi |
| 815 N Grant Ave Unit A Springfield, MO | 2.0 | 1.0 | 801 | $625 | $0.78 | 43d | 1 | 1.08mi |
| 2337 N Ramsey Ave Springfield, MO | 2.0 | 1.0 | 882 | $875 | $0.99 | 13d | 1 | 1.08mi |
| 2313 N Rogers Ave Unit 1 Springfield, MO | 2.0 | 2.0 | 882 | $950 | $1.08 | 13d | 1 | 1.11mi |
| 2345 N Prospect Ave Springfield, MO | 2.0 | 1.0 | 792 | $850 | $1.07 | 13d | 1 | 1.12mi |
| 2221 N Weller Ave Springfield, MO | 3.0 | 2.0 | 1215 | $1,395 | $1.15 | 13d | 1 | 1.15mi |
| 1710 E Commercial St Unit B Springfield, MO | 2.0 | 1.0 | 950 | $775 | $0.82 | 43d | 1 | 1.15mi |
| 1447 E Oakwood Ln Springfield, MO | 2.0 | 2.0 | 982 | $1,395 | $1.42 | 43d | 1 | 1.18mi |
| 2508 N National Ave Springfield, MO | 4.0 | 2.0 | 866 | $1,195 | $1.38 | 13d | 1 | 1.26mi |
| 138 Park Central Sq Springfield, MO | 1.0–2.0 | 1.0–2.0 | 1083 | $2,489 | $2.30 | 13d | 8 | 1.27mi |
| 2337 N Delaware Ave Springfield, MO | 2.0 | 1.0 | 876 | $1,195 | $1.36 | 43d | 1 | 1.28mi |
| 309 S Jefferson Ave Unit 211 Springfield, MO | 2.0 | 2.0 | 762 | $767 | $1.01 | 43d | 1 | 1.32mi |
| 235 N Market Ave Springfield, MO | 1.0–4.0 | 1.0–2.0 | 1350 | $1,383 | $1.02 | 13d | 4 | 1.33mi |
| 235 N Market Ave Springfield, MO | 1.0–4.0 | 1.0–2.0 | 1350 | $1,383 | $1.02 | 23d | 5 | 1.33mi |
| 520 W Olive St Springfield, MO | 3.0 | 2.0 | 1445 | $1,538 | $1.06 | 13d | 5 | 1.34mi |
| 926 E Walnut St Unit 11 Springfield, MO | 2.0 | 2.0 | 990 | $1,075 | $1.09 | 43d | 1 | 1.36mi |
| 1014 E Walnut St Springfield, MO | 2.0 | 2.0 | 1200 | $1,200 | $1.00 | 43d | 1 | 1.37mi |
| 2120 N Johnston Ave Springfield, MO | 2.0 | 1.0 | 880 | $925 | $1.05 | 43d | 1 | 1.39mi |
| 518 W College St Unit UBL 106 Springfield, MO | 2.0 | 2.0 | 1200 | $1,375 | $1.15 | 43d | 1 | 1.40mi |
| 211 S Market Ave Springfield, MO | 2.0–4.0 | 1.0–2.0 | 1442 | $1,862 | $1.29 | 23d | 5 | 1.41mi |
| 211 S Market Ave Springfield, MO | 2.0–4.0 | 1.0–2.0 | 1442 | $1,862 | $1.29 | 21d | 5 | 1.41mi |
Listing history 22 events
-
2026-06-18days on market $165,000 Active 100 DOM
-
2026-06-17days on market $165,000 Active 99 DOM
-
2026-06-16days on market $165,000 Active 98 DOM
-
2026-06-15days on market $165,000 Active 97 DOM
-
2026-06-14days on market $165,000 Active 95 DOM
-
2026-06-10days on market $165,000 Active 92 DOM
-
2026-06-09days on market $165,000 Active 91 DOM
-
2026-06-08days on market $165,000 Active 90 DOM
-
2026-06-07days on market $165,000 Active 89 DOM
-
2026-06-03days on market $165,000 Active 85 DOM
-
2026-06-02days on market $165,000 Active 84 DOM
-
2026-06-01days on market $165,000 Active 83 DOM
-
2026-05-31days on market $165,000 Active 82 DOM
-
2026-05-30days on market $165,000 Active 81 DOM
-
2026-03-10$165,000 Active 760-char remark
Show marketing remark (760 chars)
Charming two-story home offering 4 bedrooms and 2 bathrooms! A covered front porch provides a welcoming entrance and a great place to relax. The location is ideal, just minutes from Drury University, OTC, Commercial Street, and Grant Avenue Parkway, offering convenient access to dining, shopping, and local attractions. Inside, the main level features a kitchen with wood cabinets and stainless steel appliances, offering both style and functionality. The home also includes a privacy-fenced yard, providing a great space for outdoor enjoyment. Recent updates include a roof that was replaced approximately four years ago, and gravel has been added to the driveway for convenient parking. This home offers a great combination of comfort and practical updates!
-
2021-08-22$98,000
-
2021-06-08soldstatus
-
2017-01-19soldstatus
-
2017-01-19soldstatus
-
2015-11-25$49,900
-
2014-06-17$58,900
-
2008-04-04soldstatus
ⓘ Source: listings_history table (triggers on properties + properties_extension) + one-shot
backfill from property_details.listing_events for pre-trigger history.
Tax reassessment forecast MO · Resets to sale price
- Current annual tax
- $873 · $73/mo
- Projected year-2 tax
- $1,600 · $133/mo
- Expected delta
- +$728/yr (+$61/mo · 83.4%)
ⓘ Screening estimate from a state-policy table — verify with the county assessor before closing.
Climate risk First Street
- Flood 1/10 Low FEMA zone X (unshaded) · 0% chance over 30 yrs
- Wildfire 1/10 Low
- Heat 5/10 Major 7 d/yr ≥104°F today · 18 d/yr by 30 yrs out
- Wind 2/10 Low
- Air quality 2/10 Low 1 unhealthy d/yr today · 2 by 30 yrs out
Nearby sold comps map
Loading sold comps map…
Walkable amenities ~0.75 mi
Loading nearby amenities…
Taxation est. · year 1
- Rental income
- $13,931
- − Mortgage interest
- −$9,243
- − Property taxes
- −$873
- − Insurance
- −$825
- − Repairs & maintenance
- −$1,114
- − Management
- −$1,114
- − Depreciation
- −$4,800
- Taxable loss
- −$4,039
- Est. tax savings @ 24.0%
- +$969
- After-tax cash flow
- $-107/yr
For passive investors: Depreciation is non-cash, so a rental often shows a tax loss while cash-flowing — sheltering income. Rental losses are passive: they offset passive income freely, and up to $25,000/yr can offset ordinary (W-2) income if you actively participate and your MAGI is under $100k (phasing out to $0 by $150k); unused losses carry forward. On sale, claimed depreciation is recaptured at up to 25%, and gains may owe capital-gains tax (a 1031 exchange can defer both). Figures are a year-1 estimate at your 24.0% rate — not tax advice; consult a CPA.
Schools (NCES district)
- District
- Springfield R-XII
- NCES district ID
- 2928860
- Math proficiency
- 32% ▼ -2.00%
- Reading proficiency
- 46% ▼ -3.00%
- Median HH income
- $37,886
- Composite
- 32.45/100
- National rank
- #5717
- State rank
- #174 of 324 in MO
Livability — Springfield
- Score
- 75/100
- State rank
- #57
- US rank
- #4121
Category grades
Schools grade is shown separately in the Schools card above.
Census & demographics
- Census place
- Springfield, MO
- County
- Greene County · 244,327 people
- City population
- 223,044
- Metro
- Springfield, MO
- Population (ZIP)
- 42,882
- Household income
- $50,572
- Rent vs Own
- Severe rent burden
- 1305.0
Population outlook (Greene County) Hauer SSP2
- Today (2025)
- 319,054 people
- By 2030
- 335,135 · +5.0%
- By 2040
- 366,186 · +14.8%
- By 2050
- 397,431 · +24.6%
- By 2075
- 477,035 · +49.5%
- By 2100
- 520,828 · +63.2%
Race, ethnicity, and origin ACS 2023
- Neighborhood character
- Predominantly White (82%)
- Race & ethnicity
- White 82% Two or more races 9% Hispanic / Latino 6% Black 4%
- Hispanic origin (detail)
- Mexican 2% Puerto Rican 2%
- Common ancestry
- Lithuanian 2% Italian 2% Iranian 2%
- Foreign-born
- 3% · Canada
- Languages at home
- 95% English-only · Spanish 3%
Political lean MEDSL · Greene
- 2024 margin
- Strong R (+20.8) · D 38.9% · R 59.7% · Other 1.4%
- 2008→2024 swing
- -5.0pp toward R · 2008: -15.8pp · 2024: -20.8pp
- All cycles
- 2024: R+20.8 2020: R+20.1 2016: R+27.4 2012: R+24.4 2008: R+15.8
Not yet ingested
- Civics
- —
Market trends
- HPI YoY
- ▼ -87.08%
- Current HPI
- 205.0439
- Rent YoY
- ▲ 4.24%
- Metro
- Springfield, MO
- State GDP YoY
- ▲ 1.84%
- F500 in state
- 20
Industry mix (Fortune 500 HQ in MO)
| Industry | F500 HQs | Revenue |
|---|---|---|
| Healthcare | 1 | $163B |
|
||
| Insurance | 1 | $21B |
|
||
| Industrial Technology | 1 | $17B |
|
||
| Retail | 1 | $16B |
|
||
| Industrial Distribution | 1 | $10B |
|
||
| Utilities | 1 | $9B |
|
||
Price history
+180.1% since first listed8 events — show timeline
- 2026-03-10 Listed $165,000 SOMO
- 2021-08-22 Listed $98,000 SOMO
- 2021-06-08 Sold (Public Records) — Public Records
- 2017-01-19 Sold (Public Records) — Public Records
- 2017-01-19 Sold (MLS) — SOMO
- 2015-11-25 Listed $49,900 SOMO
- 2014-06-17 Listed $58,900 SOMO
- 2008-04-04 Sold (Public Records) — Public Records
Property tax history
+2.2%/yrLatest (2025): $873 · +4.7% YoY. Source: county tax records.
Cash-flow waterfall
monthlySold comps — $/sqft
last 12 mo · ≤1 miLoading sold comps…