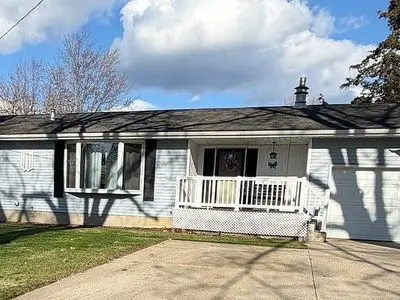
1576 N Roberts Rd · Muskegon, MI
Flood risk 1/10 · Minimal
- FEMA flood zone
- X (unshaded)
- Chance of flooding over 30 yrs
- 0.0%
- Est. flood insurance / yr
- $473 – $860
Fire risk 3/10 · Minor
- Est. fire insurance / yr
- $784 – $1,456
Heat risk 2/10 · Minimal
- Hot days now (above 94°F)
- 7 days/yr
- Hot days in 30 yrs
- 15 days/yr
Wind risk 1/10 · Minimal
- Chance of severe wind over 30 yrs
- —
Air-quality risk 4/10 · Minor
- Unhealthy air days now
- 4 days/yr
- Unhealthy air days in 30 yrs
- 5 days/yr
Risk factors via First Street. Map © Google.
Why this score? — see what drove the D- grade
The composite is a weighted blend of 9 inputs, each scored 0–100. Each bar is that input's sub-score; the figure is the points it added to the 100-point composite (weight × sub-score).
- Appreciation +10.0/10.0
- Cash flow +8.0/30.0
- ARV discount +4.5/15.0
- Livability +4.0/5.0
- Schools +3.2/10.0
- Rent growth +2.5/5.0
- Condition / age +2.5/5.0
- DSCR +2.1/10.0
- 1% rule +1.8/10.0
$290,000
🖨 Deal sheet 📄 Offer letter ✓ Due diligence
Listing remarks
Three bedroom home in the Reeths-Puffer School district. This convenient location is across from the High School and close to the Intermediate and Elementary Schools. This home sits on a very large lot with an extra two stall garage out back. A sunroom is attached to the family room and has a basement. This home is located in a great neighborhood, very close to stores, restaurants, US31 access, and Lake Michigan.
Key facts
- Large lot
- Sunroom
- Us31 access
Tags
Neighborhood map
What this means for you Summary
Snapshot
- This is a 3-bed/1.5-bath single-family listed at $290k.
Deal economics
- At list price, monthly cash flow is $-296 ($-4k/yr) — negative.
- To cash-flow at today's rent, offer at most $238k (18.0% below list).
- To meet the 1% rule (rent ≥ 1% of price), the offer needs to be $198k (31.9% below list).
- Recommended offer: $198k (31.9% below list) — sets the bar for 1% rule.
Location & tenants
- Location reads 79/100 on livability (#92 in MI, #2,096 nationally) — a middle-class / working-renter tenant base. Strengths: amenities A+, commute A+, cost of living A+; Watch: schools D-, crime F, employment F.
- Reeths-Puffer Schools (suburban): math 28% / reading 44% proficiency, ranked #254 of 540 in MI (top 47%) — families likely to look elsewhere, expect single-tenant / working-renter base with shorter leases.
- Market conditions: 142 active listings in the ZIP; 1 comparable units currently listed for rent nearby; 438 units permitted in Muskegon County in 2024 (115 in 5+ unit buildings).
Forward outlook
- In year one you build about $31k of equity ($2k loan paydown + $29k appreciation (10.0% local appreciation)).
- Muskegon County population projected to shrink 8% by 2050 — rents likely to lag national; underwrite the cash flow, not the appreciation.
- By year 2, paydown + projected appreciation supports a ~$50k cash-out refi (75% LTV) — recoverable capital for the next deal without selling this one.
Negotiation context
- Only 1 days on market — expect competitive offers; lowballing is unlikely to land.
Questions for the listing agent
- What do current leases actually rent for vs. the listed asking? Can we see a recent rent roll and the last 12 months of T-12 income?
- Built in 1972 — when were the roof, HVAC, electrical panel, plumbing, and water heater last replaced?
- Is there a deadline driving the sale (1031 exchange, divorce, estate, relocation)? That informs how much negotiation room exists.
- Schools are D-rated, which usually means shorter tenancies and higher turnover. Who's the typical renter profile here, and what's been the actual vacancy rate?
- Crime grade is F in this area — have there been break-ins, vandalism, or insurance claims at this property in the last 3 years? What carrier currently insures it and at what premium?
- The area grade is low — what's the realistic commute time and amenity access for the typical tenant pool here? Any planned neighborhood developments (good or bad) we should know about?
- What's the average days-on-market for RENTAL listings here right now (not sales)? A rising rental-DOM trend means longer vacancies and softer asking-rent achievability than the comps imply.
- What's the recent tenant-quality profile in this submarket — average credit score on applications, eviction rate, late-payment / NSF rate, and stable-employment percentage? A property-management company in the area should have these aggregated.
- How much new for-sale + rental construction is in the pipeline within 1–3 miles? Heavy new supply typically softens prices + rents 12–24 months out; constrained supply supports both.
Investment metrics
- 1% rule
- 0.68% ✗
- Cap rate
- 5.07%
- Cash-on-cash
- -4.38%
- DSCR
- 0.81
- GRM
- 12.2
CMA / ARV
- ARV (on-the-fly)
- $271,783
- Comps found
- 11
Show comp detail 11 sales within ~0.75 mi
| Address | Dist | Beds/Ba | Sqft | Sold | Price | $/sf | Match |
|---|---|---|---|---|---|---|---|
| 1250 Logan Rd | 0.06mi | 3/1.0 | 1,436 (-9%) | 1mo | $214,000 | $149 | 80 |
| 1291 Logan Rd | 0.10mi | 3/2.0 | 1,396 (-11%) | 7mo | $295,900 | $212 | 69 |
| 1460 Destiny Dr | 0.35mi | 3/2.0 | 1,628 (+4%) | 22mo | $339,900 | $209 | 57 |
| 1838 Kings Ct | 0.70mi | 3/1.5 | 1,586 (+1%) | 10mo | $299,900 | $189 | 57 |
| 1290 E Giles Rd | 0.22mi | 3/2.5 | 1,736 (+10%) | 15mo | $300,000 | $173 | 56 |
| 1914 Pappas Rd | 0.44mi | 2/1.0 (-1) | 1,624 (+3%) | 14mo | $205,000 | $126 | 55 |
| 1305 Joslyn Rd | 0.70mi | 3/1.0 | 1,600 (+2%) | 12mo | $252,000 | $158 | 52 |
| 1999 N Roberts Rd | 0.53mi | 3/2.5 | 1,470 (-6%) | 15mo | $250,000 | $170 | 48 |
| 1480 Poulson Rd | 0.75mi | 4/2.0 (+1) | 1,680 (+7%) | 3mo | $265,000 | $158 | 44 |
| 1521 Riblet St | 0.70mi | 3/2.0 | 1,380 (-12%) | 4mo | $240,000 | $174 | 42 |
| 1523 Destiny Dr | 0.40mi | 3/2.5 | 1,364 (-13%) | 18mo | $305,000 | $224 | 40 |
Match score weights: distance 35% · size 25% · config 20% · recency 20%. Top-matched comps best support the ARV.
Projected returns pro-forma
10.0% appreciation · 3.0% rent growth · sell at horizon
- IRR
- 21.2%
- Equity multiple
- 2.71×
- Total profit
- $139,015
- Equity at exit
- $261,255
- IRR
- 19.1%
- Equity multiple
- 6.22×
- Total profit
- $424,092
- Equity at exit
- $563,406
Cash invested: $81,200 (down + closing). Projections, not guarantees.
Landlord ↔ Tenant lean methodology
- Overall (STATE)
- 62 Landlord-Friendly
- State Michigan
- 62 Landlord-Friendly · EVEN
- County
- — inherits STATE
- City
- — inherits STATE
ZIP-level market 49445
- Home prices YoY
- 7.2%
- Active inventory
- 142
- Price-to-rent
- 12.2×
Monthly cashflow live
- Estimated rent
- $1,975 medium interval (Pro) →
- Mortgage (P&I)
- −$1,521
- Tax from tax record
- −$215 /mo · $2,578/yr
- Insurance
- −$121
- HOA
- −$0
- Vacancy / Maint / Mgmt
- −$415
- Net cashflow
- $-296
Break-even live
UW: 25.0% down · 7.5% · 30yr · 1.5% tax · 5.0% vac · 8.0% maint · 8.0% mgmt
Financing live
Cash to close
- Down payment
- $72,500
- Closing costs
- $8,700
- Reserves months
- —
- Total cash needed
- —
Loan-product check · same deal, 3 products live
Conventional
25% down · 7.5% · 30yr
- Down + closing
- —
- Monthly P&I
- —
- Monthly cashflow
- —
- DSCR
- —
- Eligible?
- —
Personal DTI + credit; lowest rate.
DSCR
20% down · 8.5% · 30yr
- Down + closing
- —
- Monthly P&I
- —
- Monthly cashflow
- —
- DSCR
- —
- Eligible?
- —
No personal income docs; deal must DSCR.
Hard money
10% down · 12.0% · 12mo
- Down + closing
- —
- Monthly P&I
- —
- Monthly cashflow
- —
- DSCR
- —
- Eligible?
- —
Short-term bridge; refi at stabilization.
Rent comps 1 comps
| Address | Beds | Baths | Sqft | Rent | $/sqft | DOM | Units | Dist |
|---|---|---|---|---|---|---|---|---|
| 1990 Pappas Rd Muskegon, MI | 3.0 | 2.0 | 1468 | $1,975 | $1.35 | 21d | 1 | 0.54mi |
Listing history 2 events
-
2026-05-13status Under Contract
-
2026-05-12$290,000 Active
ⓘ Source: listings_history table (triggers on properties + properties_extension) + one-shot
backfill from property_details.listing_events for pre-trigger history.
Tax reassessment forecast MI · Partial reset (capped growth)
- Current annual tax
- $2,578 · $215/mo
- Projected year-2 tax
- $3,522 · $293/mo
- Expected delta
- +$944/yr (+$79/mo · 36.6%)
ⓘ Screening estimate from a state-policy table — verify with the county assessor before closing.
Climate risk First Street
- Flood 1/10 Low FEMA zone X (unshaded) · 0% chance over 30 yrs
- Wildfire 3/10 Moderate
- Heat 2/10 Low 7 d/yr ≥94°F today · 15 d/yr by 30 yrs out
- Wind 1/10 Low
- Air quality 4/10 Moderate 4 unhealthy d/yr today · 5 by 30 yrs out
Nearby sold comps map
Loading sold comps map…
Walkable amenities ~0.75 mi
Loading nearby amenities…
Taxation est. · year 1
- Rental income
- $23,700
- − Mortgage interest
- −$16,245
- − Property taxes
- −$2,578
- − Insurance
- −$1,450
- − Repairs & maintenance
- −$1,896
- − Management
- −$1,896
- − Depreciation
- −$8,436
- Taxable loss
- −$8,801
- Est. tax savings @ 24.0%
- +$2,112
- After-tax cash flow
- $-1,442/yr
For passive investors: Depreciation is non-cash, so a rental often shows a tax loss while cash-flowing — sheltering income. Rental losses are passive: they offset passive income freely, and up to $25,000/yr can offset ordinary (W-2) income if you actively participate and your MAGI is under $100k (phasing out to $0 by $150k); unused losses carry forward. On sale, claimed depreciation is recaptured at up to 25%, and gains may owe capital-gains tax (a 1031 exchange can defer both). Figures are a year-1 estimate at your 24.0% rate — not tax advice; consult a CPA.
Schools (NCES district)
- District
- Reeths-Puffer Schools
- NCES district ID
- 2629540
- Math proficiency
- 28% ▼ -9.00%
- Reading proficiency
- 44% ▼ -4.00%
- Median HH income
- $55,223
- Composite
- 31.62/100
- National rank
- #5942
- State rank
- #254 of 540 in MI
Livability — Muskegon
- Score
- 79/100
- State rank
- #92
- US rank
- #2096
Category grades
Schools grade is shown separately in the Schools card above.
Census & demographics
- City population
- 44,766
- Population (ZIP)
- 21,090
Population outlook (Muskegon County) Hauer SSP2
- Today (2025)
- 174,032 people
- By 2030
- 173,365 · -0.4%
- By 2040
- 168,877 · -3.0%
- By 2050
- 160,306 · -7.9%
- By 2075
- 134,426 · -22.8%
- By 2100
- 98,836 · -43.2%
Race, ethnicity, and origin ACS 2023
- Neighborhood character
- Predominantly White (86%)
- Race & ethnicity
- White 86% Two or more races 8% Hispanic / Latino 6% Black 2%
- Hispanic origin (detail)
- Mexican 5%
- Common ancestry
- Iranian 10% Romanian 4% Italian 3%
- Foreign-born
- 2% · Canada
- Languages at home
- 96% English-only · Spanish 4%
Political lean MEDSL · Muskegon
- 2024 margin
- Toss-up / Even · D 48.4% · R 50.2% · Other 1.5%
- 2008→2024 swing
- -31.1pp toward R · 2008: 29.3pp · 2024: -1.8pp
- All cycles
- 2024: R+1.8 2020: D+0.6 2016: D+0.9 2012: D+17.8 2008: D+29.3
Not yet ingested
- Civics
- —
Market trends
- HPI YoY
- ▲ 40.82%
- Current HPI
- 605.31
- Rent YoY
- —
- Metro
- —
- State GDP YoY
- ▲ 1.37%
- F500 in state
- 28
Industry mix (Fortune 500 HQ in MI)
| Industry | F500 HQs | Revenue |
|---|---|---|
| Automotive Parts | 3 | $48B |
|
||
| Automotive | 2 | $372B |
|
||
| Chemicals | 1 | $45B |
|
||
| Automotive Retail | 1 | $29B |
|
||
| Healthcare / Medical Devices | 1 | $23B |
|
||
| Automotive Technology | 1 | $20B |
|
||
Price history
2 events — show timeline
- 2026-05-13 Pending — FSBO.com
- 2026-05-12 Listed $290,000 FSBO.com
Property tax history
+4.1%/yrLatest (2025): $2,578 · +2.2% YoY. Source: county tax records.
Cash-flow waterfall
monthlySold comps — $/sqft
last 12 mo · ≤1 miLoading sold comps…