1024 W Pleasant St · Springfield, OH
Flood risk 1/10 · Minimal
- FEMA flood zone
- X (unshaded)
- Chance of flooding over 30 yrs
- 0.0%
- Est. flood insurance / yr
- $473 – $860
Fire risk 1/10 · Minimal
- Est. fire insurance / yr
- $713 – $1,323
Heat risk 3/10 · Minor
- Hot days now (above 100°F)
- 7 days/yr
- Hot days in 30 yrs
- 18 days/yr
Wind risk 2/10 · Minimal
- Chance of severe wind over 30 yrs
- 0.0%
Air-quality risk 3/10 · Minor
- Unhealthy air days now
- 2 days/yr
- Unhealthy air days in 30 yrs
- 3 days/yr
Risk factors via First Street. Map © Google.
Why this score? — see what drove the B grade
The composite is a weighted blend of 9 inputs, each scored 0–100. Each bar is that input's sub-score; the figure is the points it added to the 100-point composite (weight × sub-score).
- Cash flow +30.0/30.0
- ARV discount +15.0/15.0
- 1% rule +10.0/10.0
- DSCR +10.0/10.0
- Livability +2.8/5.0
- Rent growth +2.5/5.0
- Condition / age +2.5/5.0
- Schools +1.9/10.0
- Appreciation +0.0/10.0
$65,000
🖨 Deal sheet 📄 Offer letter ✓ Due diligence
Listing remarks MLS
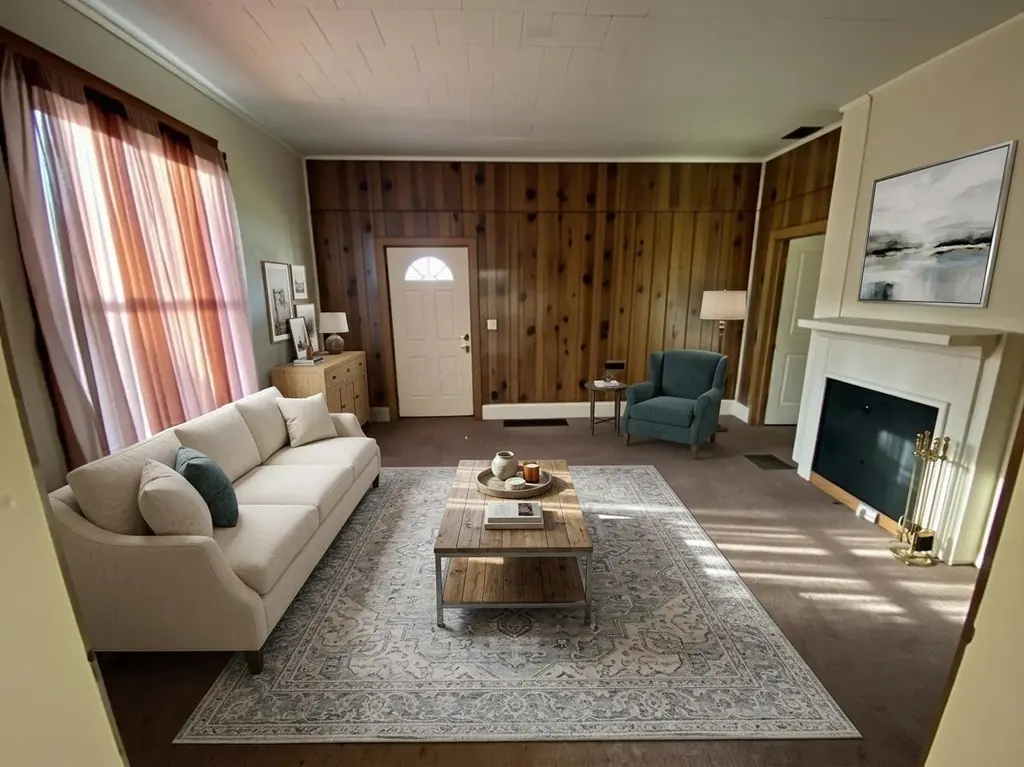
This is the perfect first time buyers home! We are in the process of a clean out as well as a mini renovation. The rest is up to you and your personal tastes. You will surly fall in love with this home once we finish making it a blank canvas for you to add your own touches to. ALL PHOTOS ARE VIRTUAL.
Key facts
- 6,534 sq ft lot
- 2 garage spots
- Built 1900
Neighborhood map
What this means for you Summary
Snapshot
- This is a 3-bed/1.0-bath single-family listed at $65k.
Deal economics
- At list price, monthly cash flow is $809 ($10k/yr) — positive.
- The deal already cash-flows at list — no discount required.
- Meets the 1% rule at list price ($2k rent vs $65k).
- Recommended offer: $63k (3.0% below list) — sets the bar for market timing.
- Cap rate 21.2% vs local median 4.8% in Springfield — top-decile yield for the area; either an underpriced asset or a hidden risk that comps aren't pricing in. Stress-test before assuming the spread holds.
Location & tenants
- Location reads 56/100 on livability (#1,108 in OH) — a working-class tenant base; expect higher turnover. Strengths: cost of living A+, housing A+; Watch: crime F, amenities F, commute F.
- Springfield City School District (urban): math 20% / reading 27% proficiency, ranked #616 of 656 in OH (top 94%) — low school quality limits family demand, transient renter base, plan for 1-2y turnover; 75% free/reduced lunch — lower-income household profile, screen leases tightly.
- Market conditions: 45 active listings in the ZIP; 12 comparable units currently listed for rent nearby; rentals leasing fast (median 11d on market — plan ~1-2 weeks tenant-placement turnaround); lower-income renter base — watch delinquency; 232 units permitted in Clark County in 2024 (116 in 5+ unit buildings).
- At $1,593/mo this rent would consume 45% of the median local household income ($42k/yr) (locally 684% of renters already pay >50% of income on rent) — very limited rent-growth headroom before tenants either downsize or default.
Forward outlook
- Local home prices are declining (-3.0%/yr); year-one equity from $449 of loan paydown is wiped out by about $2k of value loss. Plan a longer hold.
- Clark County population projected at -16% by 2050 — secular population decline; favor cash flow + early exit over multi-decade hold.
- At projected returns (-3.0% appreciation + 3.0% rent growth), your $18k cash investment doubles in ~3 years — after that, you're playing with house money.
Negotiation context
- It's been on market 56 days — a 3% lower offer ($63k) is reasonable based on typical stale-listing flexibility.
- 2 sale attempts; this cycle's ask has dropped $45k (41%) from the opening price — seller is motivated, your offer sets the floor, not the list.
- Current owner paid $38k; list at $65k implies a 70% gain — meaningful room to come down on a strong offer.
Risks & watch-outs
- Watch-outs: built in 1900 — expect roof / HVAC / electrical / plumbing capex.
Questions for the listing agent
- It's been on market 56 days. Have you received any prior offers? Is the seller open to a 3% concession, seller financing, or rate buy-down credit?
- Built in 1900 — when were the roof, HVAC, electrical panel, plumbing, and water heater last replaced?
- Is there a deadline driving the sale (1031 exchange, divorce, estate, relocation)? That informs how much negotiation room exists.
- Crime grade is F in this area — have there been break-ins, vandalism, or insurance claims at this property in the last 3 years? What carrier currently insures it and at what premium?
- What's the average days-on-market for RENTAL listings here right now (not sales)? A rising rental-DOM trend means longer vacancies and softer asking-rent achievability than the comps imply.
- What's the recent tenant-quality profile in this submarket — average credit score on applications, eviction rate, late-payment / NSF rate, and stable-employment percentage? A property-management company in the area should have these aggregated.
- How much new for-sale + rental construction is in the pipeline within 1–3 miles? Heavy new supply typically softens prices + rents 12–24 months out; constrained supply supports both.
Investment metrics
- 1% rule
- 2.45% ✓
- Cap rate
- 21.23%
- Cash-on-cash
- 53.34%
- DSCR
- 3.37
- GRM
- 3.4
CMA / ARV
- ARV (median comp)
- $83,645
- List price
- $65,000
- Delta
- -22.29%
- Verdict
- UNDERPRICED
- Comps
- 20 within 1.0 mi
Show comp detail 12 sales within ~0.75 mi
| Address | Dist | Beds/Ba | Sqft | Sold | Price | $/sf | Match |
|---|---|---|---|---|---|---|---|
| 1235 W Jefferson St | 0.21mi | 3/1.5 | 1,176 (-0%) | 11mo | $130,000 | $111 | 78 |
| 1207 W Pleasant St | 0.12mi | 2/1.0 (-1) | 1,328 (+13%) | 4mo | $134,900 | $102 | 65 |
| 1212 W Pleasant St | 0.12mi | 4/2.0 (+1) | 1,300 (+10%) | 6mo | $164,000 | $126 | 63 |
| 1701 W Jefferson St | 0.55mi | 2/1.0 (-1) | 1,230 (+4%) | 1mo | $115,000 | $93 | 62 |
| 1530 W Main St | 0.57mi | 3/2.0 | 1,182 (+0%) | 10mo | $55,000 | $47 | 60 |
| 1504 W High St | 0.48mi | 2/2.0 (-1) | 1,120 (-5%) | 3mo | $61,000 | $54 | 58 |
| 134 S Light St | 0.38mi | 3/1.0 | 1,053 (-11%) | 9mo | $126,500 | $120 | 57 |
| 908 Cedar St | 0.66mi | 3/1.0 | 1,255 (+6%) | 10mo | $60,000 | $48 | 50 |
| 306 N Bechtle Ave | 0.71mi | 3/1.0 | 1,288 (+9%) | 2mo | $169,900 | $132 | 50 |
| 329 Fair St | 0.63mi | 2/1.0 (-1) | 1,252 (+6%) | 7mo | $97,000 | $77 | 49 |
| 770 W State St | 0.60mi | 3/1.5 | 1,328 (+13%) | 2mo | $105,000 | $79 | 47 |
| 14 Seever St | 0.61mi | 2/1.0 (-1) | 1,100 (-7%) | 10mo | $108,500 | $99 | 46 |
Match score weights: distance 35% · size 25% · config 20% · recency 20%. Top-matched comps best support the ARV.
Projected returns pro-forma
-3.0% appreciation · 3.0% rent growth · sell at horizon
- IRR
- 51.4%
- Equity multiple
- 3.25×
- Total profit
- $41,014
- Equity at exit
- $9,692
- IRR
- 56.8%
- Equity multiple
- 6.61×
- Total profit
- $102,157
- Equity at exit
- $5,620
Cash invested: $18,200 (down + closing). Projections, not guarantees.
Landlord ↔ Tenant lean methodology
- Overall (STATE)
- 73 Landlord-Friendly
- State Ohio
- 73 Landlord-Friendly · R+6
- County
- — inherits STATE
- City
- — inherits STATE
ZIP-level market 45506
- Home prices YoY
- -14.1%
- Active inventory
- 45
- Price-to-rent
- 3.4×
Monthly cashflow live
- Estimated rent
- $1,593 high interval (Pro) →
- Mortgage (P&I)
- −$341
- Tax est. 1.5%
- −$81 /mo · $975/yr
- Insurance
- −$27
- HOA
- −$0
- Vacancy / Maint / Mgmt
- −$334
- Net cashflow
- $809
Break-even live
UW: 25.0% down · 7.5% · 30yr · 1.5% tax · 5.0% vac · 8.0% maint · 8.0% mgmt
Financing live
Cash to close
- Down payment
- $16,250
- Closing costs
- $1,950
- Reserves months
- —
- Total cash needed
- —
Loan-product check · same deal, 3 products live
Conventional
25% down · 7.5% · 30yr
- Down + closing
- —
- Monthly P&I
- —
- Monthly cashflow
- —
- DSCR
- —
- Eligible?
- —
Personal DTI + credit; lowest rate.
DSCR
20% down · 8.5% · 30yr
- Down + closing
- —
- Monthly P&I
- —
- Monthly cashflow
- —
- DSCR
- —
- Eligible?
- —
No personal income docs; deal must DSCR.
Hard money
10% down · 12.0% · 12mo
- Down + closing
- —
- Monthly P&I
- —
- Monthly cashflow
- —
- DSCR
- —
- Eligible?
- —
Short-term bridge; refi at stabilization.
Rent comps 12 comps
| Address | Beds | Baths | Sqft | Rent | $/sqft | DOM | Units | Dist |
|---|---|---|---|---|---|---|---|---|
| 524 W Pleasant St Springfield, OH | 4.0 | 2.0 | 1456 | $1,645 | $1.13 | 11d | 1 | 0.45mi |
| 523 W Mulberry St Springfield, OH | 4.0 | 2.0 | 1456 | $1,825 | $1.25 | 11d | 1 | 0.45mi |
| 302 S Yellow Springs St Springfield, OH | 4.0 | 2.0 | 1456 | $1,845 | $1.27 | 11d | 1 | 0.48mi |
| 220 S Yellow Springs St Springfield, OH | 4.0 | 2.0 | 1456 | $1,645 | $1.13 | 23d | 1 | 0.51mi |
| 306 S Plum St Springfield, OH | 4.0 | 2.0 | 1352 | $1,700 | $1.26 | 43d | 1 | 0.60mi |
| 545 W Grand Ave Springfield, OH | 4.0 | 2.0 | 1456 | $1,595 | $1.10 | 3d | 1 | 0.61mi |
| 307 N Isabella St Unit 309 Springfield, OH | 3.0 | 1.5 | 1300 | $1,400 | $1.08 | 2d | 1 | 0.71mi |
| 826 Grant St Springfield, OH | 2.0 | 1.0 | 950 | $1,200 | $1.26 | 2d | 1 | 0.81mi |
| 1452 S Wittenberg Ave Springfield, OH | 2.0 | 1.0 | 937 | $1,010 | $1.08 | 1d | 1 | 1.06mi |
| 18 E Grand Ave Springfield, OH | 4.0 | 2.0 | 1452 | $1,575 | $1.08 | 19d | 1 | 1.12mi |
| 1306 S Limestone St Springfield, OH | 4.0 | 2.0 | 1452 | $1,695 | $1.17 | 21d | 1 | 1.25mi |
| 313 E Rose St Springfield, OH | 3.0 | 1.0 | 828 | $1,200 | $1.45 | 23d | 1 | 1.47mi |
Listing history 24 events
-
2026-06-19days on market $65,000 Active 56 DOM
-
2026-06-18days on market $65,000 Active 55 DOM
-
2026-06-17days on market $65,000 Active 54 DOM
-
2026-06-16days on market $65,000 Active 53 DOM
-
2026-06-15days on market $65,000 Active 52 DOM
-
2026-06-14days on market $65,000 Active 50 DOM
-
2026-06-12days on market $65,000 Active 49 DOM
-
2026-06-09pricedays on market $65,000 Active 46 DOM
-
2026-06-08days on market $85,000 Active 45 DOM
-
2026-06-07pricedays on market $85,000 Active 44 DOM
-
2026-06-05days on market $95,000 Active 41 DOM
-
2026-06-02days on market $95,000 Active 39 DOM
-
2026-06-01days on market $95,000 Active 38 DOM
-
2026-05-31days on market $95,000 Active 37 DOM
-
2026-05-30days on market $95,000 Active 36 DOM
-
2026-05-16price $95,000 302-char remark
Show marketing remark (302 chars)
This is the perfect first time buyers home! We are in the process of a clean out as well as a mini renovation. The rest is up to you and your personal tastes. You will surly fall in love with this home once we finish making it a blank canvas for you to add your own touches to. ALL PHOTOS ARE VIRTUAL.
-
2026-05-07price $100,000 302-char remark
Show marketing remark (302 chars)
This is the perfect first time buyers home! We are in the process of a clean out as well as a mini renovation. The rest is up to you and your personal tastes. You will surly fall in love with this home once we finish making it a blank canvas for you to add your own touches to. ALL PHOTOS ARE VIRTUAL.
-
2026-04-24$110,000 Active 302-char remark
Show marketing remark (302 chars)
This is the perfect first time buyers home! We are in the process of a clean out as well as a mini renovation. The rest is up to you and your personal tastes. You will surly fall in love with this home once we finish making it a blank canvas for you to add your own touches to. ALL PHOTOS ARE VIRTUAL.
-
2026-04-16historical $110,000 302-char remark
Show marketing remark (302 chars)
This is the perfect first time buyers home! We are in the process of a clean out as well as a mini renovation. The rest is up to you and your personal tastes. You will surly fall in love with this home once we finish making it a blank canvas for you to add your own touches to. ALL PHOTOS ARE VIRTUAL.
-
2025-08-31historical
-
2025-05-02$180,000 Active
-
2025-04-23historical
-
1998-02-23soldstatus $38,200
-
1987-12-10soldstatus $26,000
ⓘ Source: listings_history table (triggers on properties + properties_extension) + one-shot
backfill from property_details.listing_events for pre-trigger history.
Climate risk First Street
- Flood 1/10 Low FEMA zone X (unshaded) · 0% chance over 30 yrs
- Wildfire 1/10 Low
- Heat 3/10 Moderate 7 d/yr ≥100°F today · 18 d/yr by 30 yrs out
- Wind 2/10 Low 0% chance of damaging wind over 30 yrs
- Air quality 3/10 Moderate 2 unhealthy d/yr today · 3 by 30 yrs out
Nearby sold comps map
Loading sold comps map…
Walkable amenities ~0.75 mi
Loading nearby amenities…
Taxation est. · year 1
- Rental income
- $19,111
- − Mortgage interest
- −$3,641
- − Property taxes
- −$975
- − Insurance
- −$325
- − Repairs & maintenance
- −$1,529
- − Management
- −$1,529
- − Depreciation
- −$1,891
- Taxable income
- $9,222
- Est. tax owed @ 24.0%
- −$2,213
- After-tax cash flow
- $7,494/yr
For passive investors: Depreciation is non-cash, so a rental often shows a tax loss while cash-flowing — sheltering income. Rental losses are passive: they offset passive income freely, and up to $25,000/yr can offset ordinary (W-2) income if you actively participate and your MAGI is under $100k (phasing out to $0 by $150k); unused losses carry forward. On sale, claimed depreciation is recaptured at up to 25%, and gains may owe capital-gains tax (a 1031 exchange can defer both). Figures are a year-1 estimate at your 24.0% rate — not tax advice; consult a CPA.
Schools (NCES district)
- District
- Springfield City School District
- NCES district ID
- 3904481
- Math proficiency
- 20% ▼ -16.00%
- Reading proficiency
- 27% ▼ -12.00%
- Median HH income
- $32,541
- Composite
- 19.12/100
- National rank
- #8834
- State rank
- #616 of 656 in OH
Livability — Springfield
- Score
- 56/100
- State rank
- #1108
- US rank
- #22551
Category grades
Schools grade is shown separately in the Schools card above.
Census & demographics
- Census place
- Springfield, OH
- County
- Clark County · 33,261 people
- City population
- 33,261
- Metro
- Springfield, OH
- Population (ZIP)
- 13,435
- Household income
- $42,104
- Rent vs Own
- Severe rent burden
- 684.0
Population outlook (Clark County) Hauer SSP2
- Today (2025)
- 130,703 people
- By 2030
- 126,952 · -2.9%
- By 2040
- 118,344 · -9.5%
- By 2050
- 109,590 · -16.2%
- By 2075
- 89,464 · -31.6%
- By 2100
- 68,810 · -47.4%
Race, ethnicity, and origin ACS 2023
- Neighborhood character
- Diverse neighborhood (Simpson 0.62)
- Race & ethnicity
- White 53% Black 30% Two or more races 10% Hispanic / Latino 8%
- Hispanic origin (detail)
- Mexican 4% Puerto Rican 1%
- Common ancestry
- Serbian 2% Romanian 1% Iranian 1%
- Foreign-born
- 4% · Canada
- Languages at home
- 95% English-only · Spanish 4% Other Asian/Pacific 1%
Political lean MEDSL · Clark
- 2024 margin
- Strong R (+29.5) · D 34.8% · R 64.3%
- 2008→2024 swing
- -27.0pp toward R · 2008: -2.5pp · 2024: -29.5pp
- All cycles
- 2024: R+29.5 2020: R+23.3 2016: R+19.5 2012: R+1.8 2008: R+2.5
Not yet ingested
- Civics
- —
Market trends
- HPI YoY
- ▼ -46.97%
- Current HPI
- 286.2883
- Rent YoY
- —
- Metro
- Springfield, OH
- State GDP YoY
- ▲ 1.98%
- F500 in state
- 48
Industry mix (Fortune 500 HQ in OH)
| Industry | F500 HQs | Revenue |
|---|---|---|
| Insurance | 3 | $145B |
|
||
| Industrial Machinery | 3 | $49B |
|
||
| Financial Services | 3 | $24B |
|
||
| Consumer Goods | 2 | $93B |
|
||
| Aerospace / Defense | 2 | $47B |
|
||
| Utilities | 2 | $33B |
|
||
Price history
+265.4% since first listed9 events — show timeline
- 2026-05-16 Price Changed $95,000 CBRMLS
- 2026-05-07 Price Changed $100,000 CBRMLS
- 2026-04-24 Listed $110,000 CBRMLS
- 2026-04-16 Coming Soon $110,000 CBRMLS
- 2025-08-31 Listing Removed — CBRMLS
- 2025-05-02 Listed $180,000 CBRMLS
- 2025-04-23 Coming Soon — CBRMLS
- 1998-02-23 Sold (Public Records) $38,200 Public Records
- 1987-12-10 Sold (Public Records) $26,000 Public Records
Property tax history
+43.5%/yrLatest (2025): $6,522 · +24.6% YoY. Source: county tax records.
Cash-flow waterfall
monthlySold comps — $/sqft
last 12 mo · ≤1 miLoading sold comps…