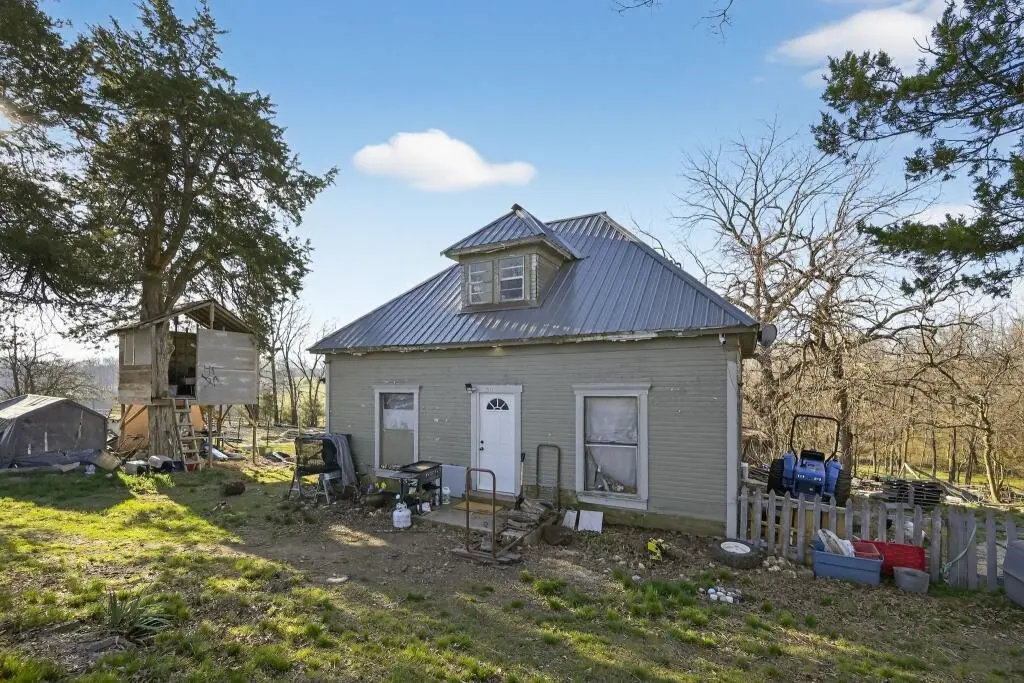
511 E 7th St · Miller, MO
Flood risk 1/10 · Minimal
- FEMA flood zone
- X (unshaded)
- Chance of flooding over 30 yrs
- 0.0%
- Est. flood insurance / yr
- $507 – $1,088
Fire risk 5/10 · Moderate
- Est. fire insurance / yr
- $1,054 – $1,958
Heat risk 4/10 · Minor
- Hot days now (above 105°F)
- 7 days/yr
- Hot days in 30 yrs
- 18 days/yr
Wind risk 2/10 · Minimal
- Chance of severe wind over 30 yrs
- 2.0%
Air-quality risk 2/10 · Minimal
- Unhealthy air days now
- 0 days/yr
- Unhealthy air days in 30 yrs
- 1 days/yr
Risk factors via First Street. Map © Google.
Why this score? — see what drove the D grade
The composite is a weighted blend of 9 inputs, each scored 0–100. Each bar is that input's sub-score; the figure is the points it added to the 100-point composite (weight × sub-score).
- ARV discount +15.0/15.0
- Cash flow +11.8/30.0
- DSCR +3.5/10.0
- 1% rule +3.4/10.0
- Livability +3.1/5.0
- Rent growth +2.5/5.0
- Schools +2.5/10.0
- Condition / age +1.0/5.0
- Appreciation +0.0/10.0
$120,000
🖨 Deal sheet (PDF) 📄 Offer letter ✓ Due diligence
Listing remarks MLS
Wonderful location down from Miller High school right on the edge of town. This amazing lot is almost 10 acres of woods with a draw in the middle. Would be a great spot to remodel or build. Home need's some work but has potential. You can enter the property from 7th st or Hunter's st.
Key facts
- 10 acres of woods
- 10 acre lot
- Built 1900
Tags
Property features AI
Exterior
- Utilities: Public water; Septic tank sewer; Propane utility
- Home design: Single-family residence; Residential property
- Exterior features: 10-acre lot
Interior
- Flooring: Hardwood
- Bathrooms: One full bathroom
- Heating & cooling: Central heating; Propane heating; Other heating; Window air conditioning units
- Interior features: Hardwood floors; 1 full bathroom
Neighborhood map
What this means for you Summary
Snapshot
- This is a 3-bed/1.0-bath single-family listed at $120k. Condition is rated poor.
Deal economics
- At list price, monthly cash flow is $-34 ($-406/yr) — negative.
- To cash-flow at today's rent, offer at most $115k (4.1% below list).
- To meet the 1% rule (rent ≥ 1% of price), the offer needs to be $101k (16.1% below list).
- Recommended offer: $101k (16.1% below list) — sets the bar for 1% rule.
Location & tenants
- Location reads 62/100 on livability (#405 in MO) — a middle-class / working-renter tenant base. Strengths: cost of living A+, housing A+; Watch: crime F, amenities F, commute F.
- Miller R-II (rural): math 25% / reading 33% proficiency, ranked #276 of 324 in MO (top 85%) — low school quality limits family demand, transient renter base, plan for 1-2y turnover.
- Zoned schools: Central Elem. (math 37% / reading 37%, grade F, #611 of 1,115 statewide, top 59%, 300 students, 64% FRL); Miller High (math 12% / reading 32%, grade F, #462 of 521 statewide, top 90%, 288 students, 54% FRL).
- Market conditions: 12 active listings in the ZIP; 67 units permitted in Lawrence County in 2024 (35 in 5+ unit buildings).
Forward outlook
- Local home prices are declining (-3.0%/yr); year-one equity from $830 of loan paydown is wiped out by about $4k of value loss. Plan a longer hold.
- Lawrence County population projected at -15% by 2050 — secular population decline; favor cash flow + early exit over multi-decade hold.
Negotiation context
- It's been on market 15 days — a 2% lower offer ($118k) is reasonable based on typical stale-listing flexibility.
- 2 sale attempts since 8y ago with the ask held roughly flat each time — persistent listings suggest the price (not the market) is what's stuck; bring a comps-based counter.
Risks & watch-outs
- Watch-outs: built in 1900 — expect roof / HVAC / electrical / plumbing capex.
- Climate carrying-cost: moderate wildfire risk — expect insurance premiums to compound above CPI over the hold.
Questions for the listing agent
- What do current leases actually rent for vs. the listed asking? Can we see a recent rent roll and the last 12 months of T-12 income?
- Have any recent inspections been done? Can we get a copy of the seller's disclosures and any deferred-maintenance estimates?
- Built in 1900 — when were the roof, HVAC, electrical panel, plumbing, and water heater last replaced?
- Is there a deadline driving the sale (1031 exchange, divorce, estate, relocation)? That informs how much negotiation room exists.
- Schools are D-rated, which usually means shorter tenancies and higher turnover. Who's the typical renter profile here, and what's been the actual vacancy rate?
- Crime grade is F in this area — have there been break-ins, vandalism, or insurance claims at this property in the last 3 years? What carrier currently insures it and at what premium?
- The area grade is low — what's the realistic commute time and amenity access for the typical tenant pool here? Any planned neighborhood developments (good or bad) we should know about?
- What's the average days-on-market for RENTAL listings here right now (not sales)? A rising rental-DOM trend means longer vacancies and softer asking-rent achievability than the comps imply.
- What's the recent tenant-quality profile in this submarket — average credit score on applications, eviction rate, late-payment / NSF rate, and stable-employment percentage? A property-management company in the area should have these aggregated.
- How much new for-sale + rental construction is in the pipeline within 1–3 miles? Heavy new supply typically softens prices + rents 12–24 months out; constrained supply supports both.
Investment metrics
- 1% rule
- 0.84% ✗
- Cap rate
- 5.95%
- Cash-on-cash
- -1.21%
- DSCR
- 0.95
- GRM
- 9.9
CMA / ARV
- ARV (median comp)
- $151,800
- List price
- $120,000
- Delta
- -20.95%
- Verdict
- UNDERPRICED
- Comps
- 20 within 1.0 mi
Show comp detail 5 sales within ~0.75 mi
| Address | Dist | Beds/Ba | Sqft | Sold | Price | $/sf | Match |
|---|---|---|---|---|---|---|---|
| 308 E 3rd St | 0.35mi | 2/1.0 (-1) | 990 (-4%) | 14mo | $157,000 | $159 | 60 |
| 206 W Third St | 0.56mi | 2/1.5 (-1) | 1,022 (-1%) | 16mo | $149,000 | $146 | 52 |
| 114 N Hobbs St | 0.43mi | 2/1.0 (-1) | 896 (-13%) | 8mo | $139,900 | $156 | 46 |
| 511 N Washam St | 0.31mi | 2/1.0 (-1) | 878 (-15%) | 13mo | $115,000 | $131 | 45 |
| 207 E Highway Dd St | 0.64mi | 3/1.0 | 1,118 (+8%) | 21mo | $170,000 | $152 | 39 |
Match score weights: distance 35% · size 25% · config 20% · recency 20%. Top-matched comps best support the ARV.
Projected returns pro-forma
-3.0% appreciation · 3.0% rent growth · sell at horizon
- IRR
- -18.3%
- Equity multiple
- 0.36×
- Total profit
- $-21,587
- Equity at exit
- $17,892
- IRR
- -10.6%
- Equity multiple
- 0.36×
- Total profit
- $-21,514
- Equity at exit
- $10,375
Cash invested: $33,600 (down + closing). Projections, not guarantees.
Landlord ↔ Tenant lean methodology
- Overall (STATE)
- 81 Strongly Landlord-Friendly
- State Missouri
- 81 Strongly Landlord-Friendly · R+10
- County
- — inherits STATE
- City
- — inherits STATE
ZIP-level market 65707
- Home prices YoY
- -10.8%
- Active inventory
- 12
- Price-to-rent
- 9.9×
Monthly cashflow live
- Estimated rent
- $1,007 medium interval (Pro) →
- Mortgage (P&I)
- −$629
- Tax est. 1.5%
- −$150 /mo · $1,800/yr
- Insurance
- −$50
- HOA
- −$0
- Vacancy / Maint / Mgmt
- −$211
- Net cashflow
- $-34
Break-even live
Sensitivity live
| Price | -10% $49 | -5% $8 | +0% $-34 | +5% $-75 | +10% $-117 |
|---|---|---|---|---|---|
| Rent | -10% $-113 | -5% $-74 | +0% $-34 | +5% $6 | +10% $46 |
| Rate | -1.0pp $27 | -0.5pp $-3 | base $-34 | +0.5pp $-65 | +1.0pp $-97 |
UW: 25.0% down · 7.5% · 30yr · 1.5% tax · 5.0% vac · 8.0% maint · 8.0% mgmt
Financing live
Cash to close
- Down payment
- $30,000
- Closing costs
- $3,600
- Reserves months
- —
- Total cash needed
- —
Loan-product check · same deal, 3 products live
Conventional
25% down · 7.5% · 30yr
- Down + closing
- —
- Monthly P&I
- —
- Monthly cashflow
- —
- DSCR
- —
- Eligible?
- —
Personal DTI + credit; lowest rate.
DSCR
20% down · 8.5% · 30yr
- Down + closing
- —
- Monthly P&I
- —
- Monthly cashflow
- —
- DSCR
- —
- Eligible?
- —
No personal income docs; deal must DSCR.
Hard money
10% down · 12.0% · 12mo
- Down + closing
- —
- Monthly P&I
- —
- Monthly cashflow
- —
- DSCR
- —
- Eligible?
- —
Short-term bridge; refi at stabilization.
Listing history 4 events
-
2026-05-06status Pending 223-char remark
-
2026-04-21$120,000 Active 223-char remark
-
2018-12-03soldstatus 285-char remark
Show marketing remark (285 chars)
Wonderful location down from Miller High school right on the edge of town. This amazing lot is almost 10 acres of woods with a draw in the middle. Would be a great spot to remodel or build. Home need's some work but has potential. You can enter the property from 7th st or Hunter's st.
-
2018-06-29$54,900 285-char remark
Show marketing remark (285 chars)
Wonderful location down from Miller High school right on the edge of town. This amazing lot is almost 10 acres of woods with a draw in the middle. Would be a great spot to remodel or build. Home need's some work but has potential. You can enter the property from 7th st or Hunter's st.
ⓘ Source: listings_history table (triggers on properties + properties_extension) + one-shot
backfill from property_details.listing_events for pre-trigger history.
Climate risk First Street
- Flood 1/10 Low FEMA zone X (unshaded) · 0% chance over 30 yrs
- Wildfire 5/10 Major
- Heat 4/10 Moderate 7 d/yr ≥105°F today · 18 d/yr by 30 yrs out
- Wind 2/10 Low 2% chance of damaging wind over 30 yrs
- Air quality 2/10 Low 0 unhealthy d/yr today · 1 by 30 yrs out
Nearby sold comps map
Loading sold comps map…
Walkable amenities ~0.75 mi
Loading nearby amenities…
Taxation est. · year 1
- Rental income
- $12,082
- − Mortgage interest
- −$6,722
- − Property taxes
- −$1,800
- − Insurance
- −$600
- − Repairs & maintenance
- −$967
- − Management
- −$967
- − Depreciation
- −$3,491
- Taxable loss
- −$2,464
- Est. tax savings @ 24.0%
- +$591
- After-tax cash flow
- $185/yr
For passive investors: Depreciation is non-cash, so a rental often shows a tax loss while cash-flowing — sheltering income. Rental losses are passive: they offset passive income freely, and up to $25,000/yr can offset ordinary (W-2) income if you actively participate and your MAGI is under $100k (phasing out to $0 by $150k); unused losses carry forward. On sale, claimed depreciation is recaptured at up to 25%, and gains may owe capital-gains tax (a 1031 exchange can defer both). Figures are a year-1 estimate at your 24.0% rate — not tax advice; consult a CPA.
Condition & rehab AI · 12 photos
This property requires extensive repairs and renovations to become move-in ready. Significant structural and functional issues need addressing to improve its value.
Repairs flagged
- Major Exposed brick in kitchen — Structural damage
- Major Exposed plumbing in bathrooms — Safety hazard
- Major Damaged metal roof — Leakage risk
- Major Damaged siding — Structural integrity
- Major Exposed insulation — Energy inefficiency
- Major Missing cabinets in kitchen — Functionality
- Major Missing fixtures in bathrooms — Safety hazard
- Major Exposed ductwork — Energy inefficiency
- Major Overgrown yard — Curb appeal
Value-add opportunities
- Both New roof — Fixes leakage and enhances curb appeal
- Both New siding — Enhances curb appeal and structural integrity
- Both New HVAC system — Improves energy efficiency and comfort
- Both New cabinets and fixtures — Enhances functionality and appearance
- Both Landscaping and curb appeal — Enhances curb appeal and property value
Renovation cost estimate screening
| Repair item | Severity | Est. cost |
|---|---|---|
| Exposed brick in kitchen · Structural damage | Major | $15,000–50,000 |
| Exposed plumbing in bathrooms · Safety hazard | Major | $15,000–50,000 |
| Damaged metal roof · Leakage risk | Major | $15,000–50,000 |
| Damaged siding · Structural integrity | Major | $15,000–50,000 |
| Exposed insulation · Energy inefficiency | Major | $15,000–50,000 |
| Missing cabinets in kitchen · Functionality | Major | $15,000–50,000 |
| Missing fixtures in bathrooms · Safety hazard | Major | $15,000–50,000 |
| Exposed ductwork · Energy inefficiency | Major | $15,000–50,000 |
| Overgrown yard · Curb appeal | Major | $15,000–50,000 |
| Total estimated repair cost · 9 items | $135,000–450,000 |
Value-add ROI direction
- Both New roof — Fixes leakage and enhances curb appeal ↑
- Both New siding — Enhances curb appeal and structural integrity ↑
- Both New HVAC system — Improves energy efficiency and comfort ↑
- Both New cabinets and fixtures — Enhances functionality and appearance ↑
- Both Landscaping and curb appeal — Enhances curb appeal and property value ↑
ⓘ Cost ranges are severity-bucket heuristics (US national rule-of-thumb). Get contractor quotes + a written scope before underwriting a rehab budget.
Schools (NCES district)
- District
- Miller R-II
- NCES district ID
- 2921000
- Math proficiency
- 25% ▼ -10.00%
- Reading proficiency
- 33% ▼ -12.00%
- Median HH income
- $44,658
- Composite
- 24.83/100
- National rank
- #7592
- State rank
- #276 of 324 in MO
Livability — Miller
- Score
- 62/100
- State rank
- #405
- US rank
- #17217
Category grades
Schools grade is shown separately in the Schools card above.
Census & demographics
- Census place
- Miller, MO
- Population (ZIP)
- 2,263
Population outlook (Lawrence County) Hauer SSP2
- Today (2025)
- 37,142 people
- By 2030
- 36,212 · -2.5%
- By 2040
- 34,080 · -8.2%
- By 2050
- 31,621 · -14.9%
- By 2075
- 25,987 · -30.0%
- By 2100
- 20,151 · -45.7%
Race, ethnicity, and origin ACS 2023
- Neighborhood character
- Predominantly White (95%)
- Race & ethnicity
- White 95% Two or more races 2% Native American 2%
- Common ancestry
- Italian 3% Iranian 2% Slovak 1%
- Foreign-born
- 0% · Canada
- Languages at home
- 98% English-only · German/W. Germanic 2% French/Haitian/Cajun 1%
Political lean MEDSL · Lawrence
- 2024 margin
- Solid R (+63.8) · D 17.6% · R 81.5%
- 2008→2024 swing
- -26.8pp toward R · 2008: -37.1pp · 2024: -63.8pp
- All cycles
- 2024: R+63.8 2020: R+62.6 2016: R+61.1 2012: R+47.0 2008: R+37.1
Not yet ingested
- Civics
- —
Market trends
- HPI YoY
- ▼ -20.50%
- Current HPI
- 169.814
- Rent YoY
- —
- Metro
- —
- State GDP YoY
- ▲ 1.84%
- F500 in state
- 20
Industry mix (Fortune 500 HQ in MO)
| Industry | F500 HQs | Revenue |
|---|---|---|
| Healthcare | 1 | $163B |
|
||
| Insurance | 1 | $21B |
|
||
| Industrial Technology | 1 | $17B |
|
||
| Retail | 1 | $16B |
|
||
| Industrial Distribution | 1 | $10B |
|
||
| Utilities | 1 | $9B |
|
||
Price history
+118.6% since first listed4 events — show timeline
- 2026-05-06 Pending — SOMO
- 2026-04-21 Listed $120,000 SOMO
- 2018-12-03 Sold (MLS) — SOMO
- 2018-06-29 Listed $54,900 SOMO
Cash-flow waterfall
monthlySold comps — $/sqft
last 12 mo · ≤1 miLoading sold comps…