None · Gaylordsville, CT
Flood risk 1/10 · Minimal
- FEMA flood zone
- X
- Chance of flooding over 30 yrs
- 0.0%
- Est. flood insurance / yr
- $507 – $1,088
Fire risk 3/10 · Minor
- Est. fire insurance / yr
- $829 – $1,539
Heat risk 5/10 · Moderate
- Hot days now (above 94°F)
- 8 days/yr
- Hot days in 30 yrs
- 17 days/yr
Wind risk 4/10 · Minor
- Chance of severe wind over 30 yrs
- 15.0%
Air-quality risk 2/10 · Minimal
- Unhealthy air days now
- 2 days/yr
- Unhealthy air days in 30 yrs
- 2 days/yr
Risk factors via First Street. Map © Google.
Why this score? — see what drove the C+ grade
The composite is a weighted blend of 9 inputs, each scored 0–100. Each bar is that input's sub-score; the figure is the points it added to the 100-point composite (weight × sub-score).
- Cash flow +25.0/30.0
- DSCR +8.2/10.0
- ARV discount +7.5/15.0
- 1% rule +7.0/10.0
- Appreciation +5.2/10.0
- Schools +4.2/10.0
- Rent growth +2.5/5.0
- Livability +2.5/5.0
- Condition / age +2.5/5.0
$365,000
🖨 Deal sheet 📄 Offer letter ✓ Due diligence
Listing remarks MLS
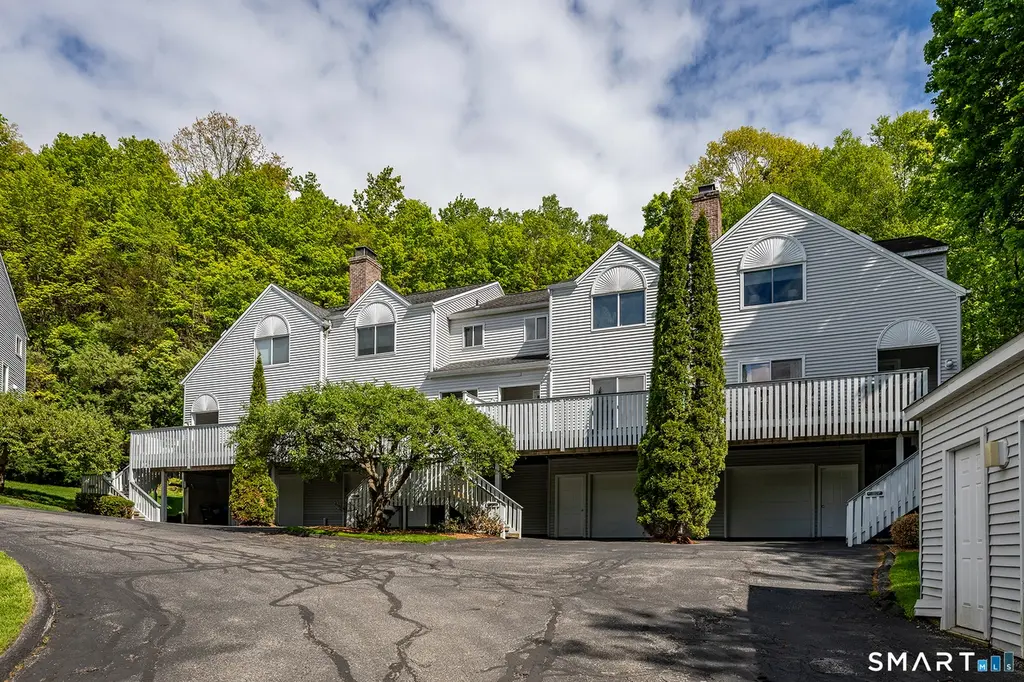
Three Bedroom Condo In Great Condition
Key facts
- Private bath
- Spacious deck
- Separate back deck
Tags
Property features AI
Finance
- Other: Part of a 4-unit complex; Nearby amenities include basketball court, lake, park, private schools, shopping/mall and tennis courts
- HOA & community: Monthly HOA fee of $350; HOA covers grounds maintenance, trash pickup, snow removal, property management and road maintenance; Homeowners association managed (unit owners association); Pets allowed with restrictions (see bylaws)
Exterior
- Parking: Under-house garage (1 garage)
- Utilities: Public water; Public sewer
- Home design: Condominium in Kent Hills Condo III; Condo/Co-op property type; White exterior
- Construction: Frame construction
- Exterior features: Clapboard and vinyl siding; City views
Interior
- Kitchen: Oven/Range; Refrigerator; Dishwasher
- Bedrooms: Two bedrooms
- Bathrooms: Two full bathrooms; One half bathroom
- Heating & cooling: Electric hot air heat; Central air conditioning; Domestic hot water
- Interior features: Five total rooms; Central air; One fireplace; Full basement with garage access and walk-out; Attic accessible via hatch
- Laundry & utility: Washer and dryer on the main level
Neighborhood map
What this means for you Summary
Snapshot
- This is a 2-bed/2.5-bath condo listed at $365k.
Deal economics
- At list price, monthly cash flow is $796 ($10k/yr) — positive.
- The deal already cash-flows at list — no discount required.
- Meets the 1% rule at list price ($4k rent vs $365k).
- Recommended offer: $360k (1.5% below list) — sets the bar for market timing.
- Cap rate 8.9% vs local median 2.8% in Gaylordsville — top-decile yield for the area; either an underpriced asset or a hidden risk that comps aren't pricing in. Stress-test before assuming the spread holds.
Location & tenants
- Location reads: area grade C — affects rentability + tenant quality, not the cash-flow math above.
- Regional School District 01 (rural): math 30% / reading 60% proficiency, ranked #147 of 192 in CT (top 77%) — families likely to look elsewhere, expect single-tenant / working-renter base with shorter leases.
- Zoned schools: Housatonic Valley Regional High School (math 22% / reading 57%, grade F, #107 of 194 statewide, top 56%, 319 students, 33% FRL) — zoned schools at 33% FRL track the district average.
- Market conditions: 26 active listings in the ZIP; 2 comparable units currently listed for rent nearby; 154 units permitted in Northwest Hills Planning Region in 2024 (6 in 5+ unit buildings).
Forward outlook
- In year one you build about $4k of equity ($3k loan paydown + $1k appreciation (0.4% local appreciation)).
- At projected returns (0.4% appreciation + 3.0% rent growth), your $102k cash investment doubles in ~7 years — after that, you're playing with house money.
- By year 8, paydown + projected appreciation supports a ~$35k cash-out refi (75% LTV) — recoverable capital for the next deal without selling this one.
Negotiation context
- It's been on market 16 days — a 2% lower offer ($360k) is reasonable based on typical stale-listing flexibility.
- 2 sale attempts since 21y ago with the ask held roughly flat each time — persistent listings suggest the price (not the market) is what's stuck; bring a comps-based counter.
Risks & watch-outs
- Climate carrying-cost: extreme-heat days projected 8→17/yr by 2055 (HVAC capex compounding) — expect insurance premiums to compound above CPI over the hold.
Questions for the listing agent
- What does the HOA fee cover, when was the last increase, and are there any pending special assessments or reserve-fund shortfalls?
- Any open or pending special assessments — roof, HVAC, plumbing, elevator, façade? What's the per-unit balance and payoff schedule, and is the seller paying it off at close or rolling it to the buyer?
- Is there a deadline driving the sale (1031 exchange, divorce, estate, relocation)? That informs how much negotiation room exists.
- What's the average days-on-market for RENTAL listings here right now (not sales)? A rising rental-DOM trend means longer vacancies and softer asking-rent achievability than the comps imply.
- What's the recent tenant-quality profile in this submarket — average credit score on applications, eviction rate, late-payment / NSF rate, and stable-employment percentage? A property-management company in the area should have these aggregated.
- How much new apartment / multifamily construction is in the pipeline within 1–3 miles? Heavy new supply (>2% of stock underway) typically softens rents 12–24 months out; light construction supports rent growth.
Investment metrics
- 1% rule
- 1.20% ✓
- Cap rate
- 8.91%
- Cash-on-cash
- 9.35%
- DSCR
- 1.42
- GRM
- 6.9
CMA / ARV
No comps found within radius.
Projected returns pro-forma
0.39% appreciation · 3.0% rent growth · sell at horizon
- IRR
- 9.4%
- Equity multiple
- 1.46×
- Total profit
- $46,930
- Equity at exit
- $113,145
- IRR
- 13.9%
- Equity multiple
- 2.59×
- Total profit
- $162,428
- Equity at exit
- $141,860
Cash invested: $102,200 (down + closing). Projections, not guarantees.
Landlord ↔ Tenant lean methodology
- Overall (STATE)
- 27 Tenant-Leaning
- State Connecticut
- 27 Tenant-Leaning · D+7
- County
- — inherits STATE
- City
- — inherits STATE
ZIP-level market 06757
- Home prices YoY
- 0.1%
- Active inventory
- 26
- Price-to-rent
- 6.9×
Monthly cashflow live
- Estimated rent
- $4,386 medium interval (Pro) →
- Mortgage (P&I)
- −$1,914
- Tax from tax record
- −$253 /mo · $3,032/yr
- Insurance
- −$152
- HOA
- −$350
- Vacancy / Maint / Mgmt
- −$921
- Net cashflow
- $796
Break-even live
UW: 25.0% down · 7.5% · 30yr · 1.5% tax · 5.0% vac · 8.0% maint · 8.0% mgmt
Financing live
Cash to close
- Down payment
- $91,250
- Closing costs
- $10,950
- Reserves months
- —
- Total cash needed
- —
Loan-product check · same deal, 3 products live
Conventional
25% down · 7.5% · 30yr
- Down + closing
- —
- Monthly P&I
- —
- Monthly cashflow
- —
- DSCR
- —
- Eligible?
- —
Personal DTI + credit; lowest rate.
DSCR
20% down · 8.5% · 30yr
- Down + closing
- —
- Monthly P&I
- —
- Monthly cashflow
- —
- DSCR
- —
- Eligible?
- —
No personal income docs; deal must DSCR.
Hard money
10% down · 12.0% · 12mo
- Down + closing
- —
- Monthly P&I
- —
- Monthly cashflow
- —
- DSCR
- —
- Eligible?
- —
Short-term bridge; refi at stabilization.
Rent comps 2 comps
| Address | Beds | Baths | Sqft | Rent | $/sqft | DOM | Units | Dist |
|---|---|---|---|---|---|---|---|---|
| 47 Johnson Rd Kent, CT | 2.0 | 1.5 | 1296 | $6,000 | $4.63 | 44d | 1 | 0.31mi |
| 44 Elizabeth St Unit D Kent, CT | 2.0 | 1.0 | 1500 | $2,300 | $1.53 | 44d | 1 | 0.46mi |
HOA detail condo
- Monthly dues
- $350 · $4,200/yr
- Assessments
- None detected in remarks — confirm with the listing agent.
Listing history 13 events
-
2026-06-19days on market $365,000 Active 16 DOM
-
2026-06-18days on market $365,000 Active 15 DOM
-
2026-06-17days on market $365,000 Active 14 DOM
-
2026-06-16days on market $365,000 Active 13 DOM
-
2026-06-15days on market $365,000 Active 12 DOM
-
2026-06-14days on market $365,000 Active 10 DOM
-
2026-06-13days on market $365,000 Active 9 DOM
-
2026-06-10days on market $365,000 Active 7 DOM
-
2026-06-09days on market $365,000 Active 6 DOM
-
2026-06-08days on market $365,000 Active 5 DOM
-
2026-06-07days on market $365,000 Active 4 DOM
-
2026-06-05remarks 682-char remark
-
2026-06-05$365,000 Active 1 DOM
ⓘ Source: listings_history table (triggers on properties + properties_extension) + one-shot
backfill from property_details.listing_events for pre-trigger history.
Tax reassessment forecast CT · Partial reset (capped growth)
- Current annual tax
- $3,032 · $253/mo
- Projected year-2 tax
- $5,422 · $452/mo
- Expected delta
- +$2,390/yr (+$199/mo · 78.8%)
ⓘ Screening estimate from a state-policy table — verify with the county assessor before closing.
Climate risk First Street
- Flood 1/10 Low FEMA zone X · 0% chance over 30 yrs
- Wildfire 3/10 Moderate
- Heat 5/10 Major 8 d/yr ≥94°F today · 17 d/yr by 30 yrs out
- Wind 4/10 Moderate 15% chance of damaging wind over 30 yrs
- Air quality 2/10 Low 2 unhealthy d/yr today · 2 by 30 yrs out
Nearby sold comps map
Loading sold comps map…
Walkable amenities ~0.75 mi
Loading nearby amenities…
Taxation est. · year 1
- Rental income
- $52,636
- − Mortgage interest
- −$20,446
- − Property taxes
- −$3,032
- − Insurance
- −$1,825
- − Repairs & maintenance
- −$4,211
- − Management
- −$4,211
- − HOA
- −$4,200
- − Depreciation
- −$10,618
- Taxable income
- $4,093
- Est. tax owed @ 24.0%
- −$982
- After-tax cash flow
- $8,574/yr
For passive investors: Depreciation is non-cash, so a rental often shows a tax loss while cash-flowing — sheltering income. Rental losses are passive: they offset passive income freely, and up to $25,000/yr can offset ordinary (W-2) income if you actively participate and your MAGI is under $100k (phasing out to $0 by $150k); unused losses carry forward. On sale, claimed depreciation is recaptured at up to 25%, and gains may owe capital-gains tax (a 1031 exchange can defer both). Figures are a year-1 estimate at your 24.0% rate — not tax advice; consult a CPA.
Schools (NCES district)
- District
- Regional School District 01
- NCES district ID
- 0903600
- Math proficiency
- 30% ▬ 0.00%
- Reading proficiency
- 60% ▬ 0.00%
- Median HH income
- $66,599
- Composite
- 42.38/100
- National rank
- #6926
- State rank
- #147 of 192 in CT
Livability — Gaylordsville
No livability data for this city. (Only ~50 U.S. cities are tracked.)
Census & demographics
- City population
- 975
- Population (ZIP)
- 1,987
Population outlook (Northwest Hills County) Hauer SSP2
- By 2040
- 118,998
Race, ethnicity, and origin ACS 2023
- Neighborhood character
- Predominantly White (86%)
- Race & ethnicity
- White 86% Two or more races 8% Hispanic / Latino 4% Asian 3%
- Common ancestry
- Romanian 5% Lithuanian 4% Iranian 4%
- Foreign-born
- 11% · Canada, Jamaica, South Korea
- Languages at home
- 91% English-only · Other Indo-European 4% Spanish 2% Russian/Polish/Slavic 1%
Political lean MEDSL · Northwest Hills
- 2024 margin
- Toss-up / Even · D 48.6% · R 49.9% · Other 1.6%
- All cycles
- 2024: R+1.3
Not yet ingested
- Civics
- —
Market trends
- HPI YoY
- ▲ 0.39%
- Current HPI
- 299.2094
- Rent YoY
- —
- Metro
- —
- State GDP YoY
- ▲ 1.06%
- F500 in state
- 38
Industry mix (Fortune 500 HQ in CT)
| Industry | F500 HQs | Revenue |
|---|---|---|
| Industrial Machinery | 4 | $38B |
|
||
| Insurance | 3 | $71B |
|
||
| Financial Services | 2 | $25B |
|
||
| Transportation / Logistics | 2 | $18B |
|
||
| Healthcare | 1 | $247B |
|
||
| Telecommunications | 1 | $55B |
|
||
Price history
+97.3% since first listed4 events — show timeline
- 2026-06-03 Listed $365,000 Smart MLS
- 2005-09-20 Sold (MLS) $350,000 Smart MLS
- 2005-06-13 Listed $350,000 Smart MLS
- 1987-12-15 Sold (Public Records) $185,000 Public Records
Property tax history
-0.4%/yrLatest (2023): $3,032 · +1.0% YoY. Source: county tax records.
Cash-flow waterfall
monthlySold comps — $/sqft
last 12 mo · ≤1 miLoading sold comps…