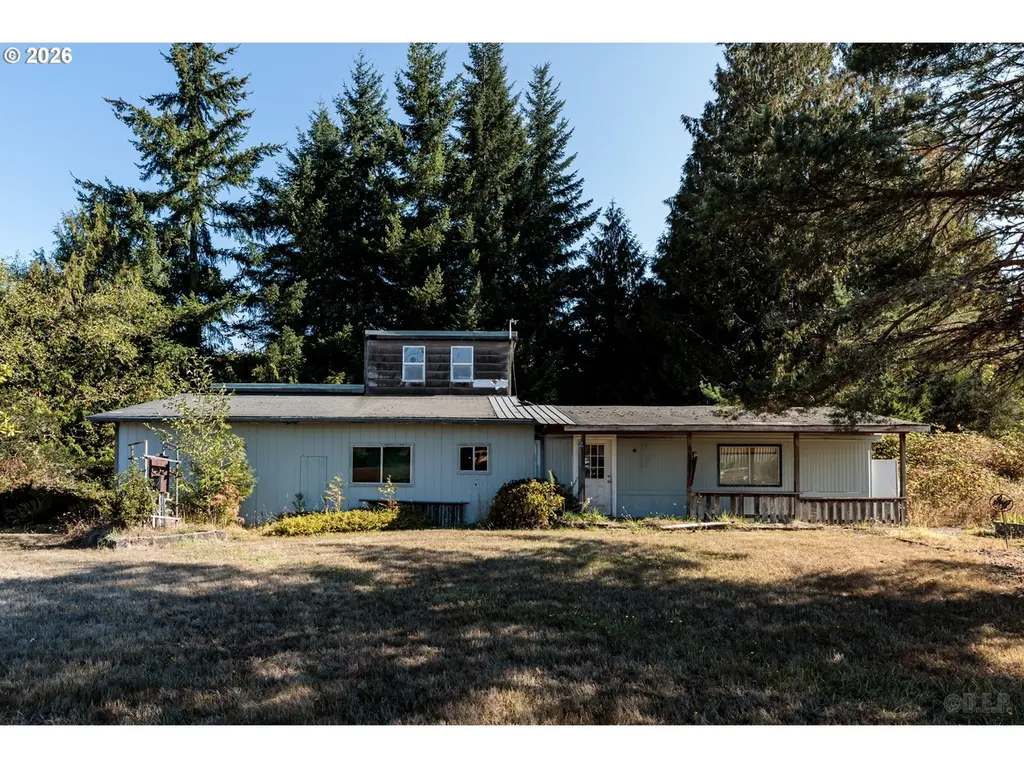
76658 Heath Rd · Longview, WA
Flood risk 1/10 · Minimal
- FEMA flood zone
- X (unshaded)
- Chance of flooding over 30 yrs
- 0.0%
- Est. flood insurance / yr
- $473 – $860
Fire risk 3/10 · Minor
- Est. fire insurance / yr
- $498 – $926
Heat risk 1/10 · Minimal
- Hot days now (above 89°F)
- 6 days/yr
- Hot days in 30 yrs
- 12 days/yr
Wind risk 1/10 · Minimal
- Chance of severe wind over 30 yrs
- —
Air-quality risk 7/10 · Major
- Unhealthy air days now
- 8 days/yr
- Unhealthy air days in 30 yrs
- 9 days/yr
Risk factors via First Street. Map © Google.
Why this score? — see what drove the D+ grade
The composite is a weighted blend of 9 inputs, each scored 0–100. Each bar is that input's sub-score; the figure is the points it added to the 100-point composite (weight × sub-score).
- ARV discount +15.0/15.0
- Cash flow +14.9/30.0
- DSCR +4.6/10.0
- Livability +3.6/5.0
- Schools +3.5/10.0
- 1% rule +3.3/10.0
- Rent growth +2.5/5.0
- Condition / age +2.5/5.0
- Appreciation +0.0/10.0
$230,000
🖨 Deal sheet 📄 Offer letter ✓ Due diligence
Listing remarks MLS
Bring your imagination and see what you can do with this 2 acre parcel. Potentially live in the original manufactured home while building your dream home. Foundation in place plus pole building offer additional features to explore your options. Please no drive bys or unaccompanied showings.
Key facts
- Foundation in place
- Pole building
- 2 acre parcel
Tags
Neighborhood map
What this means for you Summary
Snapshot
- This is a 2-bed/1.0-bath manufactured listed at $230k.
Deal economics
- At list price, monthly cash flow is $68 ($812/yr) — positive.
- The deal already cash-flows at list — no discount required.
- To meet the 1% rule (rent ≥ 1% of price), the offer needs to be $192k (16.7% below list).
- Recommended offer: $192k (16.7% below list) — sets the bar for 1% rule.
- Cap rate 6.6% vs local median 3.0% in Longview — top-decile yield for the area; either an underpriced asset or a hidden risk that comps aren't pricing in. Stress-test before assuming the spread holds.
Location & tenants
- Location reads 71/100 on livability (#228 in WA) — a middle-class / working-renter tenant base. Strengths: housing A+, health & safety A+, cost of living A-; Watch: crime C-, employment D+, commute F.
- Rainier SD 13 (rural): math 26% / reading 48% proficiency, ranked #124 of 183 in OR (top 68%) — families likely to look elsewhere, expect single-tenant / working-renter base with shorter leases.
- Market conditions: 55 units permitted in Columbia County in 2024 (0 in 5+ unit buildings).
Forward outlook
- Local home prices are declining (-3.0%/yr); year-one equity from $2k of loan paydown is wiped out by about $7k of value loss. Plan a longer hold.
- Columbia County population projected at -11% by 2050 — secular population decline; favor cash flow + early exit over multi-decade hold.
Negotiation context
- It's been on market 115 days — a 9% lower offer ($209k) is reasonable based on typical stale-listing flexibility.
Questions for the listing agent
- It's been on market 115 days. Have you received any prior offers? Is the seller open to a 17% concession, seller financing, or rate buy-down credit?
- Built in 1974 — when were the roof, HVAC, electrical panel, plumbing, and water heater last replaced?
- Why hasn't it sold? Are there any deal-killer items the seller is aware of (foundation, flood, title, zoning, code violations)?
- Is there a deadline driving the sale (1031 exchange, divorce, estate, relocation)? That informs how much negotiation room exists.
- The area grade is low — what's the realistic commute time and amenity access for the typical tenant pool here? Any planned neighborhood developments (good or bad) we should know about?
- What's the average days-on-market for RENTAL listings here right now (not sales)? A rising rental-DOM trend means longer vacancies and softer asking-rent achievability than the comps imply.
- What's the recent tenant-quality profile in this submarket — average credit score on applications, eviction rate, late-payment / NSF rate, and stable-employment percentage? A property-management company in the area should have these aggregated.
- How much new for-sale + rental construction is in the pipeline within 1–3 miles? Heavy new supply typically softens prices + rents 12–24 months out; constrained supply supports both.
Investment metrics
- 1% rule
- 0.83% ✗
- Cap rate
- 6.65%
- Cash-on-cash
- 1.26%
- DSCR
- 1.06
- GRM
- 10.0
CMA / ARV
- ARV (median comp)
- $400,208
- List price
- $230,000
- Delta
- -42.53%
- Verdict
- UNDERPRICED
- Comps
- 5 within 2.0 mi
Projected returns pro-forma
-3.0% appreciation · 3.0% rent growth · sell at horizon
- IRR
- -14.3%
- Equity multiple
- 0.49×
- Total profit
- $-33,018
- Equity at exit
- $34,294
- IRR
- -5.6%
- Equity multiple
- 0.64×
- Total profit
- $-23,440
- Equity at exit
- $19,886
Cash invested: $64,400 (down + closing). Projections, not guarantees.
Landlord ↔ Tenant lean methodology
- Overall (STATE)
- 28 Tenant-Leaning
- State Washington
- 28 Tenant-Leaning · D+8
- County
- — inherits STATE
- City
- — inherits STATE
ZIP-level market 97048
- Home prices YoY
- -23.8%
- Price-to-rent
- 10.0×
Monthly cashflow live
- Estimated rent
- $1,917 medium interval (Pro) →
- Mortgage (P&I)
- −$1,206
- Tax from tax record
- −$145 /mo · $1,736/yr
- Insurance
- −$96
- HOA
- −$0
- Vacancy / Maint / Mgmt
- −$403
- Net cashflow
- $68
Break-even live
UW: 25.0% down · 7.5% · 30yr · 1.5% tax · 5.0% vac · 8.0% maint · 8.0% mgmt
Financing live
Cash to close
- Down payment
- $57,500
- Closing costs
- $6,900
- Reserves months
- —
- Total cash needed
- —
Loan-product check · same deal, 3 products live
Conventional
25% down · 7.5% · 30yr
- Down + closing
- —
- Monthly P&I
- —
- Monthly cashflow
- —
- DSCR
- —
- Eligible?
- —
Personal DTI + credit; lowest rate.
DSCR
20% down · 8.5% · 30yr
- Down + closing
- —
- Monthly P&I
- —
- Monthly cashflow
- —
- DSCR
- —
- Eligible?
- —
No personal income docs; deal must DSCR.
Hard money
10% down · 12.0% · 12mo
- Down + closing
- —
- Monthly P&I
- —
- Monthly cashflow
- —
- DSCR
- —
- Eligible?
- —
Short-term bridge; refi at stabilization.
Listing history 14 events
-
2026-06-18days on market $230,000 Active 115 DOM
-
2026-06-17days on market $230,000 Active 114 DOM
-
2026-06-16days on market $230,000 Active 113 DOM
-
2026-06-15days on market $230,000 Active 112 DOM
-
2026-06-13days on market $230,000 Active 110 DOM
-
2026-06-09days on market $230,000 Active 106 DOM
-
2026-06-08days on market $230,000 Active 105 DOM
-
2026-06-07days on market $230,000 Active 104 DOM
-
2026-06-05days on market $230,000 Active 101 DOM
-
2026-06-03days on market $230,000 Active 100 DOM
-
2026-06-02days on market $230,000 Active 99 DOM
-
2026-06-01days on market $230,000 Active 98 DOM
-
2026-05-31days on market $230,000 Active 97 DOM
-
2026-02-23$230,000 Active 294-char remark
Show marketing remark (294 chars)
Bring your imagination and see what you can do with this 2 acre parcel. Potentially live in the original manufactured home while building your dream home. Foundation in place plus pole building offer additional features to explore your options. Please no drive bys or unaccompanied showings.
ⓘ Source: listings_history table (triggers on properties + properties_extension) + one-shot
backfill from property_details.listing_events for pre-trigger history.
Tax reassessment forecast WA · Resets to sale price
- Current annual tax
- $1,736 · $145/mo
- Projected year-2 tax
- $2,254 · $188/mo
- Expected delta
- +$518/yr (+$43/mo · 29.8%)
ⓘ Screening estimate from a state-policy table — verify with the county assessor before closing.
Climate risk First Street
- Flood 1/10 Low FEMA zone X (unshaded) · 0% chance over 30 yrs
- Wildfire 3/10 Moderate
- Heat 1/10 Low 6 d/yr ≥89°F today · 12 d/yr by 30 yrs out
- Wind 1/10 Low
- Air quality 7/10 Severe 8 unhealthy d/yr today · 9 by 30 yrs out
Nearby sold comps map
Loading sold comps map…
Walkable amenities ~0.75 mi
Loading nearby amenities…
Taxation est. · year 1
- Rental income
- $23,002
- − Mortgage interest
- −$12,884
- − Property taxes
- −$1,736
- − Insurance
- −$1,150
- − Repairs & maintenance
- −$1,840
- − Management
- −$1,840
- − Depreciation
- −$6,691
- Taxable loss
- −$3,138
- Est. tax savings @ 24.0%
- +$753
- After-tax cash flow
- $1,565/yr
For passive investors: Depreciation is non-cash, so a rental often shows a tax loss while cash-flowing — sheltering income. Rental losses are passive: they offset passive income freely, and up to $25,000/yr can offset ordinary (W-2) income if you actively participate and your MAGI is under $100k (phasing out to $0 by $150k); unused losses carry forward. On sale, claimed depreciation is recaptured at up to 25%, and gains may owe capital-gains tax (a 1031 exchange can defer both). Figures are a year-1 estimate at your 24.0% rate — not tax advice; consult a CPA.
Schools (NCES district)
- District
- Rainier SD 13
- NCES district ID
- 4103265
- Math proficiency
- 26% ▼ -1.00%
- Reading proficiency
- 48% ▼ -2.00%
- Median HH income
- $50,657
- Composite
- 34.58/100
- National rank
- #10103
- State rank
- #124 of 183 in OR
Livability — Longview
- Score
- 71/100
- State rank
- #228
- US rank
- #6972
Category grades
Schools grade is shown separately in the Schools card above.
Census & demographics
- City population
- 50,635
- Population (ZIP)
- 7,096
Population outlook (Columbia County) Hauer SSP2
- Today (2025)
- 49,620 people
- By 2030
- 48,957 · -1.3%
- By 2040
- 46,860 · -5.6%
- By 2050
- 44,383 · -10.6%
- By 2075
- 39,333 · -20.7%
- By 2100
- 34,038 · -31.4%
Race, ethnicity, and origin ACS 2023
- Neighborhood character
- Predominantly White (84%)
- Race & ethnicity
- White 84% Two or more races 10% Hispanic / Latino 5% Native American 3%
- Hispanic origin (detail)
- Mexican 4%
- Common ancestry
- Portuguese 6% Italian 4% Romanian 2%
- Foreign-born
- 2% · Canada
- Languages at home
- 97% English-only · German/W. Germanic 1% Spanish 1%
Political lean MEDSL · Columbia
- 2024 margin
- R (+13.9) · D 41.4% · R 55.3% · Other 3.4%
- 2008→2024 swing
- -25.9pp toward R · 2008: 12.0pp · 2024: -13.9pp
- All cycles
- 2024: R+13.9 2020: R+10.3 2016: R+12.0 2012: D+5.1 2008: D+12.0
Not yet ingested
- Civics
- —
Market trends
- HPI YoY
- ▼ -99.37%
- Current HPI
- 318.1179
- Rent YoY
- —
- Metro
- —
- State GDP YoY
- ▲ 4.65%
- F500 in state
- 22
Industry mix (Fortune 500 HQ in WA)
| Industry | F500 HQs | Revenue |
|---|---|---|
| Retail | 2 | $269B |
|
||
| Technology / Retail | 1 | $638B |
|
||
| Technology | 1 | $245B |
|
||
| Telecommunications | 1 | $38B |
|
||
| Food / Beverage | 1 | $36B |
|
||
| Automotive / Trucks | 1 | $34B |
|
||
Price history
1 event — show timeline
- 2026-02-23 Listed $230,000 RMLS
Property tax history
+2.5%/yrLatest (2025): $1,736 · +4.3% YoY. Source: county tax records.
Cash-flow waterfall
monthlySold comps — $/sqft
last 12 mo · ≤1 miLoading sold comps…