15621 Beach · Westminster, CA
Flood risk 1/10 · Minimal
- FEMA flood zone
- X
- Chance of flooding over 30 yrs
- 0.0%
- Est. flood insurance / yr
- $507 – $1,088
Fire risk 1/10 · Minimal
- Est. fire insurance / yr
- $659 – $1,223
Heat risk 5/10 · Moderate
- Hot days now (above 87°F)
- 7 days/yr
- Hot days in 30 yrs
- 23 days/yr
Wind risk 1/10 · Minimal
- Chance of severe wind over 30 yrs
- —
Air-quality risk 4/10 · Minor
- Unhealthy air days now
- 5 days/yr
- Unhealthy air days in 30 yrs
- 7 days/yr
Risk factors via First Street. Map © Google.
Why this score? — see what drove the C+ grade
The composite is a weighted blend of 9 inputs, each scored 0–100. Each bar is that input's sub-score; the figure is the points it added to the 100-point composite (weight × sub-score).
- Cash flow +30.0/30.0
- 1% rule +10.0/10.0
- DSCR +10.0/10.0
- Schools +5.5/10.0
- Livability +3.1/5.0
- Rent growth +3.0/5.0
- Condition / age +2.2/5.0
- ARV discount +0.0/15.0
- Appreciation +0.0/10.0
$115,000
🖨 Deal sheet 📄 Offer letter ✓ Due diligence
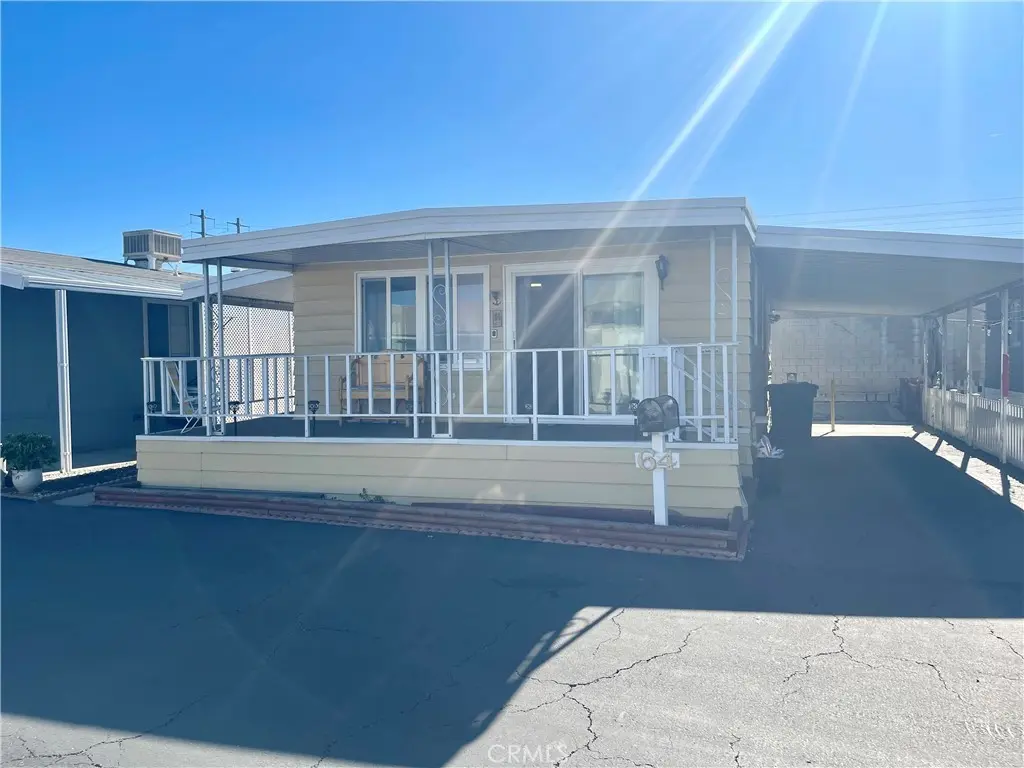
Listing remarks
2 Bedroom 2 Bath * * * inviting front porch * * * large rear and private yard area across from clubhouse
Key facts
- 16.17 acre lot
- Community pool
- Built 1964
Property features AI
Finance
- Financial info: Land lease: $1,950
- HOA & community: Senior community; Suburban community
Exterior
- Parking: Located in the Driftwood park
- Utilities: Public sewer; District/public water
- Home design: Single-story home; Mobile home remains on site; Estimated year built
- Construction: Mobile home approximately 20 ft by 37 ft; Estimated living area
- Exterior features: Community pool; Lot is level with the street
Interior
- Bathrooms: 2 full bathrooms
- Interior features: Entry is on the main level
- Laundry & utility: Laundry inside the home
Neighborhood map
What this means for you Summary
Snapshot
- This is a 2-bed/2.0-bath manufactured listed at $115k. Condition is rated fair.
Deal economics
- At list price, monthly cash flow is $1k ($16k/yr) — positive.
- The deal already cash-flows at list — no discount required.
- Meets the 1% rule at list price ($3k rent vs $115k).
- Recommended offer: $112k (3.0% below list) — sets the bar for market timing.
- Cap rate 20.1% vs local median 2.0% in Westminster — top-decile yield for the area; either an underpriced asset or a hidden risk that comps aren't pricing in. Stress-test before assuming the spread holds.
Location & tenants
- Location reads 62/100 on livability (#509 in CA) — a middle-class / working-renter tenant base. Strengths: commute A+; Watch: crime D-, amenities F, cost of living F.
- Ocean View (suburban): math 57% / reading 63% proficiency, ranked #207 of 1,400 in CA (top 15%) — acceptable for families but not a draw, mixed tenant base, ~2y average lease.
- Market conditions: Rents rising (+2.0%/yr); 87 active listings in the ZIP; 21 comparable units currently listed for rent nearby; rentals leasing fast (median 1d on market — plan ~1-2 weeks tenant-placement turnaround); solid renter incomes; 6,974 units permitted in Orange County in 2024 (3,839 in 5+ unit buildings).
- This rent runs 38% of the median local income ($86k/yr) — at the standard rent-burdened threshold; future hikes will face affordability resistance.
Forward outlook
- Local home prices are declining (-3.0%/yr); year-one equity from $795 of loan paydown is wiped out by about $3k of value loss. Plan a longer hold.
- Orange County population projected at +14% by 2050 — modest demand growth; plan on rents tracking national, not racing it.
- At projected returns (-3.0% appreciation + 2.0% rent growth), your $32k cash investment doubles in ~3 years — after that, you're playing with house money.
Negotiation context
- It's been on market 44 days — a 3% lower offer ($112k) is reasonable based on typical stale-listing flexibility.
Risks & watch-outs
- Climate carrying-cost: extreme-heat days projected 7→23/yr by 2055 (HVAC capex compounding) — expect insurance premiums to compound above CPI over the hold.
Questions for the listing agent
- It's been on market 44 days. Have you received any prior offers? Is the seller open to a 3% concession, seller financing, or rate buy-down credit?
- Have any recent inspections been done? Can we get a copy of the seller's disclosures and any deferred-maintenance estimates?
- Built in 1964 — when were the roof, HVAC, electrical panel, plumbing, and water heater last replaced?
- Is there a deadline driving the sale (1031 exchange, divorce, estate, relocation)? That informs how much negotiation room exists.
- Crime grade is D in this area — have there been break-ins, vandalism, or insurance claims at this property in the last 3 years? What carrier currently insures it and at what premium?
- What's the average days-on-market for RENTAL listings here right now (not sales)? A rising rental-DOM trend means longer vacancies and softer asking-rent achievability than the comps imply.
- What's the recent tenant-quality profile in this submarket — average credit score on applications, eviction rate, late-payment / NSF rate, and stable-employment percentage? A property-management company in the area should have these aggregated.
- How much new for-sale + rental construction is in the pipeline within 1–3 miles? Heavy new supply typically softens prices + rents 12–24 months out; constrained supply supports both.
Investment metrics
- 1% rule
- 2.33% ✓
- Cap rate
- 20.06%
- Cash-on-cash
- 49.18%
- DSCR
- 3.19
- GRM
- 3.6
CMA / ARV
- ARV (on-the-fly)
- $83,620
- Comps found
- 4
Show comp detail 4 sales within ~0.75 mi
| Address | Dist | Beds/Ba | Sqft | Sold | Price | $/sf | Match |
|---|---|---|---|---|---|---|---|
| 15621 beach Blvd #80 | 0.12mi | 2/2.0 | 800 (+8%) | 0mo | $68,000 | $85 | 80 |
| 15141 Beach Blvd #39 | 0.43mi | 2/1.0 | 780 (+5%) | 6mo | $62,000 | $79 | 62 |
| 15141 Beach Blvd Spc 28 | 0.43mi | 2/1.0 | 640 (-14%) | 13mo | $90,000 | $141 | 43 |
| 15141 Beach Blvd, Space 40 | 0.43mi | 2/1.0 | 640 (-14%) | 16mo | $72,000 | $113 | 40 |
Match score weights: distance 35% · size 25% · config 20% · recency 20%. Top-matched comps best support the ARV.
Projected returns pro-forma
-3.0% appreciation · 2.01% rent growth · sell at horizon
- IRR
- 45.7%
- Equity multiple
- 2.95×
- Total profit
- $62,809
- Equity at exit
- $17,147
- IRR
- 51.1%
- Equity multiple
- 5.73×
- Total profit
- $152,457
- Equity at exit
- $9,943
Cash invested: $32,200 (down + closing). Projections, not guarantees.
Landlord ↔ Tenant lean methodology
- Overall (STATE)
- 18 Strongly Tenant-Friendly
- State California
- 18 Strongly Tenant-Friendly · D+13
- County
- — inherits STATE
- City
- — inherits STATE
ZIP-level market 92683
- Rents YoY
- 2.0%
- Active inventory
- 87
- Price-to-rent
- 3.6×
Monthly cashflow live
- Estimated rent
- $2,676 high interval (Pro) →
- Mortgage (P&I)
- −$603
- Tax est. 1.5%
- −$144 /mo · $1,725/yr
- Insurance
- −$48
- HOA
- −$0
- Vacancy / Maint / Mgmt
- −$562
- Net cashflow
- $1,320
Break-even live
UW: 25.0% down · 7.5% · 30yr · 1.5% tax · 5.0% vac · 8.0% maint · 8.0% mgmt
Financing live
Cash to close
- Down payment
- $28,750
- Closing costs
- $3,450
- Reserves months
- —
- Total cash needed
- —
Loan-product check · same deal, 3 products live
Conventional
25% down · 7.5% · 30yr
- Down + closing
- —
- Monthly P&I
- —
- Monthly cashflow
- —
- DSCR
- —
- Eligible?
- —
Personal DTI + credit; lowest rate.
DSCR
20% down · 8.5% · 30yr
- Down + closing
- —
- Monthly P&I
- —
- Monthly cashflow
- —
- DSCR
- —
- Eligible?
- —
No personal income docs; deal must DSCR.
Hard money
10% down · 12.0% · 12mo
- Down + closing
- —
- Monthly P&I
- —
- Monthly cashflow
- —
- DSCR
- —
- Eligible?
- —
Short-term bridge; refi at stabilization.
Rent comps 21 comps
| Address | Beds | Baths | Sqft | Rent | $/sqft | DOM | Units | Dist |
|---|---|---|---|---|---|---|---|---|
| 15421 Van Buren St Midway City, CA | 1.0 | 1.0 | 600 | $2,300 | $3.83 | 1d | 3 | 0.34mi |
| 15421 Van Buren St Midway City, CA | 1.0 | 1.0 | 600 | $2,300 | $3.83 | 16d | 1 | 0.34mi |
| 7521 Edinger Ave Huntington Beach, CA | 3.0 | 1.0–2.0 | 1035 | $3,703 | $3.58 | 1d | 23 | 0.46mi |
| 7400 Center Ave Huntington Beach, CA | 2.0 | 1.0–2.0 | 990 | $4,119 | $4.16 | 1d | 1 | 0.47mi |
| 7461 Edinger Ave Huntington Beach, CA | 2.0 | 1.0–2.0 | 1031 | $4,325 | $4.19 | 1d | 26 | 0.53mi |
| 8131 San Angelo Dr Huntington Beach, CA | 1.0 | 1.0 | 725 | $2,150 | $2.97 | 1d | 1 | 0.54mi |
| 16162 Sher Ln Huntington Beach, CA | 1.0–3.0 | 1.0–1.5 | 1090 | $2,522 | $2.31 | 1d | 9 | 0.57mi |
| 7780 Bolsa Ave Midway City, CA | 1.0 | 1.0 | 576 | $2,450 | $4.25 | 1d | 1 | 0.58mi |
| 8142 La Paz Dr Unit 8 Huntington Beach, CA | 1.0 | 1.0 | 725 | $1,950 | $2.69 | 18d | 1 | 0.68mi |
| 8142 La Paz Dr Unit 7 Huntington Beach, CA | 1.0 | 1.0 | 725 | $1,950 | $2.69 | 10d | 1 | 0.68mi |
| 7290 Edinger Ave Huntington Beach, CA | 1.0–2.0 | 1.0–2.0 | 941 | $3,824 | $4.06 | 1d | 19 | 0.73mi |
| 8211 San Angelo Dr Huntington Beach, CA | 1.0 | 1.0 | 612 | $2,455 | $4.01 | 1d | 5 | 0.73mi |
| 8400 Edinger Ave Huntington Beach, CA | 2.0 | 1.0–2.0 | 778 | $3,007 | $3.87 | 1d | 13 | 0.76mi |
| 15611 Highcliff St Westminster, CA | 1.0 | 1.0 | 550 | $1,995 | $3.63 | 43d | 1 | 1.16mi |
| 15200 Magnolia St Westminster, CA | 1.0–2.0 | 1.0 | 762 | $2,675 | $3.51 | 1d | 2 | 1.27mi |
| 7701 Warner Ave Apt G115 Huntington Beach, CA | 1.0 | 1.0 | 750 | $2,535 | $3.38 | 1d | 1 | 1.33mi |
| 7701 Warner Ave Apt A11 Huntington Beach, CA | 1.0 | 1.0 | 750 | $2,445 | $3.26 | 10d | 1 | 1.33mi |
| 7701 Warner Ave Unit E081 Huntington Beach, CA | 1.0 | 1.0 | 750 | $2,445 | $3.26 | 1d | 1 | 1.33mi |
| 7701 Warner Ave Unit A004 Huntington Beach, CA | 1.0 | 1.0 | 750 | $2,585 | $3.45 | 1d | 1 | 1.33mi |
| 7701 Warner Ave Unit B024 Huntington Beach, CA | 1.0 | 1.0 | 750 | $2,505 | $3.34 | 18d | 1 | 1.33mi |
| 7701 Warner Ave Unit A010 Huntington Beach, CA | 1.0 | 1.0 | 750 | $2,445 | $3.26 | 15d | 1 | 1.33mi |
Listing history 16 events
-
2026-06-18days on market $115,000 Active 44 DOM
-
2026-06-17days on market $115,000 Active 43 DOM
-
2026-06-16days on market $115,000 Active 42 DOM
-
2026-06-15days on market $115,000 Active 41 DOM
-
2026-06-13days on market $115,000 Active 39 DOM
-
2026-06-13days on market $115,000 Active 38 DOM
-
2026-06-10days on market $115,000 Active 36 DOM
-
2026-06-09days on market $115,000 Active 35 DOM
-
2026-06-08days on market $115,000 Active 34 DOM
-
2026-06-07days on market $115,000 Active 33 DOM
-
2026-06-04days on market $115,000 Active 30 DOM
-
2026-06-03days on market $115,000 Active 29 DOM
-
2026-06-02days on market $115,000 Active 28 DOM
-
2026-06-01days on market $115,000 Active 27 DOM
-
2026-05-31days on market $115,000 Active 26 DOM
-
2026-05-05$115,000 Active
ⓘ Source: listings_history table (triggers on properties + properties_extension) + one-shot
backfill from property_details.listing_events for pre-trigger history.
Climate risk First Street
- Flood 1/10 Low FEMA zone X · 0% chance over 30 yrs
- Wildfire 1/10 Low
- Heat 5/10 Major 7 d/yr ≥87°F today · 23 d/yr by 30 yrs out
- Wind 1/10 Low
- Air quality 4/10 Moderate 5 unhealthy d/yr today · 7 by 30 yrs out
Nearby sold comps map
Loading sold comps map…
Walkable amenities ~0.75 mi
Loading nearby amenities…
Taxation est. · year 1
- Rental income
- $32,116
- − Mortgage interest
- −$6,442
- − Property taxes
- −$1,725
- − Insurance
- −$575
- − Repairs & maintenance
- −$2,569
- − Management
- −$2,569
- − Depreciation
- −$3,345
- Taxable income
- $14,890
- Est. tax owed @ 24.0%
- −$3,574
- After-tax cash flow
- $12,261/yr
For passive investors: Depreciation is non-cash, so a rental often shows a tax loss while cash-flowing — sheltering income. Rental losses are passive: they offset passive income freely, and up to $25,000/yr can offset ordinary (W-2) income if you actively participate and your MAGI is under $100k (phasing out to $0 by $150k); unused losses carry forward. On sale, claimed depreciation is recaptured at up to 25%, and gains may owe capital-gains tax (a 1031 exchange can defer both). Figures are a year-1 estimate at your 24.0% rate — not tax advice; consult a CPA.
Condition & rehab AI · 5 photos
This manufactured home requires moderate repairs and maintenance to improve its condition and value. Key areas for improvement include the kitchen, bathrooms, and flooring. Painting and cleaning will significantly enhance its curb appeal and interior aesthetics.
Repairs flagged
- Moderate Kitchen cabinets — Worn appearance
- Minor Bathroom fixtures — Dated appearance
- Moderate Hardwood flooring — Worn appearance
- Minor Paint — Faded appearance
Value-add opportunities
- Both Paint interior walls — Fresh paint enhances curb appeal and interior aesthetics
- Both Refinish hardwood flooring — Refinished floors improve appearance and value
- Both Clean windows — Clean windows improve natural light and curb appeal
Renovation cost estimate screening
| Repair item | Severity | Est. cost |
|---|---|---|
| Kitchen cabinets · Worn appearance | Moderate | $3,000–15,000 |
| Bathroom fixtures · Dated appearance | Minor | $500–3,000 |
| Hardwood flooring · Worn appearance | Moderate | $3,000–15,000 |
| Paint · Faded appearance | Minor | $500–3,000 |
| Total estimated repair cost · 4 items | $7,000–36,000 |
Value-add ROI direction
- Both Paint interior walls — Fresh paint enhances curb appeal and interior aesthetics ↑
- Both Refinish hardwood flooring — Refinished floors improve appearance and value ↑
- Both Clean windows — Clean windows improve natural light and curb appeal ↑
ⓘ Cost ranges are severity-bucket heuristics (US national rule-of-thumb). Get contractor quotes + a written scope before underwriting a rehab budget.
Schools (NCES district)
- District
- Ocean View
- NCES district ID
- 0628140
- Math proficiency
- 57% ▬ 0.00%
- Reading proficiency
- 63% ▼ -1.00%
- Median HH income
- $77,469
- Composite
- 55.3/100
- National rank
- #2725
- State rank
- #207 of 1400 in CA
Livability — Westminster
- Score
- 62/100
- State rank
- #509
- US rank
- #17242
Category grades
Schools grade is shown separately in the Schools card above.
Census & demographics
- Census place
- Westminster, CA
- County
- Orange County · 3,096,323 people
- City population
- 89,833
- Metro
- Los Angeles-Long Beach-Anaheim, CA
- Population (ZIP)
- 89,833
- Household income
- $85,585
- Rent vs Own
- Severe rent burden
- 4639.0
Population outlook (Orange County) Hauer SSP2
- Today (2025)
- 3,477,456 people
- By 2030
- 3,613,117 · +3.9%
- By 2040
- 3,835,945 · +10.3%
- By 2050
- 3,968,736 · +14.1%
- By 2075
- 4,097,053 · +17.8%
- By 2100
- 3,903,633 · +12.3%
Race, ethnicity, and origin ACS 2023
- Neighborhood character
- Diverse neighborhood (Simpson 0.64)
- Race & ethnicity
- Asian 51% Hispanic / Latino 24% White 20% Two or more races 9%
- Hispanic origin (detail)
- Mexican 20%
- Common ancestry
- Slovak 1% Portuguese 1% Lithuanian 1%
- Foreign-born
- 46% · Vietnam, Canada, China
- Languages at home
- 35% English-only · Vietnamese 40% Spanish 18% Chinese 2%
Political lean MEDSL · Orange
- 2024 margin
- Toss-up / Even · D 49.7% · R 47.1% · Other 3.2%
- 2008→2024 swing
- +5.2pp toward D · 2008: -2.6pp · 2024: 2.6pp
- All cycles
- 2024: D+2.6 2020: D+9.0 2016: D+7.7 2012: R+8.3 2008: R+2.6
Not yet ingested
- Civics
- —
Market trends
- HPI YoY
- ▼ -917.95%
- Current HPI
- 410.3463
- Rent YoY
- ▲ 2.01%
- Metro
- Los Angeles-Long Beach-Anaheim, CA
- State GDP YoY
- ▲ 3.21%
- F500 in state
- 116
Industry mix (Fortune 500 HQ in CA)
| Industry | F500 HQs | Revenue |
|---|---|---|
| Technology | 27 | $1,492B |
|
||
| Financial Services | 3 | $174B |
|
||
| Retail | 3 | $44B |
|
||
| Insurance | 3 | $26B |
|
||
| Media / Entertainment | 2 | $115B |
|
||
| Pharmaceuticals / Biotech | 2 | $62B |
|
||
Price history
1 event — show timeline
- 2026-05-05 Listed $115,000 CRMLS
Cash-flow waterfall
monthlySold comps — $/sqft
last 12 mo · ≤1 miLoading sold comps…