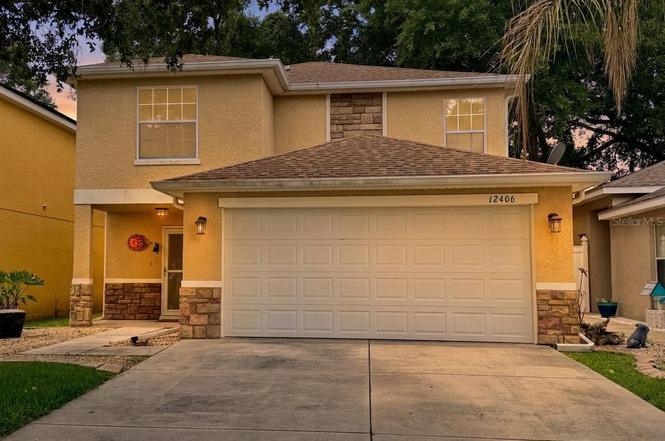
12406 NE 50th Vw · Wildwood, FL
Flood risk 1/10 · Minimal
- FEMA flood zone
- X (unshaded)
- Chance of flooding over 30 yrs
- 0.0%
- Est. flood insurance / yr
- $507 – $1,088
Fire risk 4/10 · Minor
- Est. fire insurance / yr
- $947 – $1,759
Heat risk 9/10 · Severe
- Hot days now (above 108°F)
- 7 days/yr
- Hot days in 30 yrs
- 22 days/yr
Wind risk 9/10 · Severe
- Chance of severe wind over 30 yrs
- 99.0%
Air-quality risk 3/10 · Minor
- Unhealthy air days now
- 2 days/yr
- Unhealthy air days in 30 yrs
- 3 days/yr
Risk factors via First Street. Map © Google.
Why this score? — see what drove the D+ grade
The composite is a weighted blend of 9 inputs, each scored 0–100. Each bar is that input's sub-score; the figure is the points it added to the 100-point composite (weight × sub-score).
- ARV discount +15.0/15.0
- Cash flow +11.6/30.0
- Schools +5.2/10.0
- 1% rule +3.5/10.0
- Livability +3.5/5.0
- DSCR +3.4/10.0
- Rent growth +2.5/5.0
- Condition / age +2.5/5.0
- Appreciation +0.0/10.0
$269,000
🖨 Deal sheet 📄 Offer letter ✓ Due diligence
Listing remarks
Welcome to the desirable Villages of Parkwood, a gated community offering resort-style amenities including a clubhouse, fitness room, and outdoor pool. This spacious 4-bedroom, 3.5-bath home blends comfort, convenience, and lifestyle. Just minutes from Hwy 301 and CR 466, you’ll enjoy quick access to shopping, dining, medical facilities, and The Villages Charter Schools. Built with durable concrete block and stucco construction, this home offers lasting value and peace of mind. Inside, a thoughtful floor plan is enhanced by tranquil greenspace views behind the property, providing a serene backdrop while still being part of a vibrant neighborhood. The first floor features easy-to-maint
Key facts
- Gated community
- Outdoor pool
- Clubhouse
Tags
Property features AI
Finance
- Other: No lease restrictions indicated; Homestead exemption present
- Financial info: Total monthly fees $80; total annual fees $960
- HOA & community: HOA: Couture Properties LLC (monthly fee $80); Association fee covers pool and structure maintenance; Community clubhouse, fitness center, playground and pool; Golf carts allowed; Deed-restricted community; Pets allowed (cats and dogs)
Exterior
- Parking: Attached 2-car garage
- Utilities: Public water; Public sewer; Electricity available; Cable available
- Home design: Single family residence; Two stories; North-facing
- Construction: Block, concrete and stucco construction; Shingle roof; Slab foundation; Built with public records living area of 2,096 sq ft (building area 2,229 sq ft)
- Exterior features: Sliding doors; Irrigation equipment
Interior
- Kitchen: Convection oven; Range; Microwave; Dishwasher; Refrigerator
- Bedrooms: 4 bedrooms
- Flooring: Carpet; Laminate
- Bathrooms: 3 full baths; 1 half bath
- Heating & cooling: Central heating; Central air
- Interior features: Ceiling fans; Open floorplan; Living room/dining room combo; Walk-in closets
- Laundry & utility: Washer; Dryer; Laundry closet
Neighborhood map
What this means for you Summary
Snapshot
- This is a 4-bed/3.5-bath single-family listed at $269k.
Deal economics
- At list price, monthly cash flow is $-86 ($-1k/yr) — negative.
- To cash-flow at today's rent, offer at most $254k (5.6% below list).
- To meet the 1% rule (rent ≥ 1% of price), the offer needs to be $229k (14.9% below list).
- Recommended offer: $229k (14.9% below list) — sets the bar for 1% rule.
- Cap rate 5.9% vs local median 3.9% in Wildwood — top-decile yield for the area; either an underpriced asset or a hidden risk that comps aren't pricing in. Stress-test before assuming the spread holds.
Location & tenants
- Location reads 69/100 on livability (#471 in FL) — a middle-class / working-renter tenant base. Strengths: health & safety A+, cost of living A, crime A-; Watch: schools C-, amenities F, commute F.
- Sumter (rural): math 61% / reading 61% proficiency, ranked #11 of 73 in FL (top 15%) — acceptable for families but not a draw, mixed tenant base, ~2y average lease.
- Market conditions: 160 active listings in the ZIP; 5 comparable units currently listed for rent nearby; rentals at typical pace (median 21d on market — plan ~3-4 weeks tenant-placement turnaround); solid renter incomes; 3,961 units permitted in Sumter County in 2024 (248 in 5+ unit buildings).
Forward outlook
- Local home prices are declining (-3.0%/yr); year-one equity from $2k of loan paydown is wiped out by about $8k of value loss. Plan a longer hold.
- Sumter County population projected at +45% by 2050 — long-run rental-demand tailwind backs the buy-and-hold thesis.
Negotiation context
- It's been on market 269 days — a 12% lower offer ($237k) is reasonable based on typical stale-listing flexibility.
- 10 sale attempts since 11y ago; this cycle's ask has dropped $46k (15%) from the opening price — seller is motivated, your offer sets the floor, not the list.
- Current owner paid $224k; 20% above their basis — modest negotiation headroom, anchor on the comps not their cost.
Risks & watch-outs
- Climate carrying-cost: severe wind risk, 99% chance of damaging wind over 30y; extreme-heat days projected 7→22/yr by 2055 (HVAC capex compounding) — expect insurance premiums to compound above CPI over the hold.
Questions for the listing agent
- What do current leases actually rent for vs. the listed asking? Can we see a recent rent roll and the last 12 months of T-12 income?
- It's been on market 269 days. Have you received any prior offers? Is the seller open to a 15% concession, seller financing, or rate buy-down credit?
- What does the HOA fee cover, when was the last increase, and are there any pending special assessments or reserve-fund shortfalls?
- Why hasn't it sold? Are there any deal-killer items the seller is aware of (foundation, flood, title, zoning, code violations)?
- Is there a deadline driving the sale (1031 exchange, divorce, estate, relocation)? That informs how much negotiation room exists.
- The area grade is low — what's the realistic commute time and amenity access for the typical tenant pool here? Any planned neighborhood developments (good or bad) we should know about?
- What's the average days-on-market for RENTAL listings here right now (not sales)? A rising rental-DOM trend means longer vacancies and softer asking-rent achievability than the comps imply.
- What's the recent tenant-quality profile in this submarket — average credit score on applications, eviction rate, late-payment / NSF rate, and stable-employment percentage? A property-management company in the area should have these aggregated.
- How much new for-sale + rental construction is in the pipeline within 1–3 miles? Heavy new supply typically softens prices + rents 12–24 months out; constrained supply supports both.
Investment metrics
- 1% rule
- 0.85% ✗
- Cap rate
- 5.91%
- Cash-on-cash
- -1.37%
- DSCR
- 0.94
- GRM
- 9.8
CMA / ARV
- ARV (on-the-fly)
- $419,200
- Comps found
- 12
Show comp detail 12 sales within ~0.75 mi
| Address | Dist | Beds/Ba | Sqft | Sold | Price | $/sf | Match |
|---|---|---|---|---|---|---|---|
| 12160 NE 51st Cir | 0.22mi | 4/2.0 | 2,101 (+0%) | 2mo | $460,000 | $219 | 82 |
| 12313 NE 48th Loop | 0.17mi | 4/3.5 | 1,984 (-5%) | 11mo | $300,000 | $151 | 74 |
| 12312 NE 48th Loop | 0.19mi | 4/3.5 | 1,912 (-9%) | 3mo | $289,900 | $152 | 74 |
| 12624 NE 49th Dr | 0.33mi | 4/3.0 | 2,191 (+4%) | 3mo | $415,000 | $189 | 73 |
| 4790 NE 125th Loop | 0.36mi | 4/3.0 | 2,191 (+4%) | 3mo | $449,900 | $205 | 71 |
| 12584 NE 49th Dr | 0.23mi | 3/2.0 (-1) | 2,061 (-2%) | 9mo | $515,000 | $250 | 68 |
| 4951 NE 125th Loop | 0.16mi | 3/2.0 (-1) | 1,900 (-9%) | 6mo | $468,500 | $247 | 61 |
| 5008 NE 125th Loop | 0.19mi | 4/2.0 | 1,796 (-14%) | 2mo | $335,000 | $187 | 59 |
| 12185 NE 51st Cir | 0.31mi | 3/2.0 (-1) | 1,889 (-10%) | 5mo | $310,000 | $164 | 54 |
| 4727 NE 125th Loop | 0.39mi | 3/6.5 (-1) | 2,064 (-2%) | 11mo | $630,000 | $305 | 53 |
| 4791 NE 125th Loop | 0.38mi | 4/2.0 | 1,796 (-14%) | 1mo | $360,000 | $200 | 51 |
| 3550 Auburndale Ave | 0.51mi | 3/2.0 (-1) | 2,022 (-4%) | 10mo | $330,000 | $163 | 51 |
Match score weights: distance 35% · size 25% · config 20% · recency 20%. Top-matched comps best support the ARV.
Projected returns pro-forma
-3.0% appreciation · 3.0% rent growth · sell at horizon
- IRR
- -18.5%
- Equity multiple
- 0.35×
- Total profit
- $-49,011
- Equity at exit
- $40,109
- IRR
- -10.9%
- Equity multiple
- 0.34×
- Total profit
- $-49,504
- Equity at exit
- $23,258
Cash invested: $75,320 (down + closing). Projections, not guarantees.
Landlord ↔ Tenant lean methodology
- Overall (STATE)
- 87 Strongly Landlord-Friendly
- State Florida
- 87 Strongly Landlord-Friendly · R+3
- County
- — inherits STATE
- City
- — inherits STATE
ZIP-level market 34484
- Home prices YoY
- -31.3%
- Active inventory
- 160
- Price-to-rent
- 9.8×
Monthly cashflow live
- Estimated rent
- $2,288 medium interval (Pro) →
- Mortgage (P&I)
- −$1,411
- Tax from tax record
- −$291 /mo · $3,489/yr
- Insurance
- −$112
- HOA
- −$80
- Vacancy / Maint / Mgmt
- −$480
- Net cashflow
- $-86
Break-even live
UW: 25.0% down · 7.5% · 30yr · 1.5% tax · 5.0% vac · 8.0% maint · 8.0% mgmt
Financing live
Cash to close
- Down payment
- $67,250
- Closing costs
- $8,070
- Reserves months
- —
- Total cash needed
- —
Loan-product check · same deal, 3 products live
Conventional
25% down · 7.5% · 30yr
- Down + closing
- —
- Monthly P&I
- —
- Monthly cashflow
- —
- DSCR
- —
- Eligible?
- —
Personal DTI + credit; lowest rate.
DSCR
20% down · 8.5% · 30yr
- Down + closing
- —
- Monthly P&I
- —
- Monthly cashflow
- —
- DSCR
- —
- Eligible?
- —
No personal income docs; deal must DSCR.
Hard money
10% down · 12.0% · 12mo
- Down + closing
- —
- Monthly P&I
- —
- Monthly cashflow
- —
- DSCR
- —
- Eligible?
- —
Short-term bridge; refi at stabilization.
Rent comps 5 comps
| Address | Beds | Baths | Sqft | Rent | $/sqft | DOM | Units | Dist |
|---|---|---|---|---|---|---|---|---|
| 12362 NE 50th Vw Oxford, FL | 4.0 | 4.0 | 1929 | $2,300 | $1.19 | 20d | 1 | 0.12mi |
| 12580 NE 49th Dr Oxford, FL | 3.0 | 2.0 | 1940 | $2,400 | $1.24 | 20d | 1 | 0.19mi |
| 12388 NE 48th Loop Oxford, FL | 3.0 | 2.0 | 1426 | $1,700 | $1.19 | 20d | 1 | 0.23mi |
| 3057 Saint Thomas Ln The Villages, FL | 3.0 | 2.0 | 2044 | $2,850 | $1.39 | 20d | 1 | 1.12mi |
| 424 Bowman Ter The Villages, FL | 3.0 | 2.0 | 2000 | $5,400 | $2.70 | 20d | 1 | 1.24mi |
HOA detail
- Monthly dues
- $80 · $960/yr
- Likely covers
- poolsecurity
Listing history 47 events
-
2026-06-19days on market $269,000 Active 269 DOM
-
2026-06-18days on market $269,000 Active 268 DOM
-
2026-06-17days on market $269,000 Active 267 DOM
-
2026-06-16days on market $269,000 Active 266 DOM
-
2026-06-15days on market $269,000 Active 265 DOM
-
2026-06-14days on market $269,000 Active 263 DOM
-
2026-06-13days on market $269,000 Active 262 DOM
-
2026-06-10days on market $269,000 Active 260 DOM
-
2026-06-09days on market $269,000 Active 259 DOM
-
2026-06-08days on market $269,000 Active 258 DOM
-
2026-06-07pricedays on market $269,000 Active 257 DOM
-
2026-05-31days on market $277,500 Active 256 DOM
-
2026-05-30days on market $277,500 Active 255 DOM
-
2026-05-01status Active
-
2026-05-01price $277,500
-
2026-04-30historical
-
2026-04-02price $280,000
-
2026-03-13status Active
-
2026-02-28historical
-
2025-11-25price $285,000
-
2025-10-09price $300,000
-
2025-09-03$315,000 Active
-
2025-05-14price $299,000
-
2025-05-14historical
-
2025-05-08price $298,800
-
2025-04-13price $298,900
-
2025-03-19price $299,000
-
2025-02-15price $318,900
-
2024-12-18price $319,000
-
2024-09-21$325,000 Active
-
2023-10-06historical
-
2023-04-06$395,000 Active
-
2020-09-18soldstatus $223,500 Sold
-
2020-08-16status Pending
-
2020-07-23$229,000 Active
-
2019-06-20status Pending
-
2019-06-20historical
-
2019-06-11status Active
-
2019-06-06status Pending
-
2019-05-08$224,900 Active
-
2015-07-17historical
-
2015-06-23status Active
-
2015-06-20historical
-
2015-05-17price $245,000
-
2015-05-12price $254,900
-
2015-05-12price $250,000
-
2015-04-03$259,900 Active
ⓘ Source: listings_history table (triggers on properties + properties_extension) + one-shot
backfill from property_details.listing_events for pre-trigger history.
Tax reassessment forecast FL · Resets to sale price
- Current annual tax
- $3,489 · $291/mo
- Projected year-2 tax
- $3,489 · $291/mo
- Expected delta
- $0/yr ($0/mo · 0.0%)
ⓘ Screening estimate from a state-policy table — verify with the county assessor before closing.
Climate risk First Street
- Flood 1/10 Low FEMA zone X (unshaded) · 0% chance over 30 yrs
- Wildfire 4/10 Moderate
- Heat 9/10 Extreme 7 d/yr ≥108°F today · 22 d/yr by 30 yrs out
- Wind 9/10 Extreme 99% chance of damaging wind over 30 yrs
- Air quality 3/10 Moderate 2 unhealthy d/yr today · 3 by 30 yrs out
Nearby sold comps map
Loading sold comps map…
Walkable amenities ~0.75 mi
Loading nearby amenities…
Taxation est. · year 1
- Rental income
- $27,456
- − Mortgage interest
- −$15,068
- − Property taxes
- −$3,489
- − Insurance
- −$1,345
- − Repairs & maintenance
- −$2,197
- − Management
- −$2,197
- − HOA
- −$960
- − Depreciation
- −$7,825
- Taxable loss
- −$5,625
- Est. tax savings @ 24.0%
- +$1,350
- After-tax cash flow
- $318/yr
For passive investors: Depreciation is non-cash, so a rental often shows a tax loss while cash-flowing — sheltering income. Rental losses are passive: they offset passive income freely, and up to $25,000/yr can offset ordinary (W-2) income if you actively participate and your MAGI is under $100k (phasing out to $0 by $150k); unused losses carry forward. On sale, claimed depreciation is recaptured at up to 25%, and gains may owe capital-gains tax (a 1031 exchange can defer both). Figures are a year-1 estimate at your 24.0% rate — not tax advice; consult a CPA.
Schools (NCES district)
- District
- Sumter
- NCES district ID
- 1201800
- Math proficiency
- 61% ▼ -4.00%
- Reading proficiency
- 61% ▼ -2.00%
- Median HH income
- $48,240
- Composite
- 51.74/100
- National rank
- #1682
- State rank
- #11 of 73 in FL
Livability — Wildwood
- Score
- 69/100
- State rank
- #471
- US rank
- #8500
Category grades
Schools grade is shown separately in the Schools card above.
Census & demographics
- Census place
- Wildwood, FL
- County
- Sumter County · 110,591 people
- City population
- 21,568
- Metro
- The Villages, FL
- Population (ZIP)
- 5,050
- Household income
- $92,582
- Rent vs Own
- Severe rent burden
- 149.0
Population outlook (Sumter County) Hauer SSP2
- Today (2025)
- 161,172 people
- By 2030
- 180,083 · +11.7%
- By 2040
- 209,892 · +30.2%
- By 2050
- 234,186 · +45.3%
- By 2075
- 284,602 · +76.6%
- By 2100
- 317,039 · +96.7%
Race, ethnicity, and origin ACS 2023
- Neighborhood character
- Predominantly White (82%)
- Race & ethnicity
- White 82% Black 7% Two or more races 6% Hispanic / Latino 5% Asian 2%
- Common ancestry
- Lithuanian 5% Romanian 3% Italian 2%
- Foreign-born
- 4% · Canada, Philippines, Jamaica
- Languages at home
- 95% English-only · Spanish 4% Other Asian/Pacific 1%
Political lean MEDSL · Sumter
- 2024 margin
- Solid R (+37.6) · D 30.9% · R 68.6%
- 2008→2024 swing
- -10.6pp toward R · 2008: -27.0pp · 2024: -37.6pp
- All cycles
- 2024: R+37.6 2020: R+36.1 2016: R+39.2 2012: R+34.9 2008: R+27.0
Not yet ingested
- Civics
- —
Market trends
- HPI YoY
- ▼ -86.11%
- Current HPI
- 189.0678
- Rent YoY
- —
- Metro
- The Villages, FL
- State GDP YoY
- ▲ 3.28%
- F500 in state
- 36
Industry mix (Fortune 500 HQ in FL)
| Industry | F500 HQs | Revenue |
|---|---|---|
| Industrial Technology | 2 | $29B |
|
||
| Insurance | 2 | $17B |
|
||
| Retail | 1 | $60B |
|
||
| Technology Distribution | 1 | $58B |
|
||
| Homebuilding | 1 | $35B |
|
||
| Technology Manufacturing | 1 | $35B |
|
||
Price history
+6.8% since first listed34 events — show timeline
- 2026-05-01 Relisted — Stellar MLS as Distributed by MLS Grid
- 2026-05-01 Price Changed $277,500 Stellar MLS as Distributed by MLS Grid
- 2026-04-30 Listing Removed — Stellar MLS as Distributed by MLS Grid
- 2026-04-02 Price Changed $280,000 Stellar MLS as Distributed by MLS Grid
- 2026-03-13 Relisted — Stellar MLS as Distributed by MLS Grid
- 2026-02-28 Listing Removed — Stellar MLS as Distributed by MLS Grid
- 2025-11-25 Price Changed $285,000 Stellar MLS as Distributed by MLS Grid
- 2025-10-09 Price Changed $300,000 Stellar MLS as Distributed by MLS Grid
- 2025-09-03 Listed $315,000 Stellar MLS as Distributed by MLS Grid
- 2025-05-14 Price Changed $299,000 Stellar MLS as Distributed by MLS Grid
- 2025-05-14 Listing Removed — Stellar MLS as Distributed by MLS Grid
- 2025-05-08 Price Changed $298,800 Stellar MLS as Distributed by MLS Grid
- 2025-04-13 Price Changed $298,900 Stellar MLS as Distributed by MLS Grid
- 2025-03-19 Price Changed $299,000 Stellar MLS as Distributed by MLS Grid
- 2025-02-15 Price Changed $318,900 Stellar MLS as Distributed by MLS Grid
- 2024-12-18 Price Changed $319,000 Stellar MLS as Distributed by MLS Grid
- 2024-09-21 Listed $325,000 Stellar MLS as Distributed by MLS Grid
- 2023-10-06 Listing Removed — Stellar MLS as Distributed by MLS Grid
- 2023-04-06 Listed $395,000 Stellar MLS as Distributed by MLS Grid
- 2020-09-18 Sold (MLS) $223,500 Stellar MLS as Distributed by MLS Grid
- 2020-08-16 Pending — Stellar MLS as Distributed by MLS Grid
- 2020-07-23 Listed $229,000 Stellar MLS as Distributed by MLS Grid
- 2019-06-20 Pending — Stellar MLS as Distributed by MLS Grid
- 2019-06-20 Listing Removed — Stellar MLS as Distributed by MLS Grid
- 2019-06-11 Relisted — Stellar MLS as Distributed by MLS Grid
- 2019-06-06 Pending — Stellar MLS as Distributed by MLS Grid
- 2019-05-08 Listed $224,900 Stellar MLS as Distributed by MLS Grid
- 2015-07-17 Listing Removed — Stellar MLS as Distributed by MLS Grid
- 2015-06-23 Relisted — Stellar MLS as Distributed by MLS Grid
- 2015-06-20 Listing Removed — Stellar MLS as Distributed by MLS Grid
- 2015-05-17 Price Changed $245,000 Stellar MLS as Distributed by MLS Grid
- 2015-05-12 Price Changed $250,000 Stellar MLS as Distributed by MLS Grid
- 2015-05-12 Price Changed $254,900 Stellar MLS as Distributed by MLS Grid
- 2015-04-03 Listed $259,900 Stellar MLS as Distributed by MLS Grid
Property tax history
+2.9%/yrLatest (2025): $3,489 · +5.7% YoY. Source: county tax records.
Cash-flow waterfall
monthlySold comps — $/sqft
last 12 mo · ≤1 miLoading sold comps…