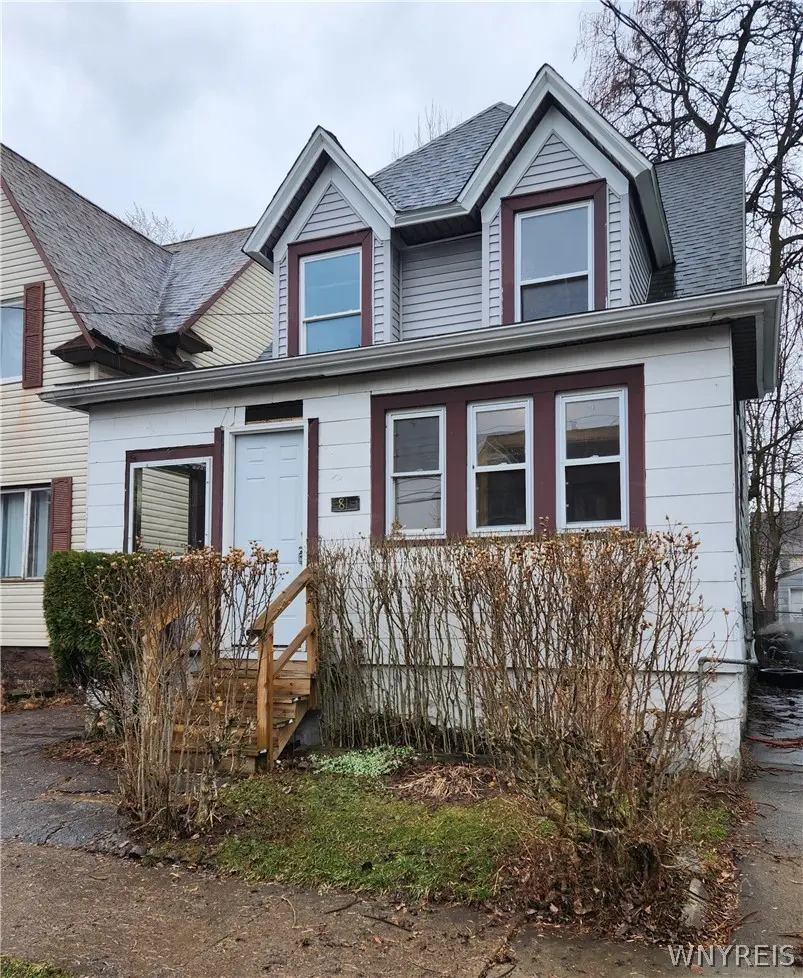
81 Mayer Ave · Buffalo, NY
Flood risk 1/10 · Minimal
- FEMA flood zone
- X (unshaded)
- Chance of flooding over 30 yrs
- 0.0%
- Est. flood insurance / yr
- $473 – $860
Fire risk 1/10 · Minimal
- Est. fire insurance / yr
- $691 – $1,283
Heat risk 3/10 · Minor
- Hot days now (above 93°F)
- 7 days/yr
- Hot days in 30 yrs
- 15 days/yr
Wind risk 1/10 · Minimal
- Chance of severe wind over 30 yrs
- —
Air-quality risk 3/10 · Minor
- Unhealthy air days now
- 3 days/yr
- Unhealthy air days in 30 yrs
- 4 days/yr
Risk factors via First Street. Map © Google.
Why this score? — see what drove the B- grade
The composite is a weighted blend of 9 inputs, each scored 0–100. Each bar is that input's sub-score; the figure is the points it added to the 100-point composite (weight × sub-score).
- Cash flow +26.1/30.0
- ARV discount +15.0/15.0
- DSCR +8.8/10.0
- 1% rule +5.7/10.0
- Rent growth +4.5/5.0
- Livability +3.9/5.0
- Schools +3.3/10.0
- Condition / age +2.5/5.0
- Appreciation +0.0/10.0
$119,900
🖨 Deal sheet 📄 Offer letter ✓ Due diligence
Listing remarks MLS
This house could be a great opportunity for an investor to buy a house with a long term tenant in place. This could also be a great house for an owner occupant. Please use Showing Time to schedule an appointment. Available windows of time will be Wednesday 6-8pm and Sunday 12-3pm. House is currently rented for $675/month on a Month-to-Month lease. Tenant pays gas and electric. Please email offers to Earl@IrishJonesRealty.
Key facts
- Hot water tank
- Roof
- 100 amp electrical
Tags
Neighborhood map
What this means for you Summary
Snapshot
- This is a 3-bed/1.0-bath single-family listed at $120k.
Deal economics
- At list price, monthly cash flow is $302 ($4k/yr) — positive.
- The deal already cash-flows at list — no discount required.
- Meets the 1% rule at list price ($1k rent vs $120k).
Location & tenants
- Location reads 77/100 on livability (#195 in NY, #3,011 nationally) — a middle-class / working-renter tenant base. Strengths: commute A+, housing A+, health & safety A+; Watch: crime F, employment D-.
- Buffalo City School District (urban): math 41% / reading 40% proficiency, ranked #535 of 590 in NY (top 91%) — families likely to look elsewhere, expect single-tenant / working-renter base with shorter leases; 75% free/reduced lunch — lower-income household profile, screen leases tightly.
- Market conditions: Rents rising fast (+8.2%/yr); 197 active listings in the ZIP; 17 comparable units currently listed for rent nearby; rentals at typical pace (median 15d on market — plan ~3-4 weeks tenant-placement turnaround); lower-income renter base — watch delinquency; 1,244 units permitted in Erie County in 2024 (563 in 5+ unit buildings).
- This rent runs 39% of the median local income ($40k/yr) — at the standard rent-burdened threshold; future hikes will face affordability resistance.
Forward outlook
- Local home prices are declining (-3.0%/yr); year-one equity from $829 of loan paydown is wiped out by about $4k of value loss. Plan a longer hold.
- At projected returns (-3.0% appreciation + 8.0% rent growth), your $34k cash investment doubles in ~8 years — after that, you're playing with house money.
Negotiation context
- Only 13 days on market — expect competitive offers; lowballing is unlikely to land.
- 2 sale attempts since 5y ago with the ask held roughly flat each time — persistent listings suggest the price (not the market) is what's stuck; bring a comps-based counter.
- Current owner paid $70k; list at $120k implies a 71% gain — meaningful room to come down on a strong offer.
Risks & watch-outs
- Watch-outs: built in 1900 — expect roof / HVAC / electrical / plumbing capex.
Questions for the listing agent
- Built in 1900 — when were the roof, HVAC, electrical panel, plumbing, and water heater last replaced?
- Is there a deadline driving the sale (1031 exchange, divorce, estate, relocation)? That informs how much negotiation room exists.
- Crime grade is F in this area — have there been break-ins, vandalism, or insurance claims at this property in the last 3 years? What carrier currently insures it and at what premium?
- What's the average days-on-market for RENTAL listings here right now (not sales)? A rising rental-DOM trend means longer vacancies and softer asking-rent achievability than the comps imply.
- What's the recent tenant-quality profile in this submarket — average credit score on applications, eviction rate, late-payment / NSF rate, and stable-employment percentage? A property-management company in the area should have these aggregated.
- How much new for-sale + rental construction is in the pipeline within 1–3 miles? Heavy new supply typically softens prices + rents 12–24 months out; constrained supply supports both.
Investment metrics
- 1% rule
- 1.07% ✓
- Cap rate
- 9.32%
- Cash-on-cash
- 10.81%
- DSCR
- 1.48
- GRM
- 7.8
CMA / ARV
- ARV (on-the-fly)
- $144,342
- Comps found
- 12
Show comp detail 12 sales within ~0.75 mi
| Address | Dist | Beds/Ba | Sqft | Sold | Price | $/sf | Match |
|---|---|---|---|---|---|---|---|
| 75 Mayer Ave | 0.01mi | 3/1.0 | 810 (-9%) | 3mo | $129,000 | $159 | 82 |
| 268 Riverside Ave | 0.16mi | 3/1.0 | 936 (+5%) | 5mo | $150,000 | $160 | 80 |
| 84 Gallatin Ave | 0.03mi | 3/1.0 | 936 (+5%) | 15mo | $55,000 | $59 | 78 |
| 98 Gallatin Ave | 0.04mi | 3/1.0 | 928 (+4%) | 19mo | $150,000 | $162 | 75 |
| 63 Briggs Ave | 0.34mi | 3/1.0 | 974 (+9%) | 0mo | $180,000 | $185 | 68 |
| 42 Progressive Ave | 0.14mi | 3/1.0 | 1,019 (+14%) | 6mo | $68,000 | $67 | 64 |
| 78 Gallatin Ave | 0.03mi | 3/1.5 | 990 (+11%) | 22mo | $59,000 | $60 | 60 |
| 5 Ruhl Ave | 0.64mi | 3/1.0 | 964 (+8%) | 0mo | $234,100 | $243 | 56 |
| 34 Race St | 0.55mi | 2/1.0 (-1) | 960 (+8%) | 4mo | $158,500 | $165 | 53 |
| 19 Royal Ave | 0.42mi | 4/1.0 (+1) | 1,021 (+15%) | 2mo | $159,547 | $156 | 49 |
| 112 Condon Ave | 0.57mi | 3/2.0 | 936 (+5%) | 15mo | $175,000 | $187 | 49 |
| 40 Kofler Ave | 0.68mi | 3/1.0 | 964 (+8%) | 18mo | $215,000 | $223 | 40 |
Match score weights: distance 35% · size 25% · config 20% · recency 20%. Top-matched comps best support the ARV.
Projected returns pro-forma
-3.0% appreciation · 8.0% rent growth · sell at horizon
- IRR
- 4.8%
- Equity multiple
- 1.19×
- Total profit
- $6,530
- Equity at exit
- $17,877
- IRR
- 18.0%
- Equity multiple
- 2.82×
- Total profit
- $60,992
- Equity at exit
- $10,367
Cash invested: $33,572 (down + closing). Projections, not guarantees.
Landlord ↔ Tenant lean methodology
- Overall (STATE)
- 15 Strongly Tenant-Friendly
- State New York
- 15 Strongly Tenant-Friendly · D+10
- County
- — inherits STATE
- City
- — inherits STATE
ZIP-level market 14207
- Home prices YoY
- -18.9%
- Rents YoY
- 8.2%
- Active inventory
- 197
- Price-to-rent
- 7.8×
Monthly cashflow live
- Estimated rent
- $1,277 high interval (Pro) →
- Mortgage (P&I)
- −$629
- Tax from tax record
- −$28 /mo · $336/yr
- Insurance
- −$50
- HOA
- −$0
- Vacancy / Maint / Mgmt
- −$268
- Net cashflow
- $302
Break-even live
UW: 25.0% down · 7.5% · 30yr · 1.5% tax · 5.0% vac · 8.0% maint · 8.0% mgmt
Financing live
Cash to close
- Down payment
- $29,975
- Closing costs
- $3,597
- Reserves months
- —
- Total cash needed
- —
Loan-product check · same deal, 3 products live
Conventional
25% down · 7.5% · 30yr
- Down + closing
- —
- Monthly P&I
- —
- Monthly cashflow
- —
- DSCR
- —
- Eligible?
- —
Personal DTI + credit; lowest rate.
DSCR
20% down · 8.5% · 30yr
- Down + closing
- —
- Monthly P&I
- —
- Monthly cashflow
- —
- DSCR
- —
- Eligible?
- —
No personal income docs; deal must DSCR.
Hard money
10% down · 12.0% · 12mo
- Down + closing
- —
- Monthly P&I
- —
- Monthly cashflow
- —
- DSCR
- —
- Eligible?
- —
Short-term bridge; refi at stabilization.
Rent comps 17 comps
| Address | Beds | Baths | Sqft | Rent | $/sqft | DOM | Units | Dist |
|---|---|---|---|---|---|---|---|---|
| 118 Rano St Buffalo, NY | 3.0 | 1.0 | 1050 | $1,200 | $1.14 | 21d | 1 | 0.12mi |
| 239 Crowley Ave Buffalo, NY | 2.0 | 1.0 | 966 | $1,025 | $1.06 | 3d | 1 | 0.24mi |
| 356 Hertel Ave Buffalo, NY | 2.0 | 1.5 | 800 | $2,300 | $2.88 | 2d | 1 | 0.37mi |
| 15 Ontario St Unit 1 Buffalo, NY | 3.0 | 1.0 | 1000 | $1,500 | $1.50 | 1d | 1 | 0.44mi |
| 15 Beatrice Ave Buffalo, NY | 2.0 | 1.0 | 950 | $1,150 | $1.21 | 14d | 1 | 0.50mi |
| 68 Laforce Pl Unit U Buffalo, NY | 2.0 | 1.0 | 900 | $1,099 | $1.22 | 43d | 1 | 0.52mi |
| 134 Philadelphia St Buffalo, NY | 3.0 | 1.0 | 871 | $1,100 | $1.26 | 2d | 1 | 0.53mi |
| 2099 Niagara St Unit A Buffalo, NY | 2.0 | 1.0 | 1000 | $1,197 | $1.20 | 43d | 1 | 0.65mi |
| 155 Germain St Apt 1 Buffalo, NY | 2.0 | 1.0 | 1000 | $1,000 | $1.00 | 10d | 1 | 0.77mi |
| 480 W Hazeltine Ave Buffalo, NY | 3.0 | 1.0 | 989 | $1,900 | $1.92 | 23d | 1 | 0.88mi |
| 72 Reservation St Unit 2 Buffalo, NY | 3.0 | 1.0 | 950 | $1,150 | $1.21 | 23d | 1 | 0.91mi |
| 2075 Kenmore Ave Unit 611 Buffalo, NY | 2.0 | 2.0 | 981 | $1,950 | $1.99 | 1d | 1 | 0.94mi |
| 68 Peter St Buffalo, NY | 2.0 | 1.0 | 900 | $900 | $1.00 | 23d | 1 | 0.95mi |
| 1920 Niagara St Unit 1 Buffalo, NY | 2.0 | 1.0 | 695 | $999 | $1.44 | 43d | 1 | 0.97mi |
| 293 Grote St Buffalo, NY | 1.0–2.0 | 1.0–2.0 | 817 | $2,345 | $2.87 | 1d | 1 | 1.14mi |
| 1558 Elmwood Ave Unit 4 Buffalo, NY | 2.0 | 1.0 | 800 | $1,100 | $1.38 | 43d | 1 | 1.30mi |
| 100 Forest Ave Buffalo, NY | 2.0–4.0 | 2.0–4.0 | 1304 | $1,600 | $1.23 | 1d | 14 | 1.50mi |
Listing history 5 events
-
2026-04-02status Pending
-
2026-03-20$119,900 Active
-
2021-12-10soldstatus $70,000 Closed Sale or Rented 426-char remark
Show marketing remark (426 chars)
This house could be a great opportunity for an investor to buy a house with a long term tenant in place. This could also be a great house for an owner occupant. Please use Showing Time to schedule an appointment. Available windows of time will be Wednesday 6-8pm and Sunday 12-3pm. House is currently rented for $675/month on a Month-to-Month lease. Tenant pays gas and electric. Please email offers to Earl@IrishJonesRealty.
-
2021-09-23status Under Contract- Do Not Show 426-char remark
Show marketing remark (426 chars)
This house could be a great opportunity for an investor to buy a house with a long term tenant in place. This could also be a great house for an owner occupant. Please use Showing Time to schedule an appointment. Available windows of time will be Wednesday 6-8pm and Sunday 12-3pm. House is currently rented for $675/month on a Month-to-Month lease. Tenant pays gas and electric. Please email offers to Earl@IrishJonesRealty.
-
2021-07-27$84,900 Active 426-char remark
Show marketing remark (426 chars)
This house could be a great opportunity for an investor to buy a house with a long term tenant in place. This could also be a great house for an owner occupant. Please use Showing Time to schedule an appointment. Available windows of time will be Wednesday 6-8pm and Sunday 12-3pm. House is currently rented for $675/month on a Month-to-Month lease. Tenant pays gas and electric. Please email offers to Earl@IrishJonesRealty.
ⓘ Source: listings_history table (triggers on properties + properties_extension) + one-shot
backfill from property_details.listing_events for pre-trigger history.
Tax reassessment forecast NY · Partial reset (capped growth)
- Current annual tax
- $336 · $28/mo
- Projected year-2 tax
- $1,181 · $98/mo
- Expected delta
- +$845/yr (+$70/mo · 251.3%)
ⓘ Screening estimate from a state-policy table — verify with the county assessor before closing.
Climate risk First Street
- Flood 1/10 Low FEMA zone X (unshaded) · 0% chance over 30 yrs
- Wildfire 1/10 Low
- Heat 3/10 Moderate 7 d/yr ≥93°F today · 15 d/yr by 30 yrs out
- Wind 1/10 Low
- Air quality 3/10 Moderate 3 unhealthy d/yr today · 4 by 30 yrs out
Nearby sold comps map
Loading sold comps map…
Walkable amenities ~0.75 mi
Loading nearby amenities…
Taxation est. · year 1
- Rental income
- $15,330
- − Mortgage interest
- −$6,716
- − Property taxes
- −$336
- − Insurance
- −$600
- − Repairs & maintenance
- −$1,226
- − Management
- −$1,226
- − Depreciation
- −$3,488
- Taxable income
- $1,737
- Est. tax owed @ 24.0%
- −$417
- After-tax cash flow
- $3,213/yr
For passive investors: Depreciation is non-cash, so a rental often shows a tax loss while cash-flowing — sheltering income. Rental losses are passive: they offset passive income freely, and up to $25,000/yr can offset ordinary (W-2) income if you actively participate and your MAGI is under $100k (phasing out to $0 by $150k); unused losses carry forward. On sale, claimed depreciation is recaptured at up to 25%, and gains may owe capital-gains tax (a 1031 exchange can defer both). Figures are a year-1 estimate at your 24.0% rate — not tax advice; consult a CPA.
Schools (NCES district)
- District
- Buffalo City School District
- NCES district ID
- 3605850
- Math proficiency
- 41% ▲ 11.00%
- Reading proficiency
- 40% ▲ 7.00%
- Median HH income
- $31,665
- Composite
- 33.17/100
- National rank
- #5544
- State rank
- #535 of 590 in NY
Livability — Buffalo
- Score
- 77/100
- State rank
- #195
- US rank
- #3011
Category grades
Schools grade is shown separately in the Schools card above.
Census & demographics
- Census place
- Buffalo, NY
- County
- Erie County · 714,559 people
- City population
- 440,021
- Metro
- Buffalo-Cheektowaga, NY
- Population (ZIP)
- 26,327
- Household income
- $39,753
- Rent vs Own
- Severe rent burden
- 2177.0
Population outlook (Erie County) Hauer SSP2
- Today (2025)
- 933,037 people
- By 2030
- 935,181 · +0.2%
- By 2040
- 928,531 · -0.5%
- By 2050
- 905,725 · -2.9%
- By 2075
- 834,037 · -10.6%
- By 2100
- 708,033 · -24.1%
Race, ethnicity, and origin ACS 2023
- Neighborhood character
- Highly diverse neighborhood (Simpson 0.74)
- Race & ethnicity
- White 40% Hispanic / Latino 23% Black 16% Asian 15% Two or more races 14%
- Hispanic origin (detail)
- Puerto Rican 18% Dominican 2%
- Common ancestry
- Romanian 8% Portuguese 1% Arab 1%
- Foreign-born
- 19% · Philippines, Canada, India
- Languages at home
- 65% English-only · Spanish 14% Other Asian/Pacific 10% Other Indo-European 5%
Political lean MEDSL · Erie
- 2024 margin
- Lean D (+9.7) · D 54.8% · R 45.2%
- 2008→2024 swing
- -7.9pp toward R · 2008: 17.5pp · 2024: 9.7pp
- All cycles
- 2024: D+9.7 2020: D+14.7 2016: D+4.8 2012: D+15.6 2008: D+17.5
Not yet ingested
- Civics
- —
Market trends
- HPI YoY
- ▼ -54.42%
- Current HPI
- 233.0902
- Rent YoY
- ▲ 8.19%
- Metro
- Buffalo-Cheektowaga, NY
- State GDP YoY
- ▲ 2.60%
- F500 in state
- 92
Industry mix (Fortune 500 HQ in NY)
| Industry | F500 HQs | Revenue |
|---|---|---|
| Financial Services | 10 | $950B |
|
||
| Consumer Goods | 9 | $162B |
|
||
| Insurance | 4 | $225B |
|
||
| Telecommunications | 2 | $144B |
|
||
| Pharmaceuticals | 2 | $112B |
|
||
| Media / Entertainment | 2 | $69B |
|
||
Price history
+41.2% since first listed5 events — show timeline
- 2026-04-02 Pending — WNYREIS
- 2026-03-20 Listed $119,900 WNYREIS
- 2021-12-10 Sold (MLS) $70,000 WNYREIS
- 2021-09-23 Pending — WNYREIS
- 2021-07-27 Listed $84,900 WNYREIS
Property tax history
+4.5%/yrLatest (2025): $336 · +0.0% YoY. Source: county tax records.
Cash-flow waterfall
monthlySold comps — $/sqft
last 12 mo · ≤1 miLoading sold comps…