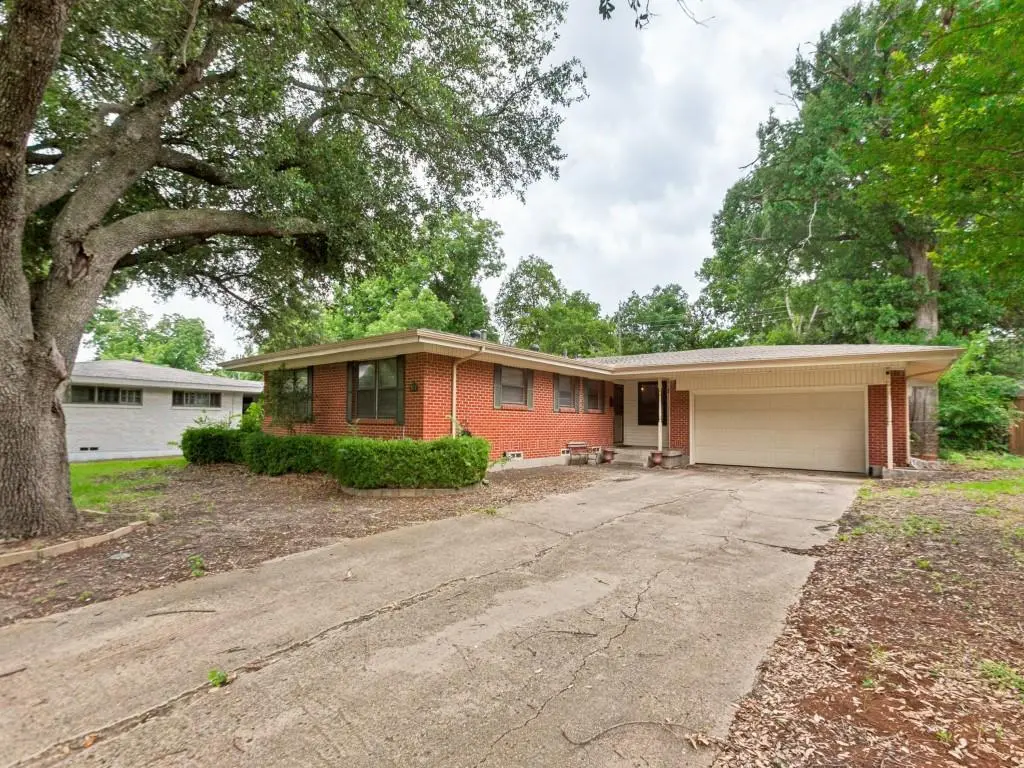
917 Blossom Cir · Garland, TX
Flood risk 1/10 · Minimal
- FEMA flood zone
- X (unshaded)
- Chance of flooding over 30 yrs
- 0.0%
- Est. flood insurance / yr
- $507 – $1,088
Fire risk 1/10 · Minimal
- Est. fire insurance / yr
- $1,222 – $2,270
Heat risk 7/10 · Major
- Hot days now (above 109°F)
- 7 days/yr
- Hot days in 30 yrs
- 22 days/yr
Wind risk 6/10 · Moderate
- Chance of severe wind over 30 yrs
- 27.0%
Air-quality risk 2/10 · Minimal
- Unhealthy air days now
- 2 days/yr
- Unhealthy air days in 30 yrs
- 2 days/yr
Risk factors via First Street. Map © Google.
Why this score? — see what drove the D grade
The composite is a weighted blend of 9 inputs, each scored 0–100. Each bar is that input's sub-score; the figure is the points it added to the 100-point composite (weight × sub-score).
- ARV discount +15.0/15.0
- Cash flow +7.6/30.0
- 1% rule +3.8/10.0
- Livability +3.7/5.0
- Rent growth +3.3/5.0
- Schools +2.9/10.0
- Condition / age +2.5/5.0
- DSCR +1.7/10.0
- Appreciation +0.0/10.0
$230,000
🖨 Deal sheet 📄 Offer letter ✓ Due diligence
Listing remarks MLS
Gorgeous updated home in great location! Spacious kitchen with tons of cabinets, most appliances updated in last few years, formal dining could be second living area or office. Extra room for storage or shop. Rood 4yrs, berber carpet, 30' x 12' covered and enclosed deck with rustic atmosphere.
Key facts
- Convenient access
- Hardwood floors
- Roof replaced
Tags
Property features AI
Finance
- Financial info: Listing terms: Cash; Loan type treated as clear; No second mortgage listed
- HOA & community: Voluntary association; HOA: Orchard Hills (management phone available)
Exterior
- Parking: Two covered parking spaces; 2-car attached garage (approximately 19' wide x 23' long); Driveway; Garage faces front
- Security: No accessibility or smart-home security features listed
- Utilities: City water; City sewer; Not in a municipal utility district
- Home design: Single family residence; Residential property; One story; Not attached to another property; Subdivision: Orchard Hills Estates
- Construction: Brick construction; Composition roof; Pillar/post/pier foundation; Built in 1955
- Exterior features: Covered, enclosed porch; Covered porch(es); Cul-de-sac lot; Few trees; Landscaped yard; Barbed wire fencing
Interior
- Kitchen: Dishwasher; Electric cooktop; Electric oven; Microwave; Built-in cabinets; Water line to refrigerator
- Bedrooms: 3 bedrooms (all on the main level); Primary bedroom with ensuite bath
- Flooring: Tile flooring; Wood flooring
- Bathrooms: 2 full bathrooms
- Heating & cooling: Central heating; Central air conditioning; Gas logs in fireplace
- Interior features: Cable TV available; Two living areas; One dining area; 9 total rooms; One-level layout
- Laundry & utility: No specific laundry details provided
Neighborhood map
What this means for you Summary
Snapshot
- This is a 3-bed/3.0-bath single-family listed at $230k.
Deal economics
- At list price, monthly cash flow is $-276 ($-3k/yr) — negative.
- To cash-flow at today's rent, offer at most $181k (21.2% below list).
- To meet the 1% rule (rent ≥ 1% of price), the offer needs to be $203k (11.7% below list).
- Recommended offer: $181k (21.2% below list) — sets the bar for cash-flow.
- Cap rate 4.9% vs local median 3.5% in Garland — top-decile yield for the area; either an underpriced asset or a hidden risk that comps aren't pricing in. Stress-test before assuming the spread holds.
Location & tenants
- Location reads 74/100 on livability (#165 in TX, #4,447 nationally) — a middle-class / working-renter tenant base. Strengths: commute A+, housing A+, cost of living A-; Watch: amenities C-, schools D+, health & safety F.
- Garland ISD (suburban): math 27% / reading 37% proficiency, ranked #553 of 826 in TX (top 67%) — families likely to look elsewhere, expect single-tenant / working-renter base with shorter leases.
- Market conditions: Rents rising (+3.4%/yr); 99 active listings in the ZIP; 34 comparable units currently listed for rent nearby; rentals at typical pace (median 24d on market — plan ~3-4 weeks tenant-placement turnaround); 47% of comp listings sitting > 30 days — soft ceiling on asking rent; 12,577 units permitted in Dallas County in 2024 (6,829 in 5+ unit buildings).
- This rent runs 35% of the median local income ($70k/yr) — at the standard rent-burdened threshold; future hikes will face affordability resistance.
Forward outlook
- Local home prices are declining (-3.0%/yr); year-one equity from $2k of loan paydown is wiped out by about $7k of value loss. Plan a longer hold.
- Dallas County population projected at +35% by 2050 — long-run rental-demand tailwind backs the buy-and-hold thesis.
Negotiation context
- Only 1 days on market — expect competitive offers; lowballing is unlikely to land.
- 2 sale attempts since 22y ago with the ask held roughly flat each time — persistent listings suggest the price (not the market) is what's stuck; bring a comps-based counter.
Risks & watch-outs
- Watch-outs: property tax is 3.0% of price; built in 1955 — expect roof / HVAC / electrical / plumbing capex.
- Climate carrying-cost: major wind risk, 27% chance of damaging wind over 30y; extreme-heat days projected 7→22/yr by 2055 (HVAC capex compounding) — expect insurance premiums to compound above CPI over the hold.
Questions for the listing agent
- What do current leases actually rent for vs. the listed asking? Can we see a recent rent roll and the last 12 months of T-12 income?
- Built in 1955 — when were the roof, HVAC, electrical panel, plumbing, and water heater last replaced?
- Property tax is high relative to price — has the assessment been appealed recently, and will the sale trigger a re-assessment?
- Is there a deadline driving the sale (1031 exchange, divorce, estate, relocation)? That informs how much negotiation room exists.
- Schools are D-rated, which usually means shorter tenancies and higher turnover. Who's the typical renter profile here, and what's been the actual vacancy rate?
- The area grade is low — what's the realistic commute time and amenity access for the typical tenant pool here? Any planned neighborhood developments (good or bad) we should know about?
- What's the average days-on-market for RENTAL listings here right now (not sales)? A rising rental-DOM trend means longer vacancies and softer asking-rent achievability than the comps imply.
- What's the recent tenant-quality profile in this submarket — average credit score on applications, eviction rate, late-payment / NSF rate, and stable-employment percentage? A property-management company in the area should have these aggregated.
- How much new for-sale + rental construction is in the pipeline within 1–3 miles? Heavy new supply typically softens prices + rents 12–24 months out; constrained supply supports both.
Investment metrics
- 1% rule
- 0.88% ✗
- Cap rate
- 4.85%
- Cash-on-cash
- -5.14%
- DSCR
- 0.77
- GRM
- 9.4
CMA / ARV
- ARV (on-the-fly)
- $352,610
- Comps found
- 12
Show comp detail 12 sales within ~0.75 mi
| Address | Dist | Beds/Ba | Sqft | Sold | Price | $/sf | Match |
|---|---|---|---|---|---|---|---|
| 900 Treasure Rd | 0.23mi | 3/2.0 | 1,870 (-2%) | 2mo | $419,000 | $224 | 81 |
| 2902 Medina Dr | 0.48mi | 4/3.0 (+1) | 1,847 (-3%) | 3mo | $305,000 | $165 | 65 |
| 2900 Old Orchard Rd | 0.08mi | 4/2.0 (+1) | 1,659 (-13%) | 4mo | $350,000 | $211 | 62 |
| 2710 Fairfax Dr | 0.31mi | 3/2.0 | 1,693 (-11%) | 2mo | $329,000 | $194 | 62 |
| 826 Wildgrove Dr | 0.51mi | 3/2.0 | 1,785 (-6%) | 1mo | $319,000 | $179 | 61 |
| 908 Saturn Springs Dr | 0.38mi | 3/3.0 | 2,125 (+12%) | 4mo | $398,908 | $188 | 60 |
| 901 Saturn Springs Dr | 0.42mi | 4/2.0 (+1) | 2,069 (+9%) | 2mo | $250,000 | $121 | 55 |
| 809 Carroll Dr | 0.56mi | 4/2.0 (+1) | 1,788 (-6%) | 3mo | $360,000 | $201 | 52 |
| 509 W Ridgewood Dr | 0.69mi | 3/2.0 | 1,783 (-6%) | 4mo | $330,000 | $185 | 50 |
| 3213 Pecan Ln | 0.31mi | 4/2.0 (+1) | 2,188 (+15%) | 2mo | $335,000 | $153 | 50 |
| 505 Prescott | 0.49mi | 3/2.0 | 1,640 (-14%) | 1mo | $285,000 | $174 | 49 |
| 105 Tulip Dr | 0.70mi | 4/2.5 (+1) | 1,739 (-9%) | 6mo | $299,000 | $172 | 41 |
Match score weights: distance 35% · size 25% · config 20% · recency 20%. Top-matched comps best support the ARV.
Projected returns pro-forma
-3.0% appreciation · 3.38% rent growth · sell at horizon
- IRR
- -24.4%
- Equity multiple
- 0.16×
- Total profit
- $-53,861
- Equity at exit
- $34,294
- IRR
- -18.3%
- Equity multiple
- -0.02×
- Total profit
- $-65,464
- Equity at exit
- $19,886
Cash invested: $64,400 (down + closing). Projections, not guarantees.
Landlord ↔ Tenant lean methodology
- Overall (STATE)
- 87 Strongly Landlord-Friendly
- State Texas
- 87 Strongly Landlord-Friendly · R+5
- County
- — inherits STATE
- City
- — inherits STATE
ZIP-level market 75041
- Home prices YoY
- -31.0%
- Rents YoY
- 3.4%
- Active inventory
- 99
- Price-to-rent
- 9.4×
Monthly cashflow live
- Estimated rent
- $2,031 high interval (Pro) →
- Mortgage (P&I)
- −$1,206
- Tax from tax record
- −$579 /mo · $6,947/yr
- Insurance
- −$96
- HOA
- −$0
- Vacancy / Maint / Mgmt
- −$427
- Net cashflow
- $-276
Break-even live
UW: 25.0% down · 7.5% · 30yr · 1.5% tax · 5.0% vac · 8.0% maint · 8.0% mgmt
Financing live
Cash to close
- Down payment
- $57,500
- Closing costs
- $6,900
- Reserves months
- —
- Total cash needed
- —
Loan-product check · same deal, 3 products live
Conventional
25% down · 7.5% · 30yr
- Down + closing
- —
- Monthly P&I
- —
- Monthly cashflow
- —
- DSCR
- —
- Eligible?
- —
Personal DTI + credit; lowest rate.
DSCR
20% down · 8.5% · 30yr
- Down + closing
- —
- Monthly P&I
- —
- Monthly cashflow
- —
- DSCR
- —
- Eligible?
- —
No personal income docs; deal must DSCR.
Hard money
10% down · 12.0% · 12mo
- Down + closing
- —
- Monthly P&I
- —
- Monthly cashflow
- —
- DSCR
- —
- Eligible?
- —
Short-term bridge; refi at stabilization.
Rent comps 34 comps
| Address | Beds | Baths | Sqft | Rent | $/sqft | DOM | Units | Dist |
|---|---|---|---|---|---|---|---|---|
| 744 McDonald Dr Unit 744 Garland, TX | 4.0 | 2.5 | 1280 | $1,865 | $1.46 | 43d | 1 | 0.40mi |
| 2612 Ashley Dr Garland, TX | 3.0 | 2.0 | 1580 | $2,195 | $1.39 | 43d | 1 | 0.44mi |
| 1220 Lewis Dr Garland, TX | 3.0 | 1.5 | 1598 | $1,750 | $1.10 | 15d | 1 | 0.46mi |
| 1210 McDonald Dr Garland, TX | 3.0 | 2.0 | 1406 | $1,995 | $1.42 | 43d | 1 | 0.55mi |
| 1233 McDonald Dr Garland, TX | 3.0 | 1.5 | 1260 | $1,658 | $1.32 | 24d | 1 | 0.55mi |
| 1222 McDonald Dr Garland, TX | 4.0 | 2.0 | 1915 | $1,100 | $0.57 | 4d | 1 | 0.57mi |
| 1226 McDonald Dr Garland, TX | 4.0 | 2.5 | 1915 | $1,000 | $0.52 | 20d | 1 | 0.57mi |
| 1213 Carroll Dr Garland, TX | 3.0 | 2.0 | 1312 | $2,100 | $1.60 | 7d | 1 | 0.64mi |
| 118 Brazos St Garland, TX | 3.0 | 1.0 | 1241 | $1,625 | $1.31 | 24d | 1 | 0.75mi |
| 109 W Carolyn Dr Garland, TX | 3.0 | 1.0 | 1351 | $1,950 | $1.44 | 43d | 1 | 0.77mi |
| 206 E Chico Dr Garland, TX | 4.0 | 2.0 | 1368 | $2,500 | $1.83 | 24d | 1 | 0.78mi |
| 2121 S Glenbrook Dr Garland, TX | 1.0–2.0 | 1.0–2.0 | 1012 | $1,550 | $1.53 | 2d | 6 | 0.79mi |
| 2930 Gardenia Dr Garland, TX | 3.0 | 1.0 | 1365 | $1,800 | $1.32 | 24d | 1 | 0.82mi |
| 222 Pecos St Garland, TX | 3.0 | 2.0 | 1300 | $1,845 | $1.42 | 43d | 1 | 0.84mi |
| 1818 Andover Dr Garland, TX | 3.0 | 2.0 | 1637 | $2,100 | $1.28 | 24d | 1 | 0.93mi |
| 402 E Carolyn Dr Garland, TX | 3.0 | 1.5 | 1768 | $1,950 | $1.10 | 43d | 1 | 0.96mi |
| 1817 Hemlock Dr Garland, TX | 3.0 | 2.0 | 1927 | $2,350 | $1.22 | 20d | 1 | 0.98mi |
| 318 Arborview Dr Garland, TX | 4.0 | 2.0 | 1510 | $1,984 | $1.31 | 43d | 1 | 1.05mi |
| 2406 Ridgecrest Dr Garland, TX | 3.0 | 2.0 | 1446 | $1,995 | $1.38 | 43d | 1 | 1.07mi |
| 3801 Lancelot Pl Garland, TX | 3.0 | 2.0 | 1346 | $1,790 | $1.33 | 43d | 1 | 1.07mi |
| 317 Valley Park Dr Garland, TX | 4.0 | 2.5 | 1410 | $1,999 | $1.42 | 15d | 1 | 1.08mi |
| 2739 Patricia Ln Garland, TX | 2.0 | 1.5 | 1237 | $1,550 | $1.25 | 43d | 1 | 1.10mi |
| 438 Arborview Dr Garland, TX | 4.0 | 2.0 | 1352 | $2,000 | $1.48 | 43d | 1 | 1.10mi |
| 334 Valley Park Dr Garland, TX | 4.0 | 2.5 | 1418 | $2,000 | $1.41 | 43d | 1 | 1.12mi |
| 1610 Lexington Dr Garland, TX | 4.0 | 2.5 | 2257 | $2,700 | $1.20 | 43d | 1 | 1.16mi |
| 1928 Oldgate Ln Garland, TX | 3.0 | 3.0 | 1813 | $2,090 | $1.15 | 43d | 1 | 1.24mi |
| 2031 Towngate Dr Garland, TX | 2.0 | 2.0 | 1464 | $1,690 | $1.15 | 22d | 1 | 1.26mi |
| 2012 Court Pl Garland, TX | 3.0 | 2.5 | 1880 | $1,995 | $1.06 | 16d | 1 | 1.33mi |
| 2005 Town Ct Garland, TX | 4.0 | 2.5 | 1757 | $2,050 | $1.17 | 2d | 1 | 1.35mi |
| 734 Sceptre Cir Garland, TX | 3.0 | 2.0 | 1254 | $2,000 | $1.59 | 43d | 1 | 1.41mi |
| 422 Woodmere Dr Garland, TX | 3.0 | 2.0 | 1518 | $1,995 | $1.31 | 7d | 1 | 1.43mi |
| 3242 Wexford Dr Garland, TX | 2.0 | 2.5 | 1276 | $1,915 | $1.50 | 43d | 1 | 1.49mi |
| 4689 Saturn Rd Garland, TX | 1.0–2.0 | 1.0–2.0 | 965 | $2,139 | $2.22 | 1d | 29 | 1.49mi |
| 4839 Spindrift Psge Garland, TX | 4.0 | 2.0 | 1546 | $2,400 | $1.55 | 3d | 1 | 1.49mi |
Listing history 2 events
-
2026-06-18remarks 679-char remark
-
2026-06-18$230,000 Active 1 DOM
ⓘ Source: listings_history table (triggers on properties + properties_extension) + one-shot
backfill from property_details.listing_events for pre-trigger history.
Tax reassessment forecast TX · Resets to sale price
- Current annual tax
- $6,947 · $579/mo
- Projected year-2 tax
- $6,947 · $579/mo
- Expected delta
- $0/yr ($0/mo · 0.0%)
ⓘ Screening estimate from a state-policy table — verify with the county assessor before closing.
Climate risk First Street
- Flood 1/10 Low FEMA zone X (unshaded) · 0% chance over 30 yrs
- Wildfire 1/10 Low
- Heat 7/10 Severe 7 d/yr ≥109°F today · 22 d/yr by 30 yrs out
- Wind 6/10 Major 27% chance of damaging wind over 30 yrs
- Air quality 2/10 Low 2 unhealthy d/yr today · 2 by 30 yrs out
Nearby sold comps map
Loading sold comps map…
Walkable amenities ~0.75 mi
Loading nearby amenities…
Taxation est. · year 1
- Rental income
- $24,377
- − Mortgage interest
- −$12,884
- − Property taxes
- −$6,947
- − Insurance
- −$1,150
- − Repairs & maintenance
- −$1,950
- − Management
- −$1,950
- − Depreciation
- −$6,691
- Taxable loss
- −$7,194
- Est. tax savings @ 24.0%
- +$1,727
- After-tax cash flow
- $-1,586/yr
For passive investors: Depreciation is non-cash, so a rental often shows a tax loss while cash-flowing — sheltering income. Rental losses are passive: they offset passive income freely, and up to $25,000/yr can offset ordinary (W-2) income if you actively participate and your MAGI is under $100k (phasing out to $0 by $150k); unused losses carry forward. On sale, claimed depreciation is recaptured at up to 25%, and gains may owe capital-gains tax (a 1031 exchange can defer both). Figures are a year-1 estimate at your 24.0% rate — not tax advice; consult a CPA.
Schools (NCES district)
- District
- Garland ISD
- NCES district ID
- 4820340
- Math proficiency
- 27% ▼ -23.00%
- Reading proficiency
- 37% ▼ -10.00%
- Median HH income
- $58,392
- Composite
- 28.63/100
- National rank
- #6706
- State rank
- #553 of 826 in TX
Livability — Garland
- Score
- 74/100
- State rank
- #165
- US rank
- #4447
Category grades
Schools grade is shown separately in the Schools card above.
Census & demographics
- Census place
- Garland, TX
- County
- Dallas County · 2,612,404 people
- City population
- 246,342
- Metro
- Dallas-Fort Worth-Arlington, TX
- Population (ZIP)
- 32,943
- Household income
- $70,308
- Rent vs Own
- Severe rent burden
- 910.0
Population outlook (Dallas County) Hauer SSP2
- Today (2025)
- 2,979,839 people
- By 2030
- 3,191,823 · +7.1%
- By 2040
- 3,619,611 · +21.5%
- By 2050
- 4,026,915 · +35.1%
- By 2075
- 4,957,073 · +66.4%
- By 2100
- 5,508,725 · +84.9%
Race, ethnicity, and origin ACS 2023
- Neighborhood character
- Predominantly Hispanic (70%)
- Race & ethnicity
- Hispanic / Latino 70% Two or more races 39% White 20% Black 6% Asian 2% Native American 1%
- Hispanic origin (detail)
- Mexican 53%
- Common ancestry
- Slovak 1% Lithuanian 1% Serbian 1%
- Foreign-born
- 34% · Canada, Jamaica, Vietnam
- Languages at home
- 33% English-only · Spanish 63% Vietnamese 1% Other Asian/Pacific 1%
Political lean MEDSL · Dallas
- 2024 margin
- Strong D (+22.2) · D 60.2% · R 38.0% · Other 1.8%
- 2008→2024 swing
- +6.9pp toward D · 2008: 15.3pp · 2024: 22.2pp
- All cycles
- 2024: D+22.2 2020: D+31.6 2016: D+26.2 2012: D+15.4 2008: D+15.3
Not yet ingested
- Civics
- —
Market trends
- HPI YoY
- ▼ -145.65%
- Current HPI
- 324.7929
- Rent YoY
- ▲ 3.38%
- Metro
- Dallas-Fort Worth-Arlington, TX
- State GDP YoY
- ▲ 3.95%
- F500 in state
- 110
Industry mix (Fortune 500 HQ in TX)
| Industry | F500 HQs | Revenue |
|---|---|---|
| Energy | 16 | $1,198B |
|
||
| Technology | 5 | $198B |
|
||
| Engineering / Construction | 4 | $72B |
|
||
| Energy Services | 3 | $60B |
|
||
| Utilities | 3 | $41B |
|
||
| Healthcare | 2 | $330B |
|
||
Price history
+100.0% since first listed7 events — show timeline
- 2026-06-18 Listed $230,000 NTREIS
- 2004-10-29 Sold (Public Records) — Public Records
- 2004-10-26 Sold (MLS) — NTREIS
- 2004-10-01 Listing Removed — NTREIS
- 2004-09-21 Listed $115,000 NTREIS
- 2000-09-06 Sold (Public Records) — Public Records
- 1999-11-05 Sold (Public Records) — Public Records
Property tax history
+5.5%/yrLatest (2025): $6,947 · +5.3% YoY. Source: county tax records.
Cash-flow waterfall
monthlySold comps — $/sqft
last 12 mo · ≤1 miLoading sold comps…