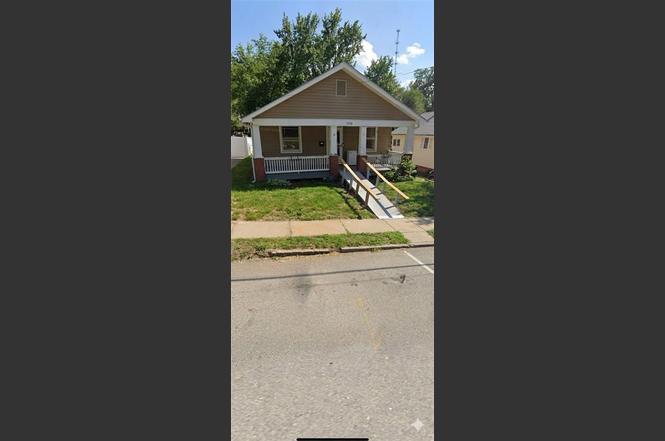
1718 Sacramento St · St. Joseph, MO
Flood risk 1/10 · Minimal
- FEMA flood zone
- X
- Chance of flooding over 30 yrs
- 0.0%
- Est. flood insurance / yr
- $473 – $860
Fire risk 1/10 · Minimal
- Est. fire insurance / yr
- $1,054 – $1,958
Heat risk 4/10 · Minor
- Hot days now (above 106°F)
- 7 days/yr
- Hot days in 30 yrs
- 16 days/yr
Wind risk 2/10 · Minimal
- Chance of severe wind over 30 yrs
- —
Air-quality risk 2/10 · Minimal
- Unhealthy air days now
- 1 days/yr
- Unhealthy air days in 30 yrs
- 1 days/yr
Risk factors via First Street. Map © Google.
Why this score? — see what drove the C grade
The composite is a weighted blend of 9 inputs, each scored 0–100. Each bar is that input's sub-score; the figure is the points it added to the 100-point composite (weight × sub-score).
- Cash flow +25.9/30.0
- DSCR +8.7/10.0
- 1% rule +6.1/10.0
- ARV discount +4.8/15.0
- Schools +2.8/10.0
- Rent growth +2.5/5.0
- Livability +2.5/5.0
- Condition / age +2.5/5.0
- Appreciation +0.0/10.0
$82,500
🖨 Deal sheet 📄 Offer letter ✓ Due diligence
Listing remarks MLS
Beautifully remodeled home with lots of new including vinyl siding, roof, retaining wall, sheetrock, light fixtures, interior paint, carpet & water heater-Gorgeous updated kitchen with bar area, new cabinets & countertops, tile floor & stainless steel dishwasher Wonderful move in ready home with updated bath, refinished wood floors, deck, fenced yard and the list goes on-Priced to sell quickly-A must see
Key facts
- 4,356 sq ft lot
- Garage
- Listed 4 days
Property features AI
Finance
- Financial info: Annual tax amount listed (not included per instructions)
Exterior
- Parking: 1-car garage; Basement parking/garage entrance
- Utilities: Public water
- Home design: Single-family residence; Ranch style; One story
- Construction: Frame construction; Composition roof; Approximately 101+ years old
- Exterior features: Lot in public records (4,356 square feet); Not in a flood plain
Interior
- Bedrooms: 2 bedrooms on the main level
- Bathrooms: 1 full bathroom on the main level
- Heating & cooling: Natural gas heating; Window unit(s) cooling and other cooling
- Interior features: Ranch floor plan; Full unfinished basement with garage entrance
Neighborhood map
What this means for you Summary
Snapshot
- This is a 2-bed/1.0-bath single-family listed at $82k.
Deal economics
- At list price, monthly cash flow is $203 ($2k/yr) — positive.
- The deal already cash-flows at list — no discount required.
- Meets the 1% rule at list price ($916 rent vs $82k).
- Cap rate 9.2% vs local median 4.7% in St. Joseph — top-decile yield for the area; either an underpriced asset or a hidden risk that comps aren't pricing in. Stress-test before assuming the spread holds.
Location & tenants
- Location reads: area grade C — affects rentability + tenant quality, not the cash-flow math above.
- St. Joseph (urban): math 28% / reading 38% proficiency, ranked #241 of 324 in MO (top 74%) — families likely to look elsewhere, expect single-tenant / working-renter base with shorter leases.
- Market conditions: 95 active listings in the ZIP; 11 comparable units currently listed for rent nearby; rentals lingering (median 44d on market — plan ~5-8 weeks vacancy on turnover, expect pricing pressure); 100% of comp listings sitting > 30 days — soft ceiling on asking rent; 70 units permitted in Buchanan County in 2024 (0 in 5+ unit buildings).
Forward outlook
- Local home prices are declining (-3.0%/yr); year-one equity from $570 of loan paydown is wiped out by about $2k of value loss. Plan a longer hold.
- Buchanan County population projected to shrink 6% by 2050 — rents likely to lag national; underwrite the cash flow, not the appreciation.
Negotiation context
- Only 5 days on market — expect competitive offers; lowballing is unlikely to land.
- 6 sale attempts since 23y ago with the ask held roughly flat each time — persistent listings suggest the price (not the market) is what's stuck; bring a comps-based counter.
Risks & watch-outs
- Watch-outs: built in 1907 — expect roof / HVAC / electrical / plumbing capex.
Questions for the listing agent
- Built in 1907 — when were the roof, HVAC, electrical panel, plumbing, and water heater last replaced?
- Is there a deadline driving the sale (1031 exchange, divorce, estate, relocation)? That informs how much negotiation room exists.
- What's the average days-on-market for RENTAL listings here right now (not sales)? A rising rental-DOM trend means longer vacancies and softer asking-rent achievability than the comps imply.
- What's the recent tenant-quality profile in this submarket — average credit score on applications, eviction rate, late-payment / NSF rate, and stable-employment percentage? A property-management company in the area should have these aggregated.
- How much new for-sale + rental construction is in the pipeline within 1–3 miles? Heavy new supply typically softens prices + rents 12–24 months out; constrained supply supports both.
Investment metrics
- 1% rule
- 1.11% ✓
- Cap rate
- 9.24%
- Cash-on-cash
- 10.53%
- DSCR
- 1.47
- GRM
- 7.5
CMA / ARV
- ARV (on-the-fly)
- $77,792
- Comps found
- 12
Show comp detail 12 sales within ~0.75 mi
| Address | Dist | Beds/Ba | Sqft | Sold | Price | $/sf | Match |
|---|---|---|---|---|---|---|---|
| 1409 Pacific St | 0.41mi | 2/1.0 | 896 (+1%) | 6mo | $112,067 | $125 | 73 |
| 1501 Pacific St | 0.40mi | 2/1.0 | 936 (+6%) | 2mo | $79,900 | $85 | 70 |
| 1611 Seneca St | 0.28mi | 3/1.0 (+1) | 825 (-7%) | 8mo | $23,000 | $28 | 65 |
| 1616 S 10th St | 0.51mi | 2/1.0 | 835 (-6%) | 4mo | $35,000 | $42 | 64 |
| 808 S 23rd St | 0.52mi | 2/1.0 | 850 (-4%) | 8mo | $75,000 | $88 | 63 |
| 1018 S 20th St | 0.32mi | 2/1.0 | 989 (+12%) | 3mo | $35,000 | $35 | 63 |
| 1118 S 13th St | 0.39mi | 3/1.0 (+1) | 816 (-8%) | 4mo | $119,000 | $146 | 60 |
| 2101 Penn St | 0.30mi | 3/1.0 (+1) | 988 (+12%) | 2mo | $134,900 | $137 | 60 |
| 1603 Angelique St | 0.71mi | 2/1.0 | 918 (+4%) | 7mo | $39,900 | $43 | 55 |
| 2340 S 13th St | 0.71mi | 2/1.0 | 924 (+4%) | 8mo | $134,900 | $146 | 53 |
| 2502 S 15th St | 0.74mi | 2/1.0 | 826 (-7%) | 2mo | $56,000 | $68 | 52 |
| 2215 Lafayette St | 0.44mi | 3/1.0 (+1) | 1,016 (+15%) | 7mo | $124,900 | $123 | 44 |
Match score weights: distance 35% · size 25% · config 20% · recency 20%. Top-matched comps best support the ARV.
Projected returns pro-forma
-3.0% appreciation · 3.0% rent growth · sell at horizon
- IRR
- -0.5%
- Equity multiple
- 0.98×
- Total profit
- $-474
- Equity at exit
- $12,301
- IRR
- 9.1%
- Equity multiple
- 1.70×
- Total profit
- $16,146
- Equity at exit
- $7,133
Cash invested: $23,100 (down + closing). Projections, not guarantees.
Landlord ↔ Tenant lean methodology
- Overall (STATE)
- 81 Strongly Landlord-Friendly
- State Missouri
- 81 Strongly Landlord-Friendly · R+10
- County
- — inherits STATE
- City
- — inherits STATE
ZIP-level market 64507
- Active inventory
- 95
- Price-to-rent
- 7.5×
Monthly cashflow live
- Estimated rent
- $916 high interval (Pro) →
- Mortgage (P&I)
- −$433
- Tax from tax record
- −$54 /mo · $643/yr
- Insurance
- −$34
- HOA
- −$0
- Vacancy / Maint / Mgmt
- −$192
- Net cashflow
- $203
Break-even live
UW: 25.0% down · 7.5% · 30yr · 1.5% tax · 5.0% vac · 8.0% maint · 8.0% mgmt
Financing live
Cash to close
- Down payment
- $20,625
- Closing costs
- $2,475
- Reserves months
- —
- Total cash needed
- —
Loan-product check · same deal, 3 products live
Conventional
25% down · 7.5% · 30yr
- Down + closing
- —
- Monthly P&I
- —
- Monthly cashflow
- —
- DSCR
- —
- Eligible?
- —
Personal DTI + credit; lowest rate.
DSCR
20% down · 8.5% · 30yr
- Down + closing
- —
- Monthly P&I
- —
- Monthly cashflow
- —
- DSCR
- —
- Eligible?
- —
No personal income docs; deal must DSCR.
Hard money
10% down · 12.0% · 12mo
- Down + closing
- —
- Monthly P&I
- —
- Monthly cashflow
- —
- DSCR
- —
- Eligible?
- —
Short-term bridge; refi at stabilization.
Rent comps 11 comps
| Address | Beds | Baths | Sqft | Rent | $/sqft | DOM | Units | Dist |
|---|---|---|---|---|---|---|---|---|
| 1300 S 11th St Apt 22 St Joseph, MO | 2.0 | 1.0 | 866 | $998 | $1.15 | 44d | 1 | 0.45mi |
| 1106 Olive St Saint Joseph, MO | 2.0 | 1.0 | 700 | $725 | $1.04 | 44d | 1 | 0.56mi |
| 2219 S 10th St Saint Joseph, MO | 2.0 | 1.0 | 800 | $900 | $1.12 | 44d | 1 | 0.65mi |
| 303 S 13th St St Joseph, MO | 3.0 | 1.5 | 1000 | $950 | $0.95 | 44d | 1 | 0.86mi |
| 201 S 10th St Saint Joseph, MO | 2.0 | 1.0 | 600 | $1,000 | $1.67 | 44d | 1 | 0.97mi |
| 2408 Jules St Saint Joseph, MO | 2.0 | 1.0 | 1032 | $1,100 | $1.07 | 44d | 1 | 1.12mi |
| 1015 Faraon St St Joseph, MO | 1.0 | 1.0 | 743 | $820 | $1.10 | 44d | 1 | 1.20mi |
| 425 N 25th St St Joseph, MO | 2.0 | 1.0 | 800 | $850 | $1.06 | 44d | 1 | 1.27mi |
| 516 N 10th St Saint Joseph, MO | 1.0–2.0 | 1.0 | 700 | $900 | $1.29 | 44d | 1 | 1.33mi |
| 3128 Midland St Saint Joseph, MO | 2.0 | 1.0 | 1104 | $975 | $0.88 | 44d | 1 | 1.40mi |
| 809 Hall St Unit B St Joseph, MO | 1.0 | 1.0 | 750 | $850 | $1.13 | 44d | 1 | 1.49mi |
Listing history 6 events
-
2026-06-19days on market $82,500 Active 5 DOM
-
2026-06-18days on market $82,500 Active 4 DOM
-
2026-06-17days on market $82,500 Active 3 DOM
-
2026-06-16days on market $82,500 Active 2 DOM
-
2026-06-15remarks 450-char remark
-
2026-06-15$82,500 Active 1 DOM
ⓘ Source: listings_history table (triggers on properties + properties_extension) + one-shot
backfill from property_details.listing_events for pre-trigger history.
Tax reassessment forecast MO · Resets to sale price
- Current annual tax
- $643 · $54/mo
- Projected year-2 tax
- $800 · $67/mo
- Expected delta
- +$158/yr (+$13/mo · 24.5%)
ⓘ Screening estimate from a state-policy table — verify with the county assessor before closing.
Climate risk First Street
- Flood 1/10 Low FEMA zone X · 0% chance over 30 yrs
- Wildfire 1/10 Low
- Heat 4/10 Moderate 7 d/yr ≥106°F today · 16 d/yr by 30 yrs out
- Wind 2/10 Low
- Air quality 2/10 Low 1 unhealthy d/yr today · 1 by 30 yrs out
Nearby sold comps map
Loading sold comps map…
Walkable amenities ~0.75 mi
Loading nearby amenities…
Taxation est. · year 1
- Rental income
- $10,987
- − Mortgage interest
- −$4,621
- − Property taxes
- −$643
- − Insurance
- −$412
- − Repairs & maintenance
- −$879
- − Management
- −$879
- − Depreciation
- −$2,400
- Taxable income
- $1,152
- Est. tax owed @ 24.0%
- −$277
- After-tax cash flow
- $2,156/yr
For passive investors: Depreciation is non-cash, so a rental often shows a tax loss while cash-flowing — sheltering income. Rental losses are passive: they offset passive income freely, and up to $25,000/yr can offset ordinary (W-2) income if you actively participate and your MAGI is under $100k (phasing out to $0 by $150k); unused losses carry forward. On sale, claimed depreciation is recaptured at up to 25%, and gains may owe capital-gains tax (a 1031 exchange can defer both). Figures are a year-1 estimate at your 24.0% rate — not tax advice; consult a CPA.
Schools (NCES district)
- District
- St. Joseph
- NCES district ID
- 2927060
- Math proficiency
- 28% ▼ -6.00%
- Reading proficiency
- 38% ▼ -1.00%
- Median HH income
- $43,007
- Composite
- 27.99/100
- National rank
- #6853
- State rank
- #241 of 324 in MO
Livability — St. Joseph
No livability data for this city. (Only ~50 U.S. cities are tracked.)
Census & demographics
- Census place
- St. Joseph, MO
- City population
- 44,382
- Population (ZIP)
- 14,159
Population outlook (Buchanan County) Hauer SSP2
- Today (2025)
- 89,041 people
- By 2030
- 88,401 · -0.7%
- By 2040
- 86,220 · -3.2%
- By 2050
- 83,603 · -6.1%
- By 2075
- 76,750 · -13.8%
- By 2100
- 67,623 · -24.1%
Race, ethnicity, and origin ACS 2023
- Neighborhood character
- Predominantly White (81%)
- Race & ethnicity
- White 81% Black 8% Two or more races 7% Hispanic / Latino 5%
- Hispanic origin (detail)
- Mexican 2% Puerto Rican 2%
- Common ancestry
- Slovak 2% Lithuanian 2% Romanian 2%
- Foreign-born
- 2% · Canada
- Languages at home
- 97% English-only · Spanish 2% French/Haitian/Cajun 1%
Political lean MEDSL · Buchanan
- 2024 margin
- Strong R (+28.0) · D 35.2% · R 63.3% · Other 1.5%
- 2008→2024 swing
- -28.2pp toward R · 2008: 0.1pp · 2024: -28.0pp
- All cycles
- 2024: R+28.0 2020: R+24.6 2016: R+26.2 2012: R+8.7 2008: D+0.1
Not yet ingested
- Civics
- —
Market trends
- HPI YoY
- ▼ -121.49%
- Current HPI
- 165.1511
- Rent YoY
- —
- Metro
- —
- State GDP YoY
- ▲ 1.84%
- F500 in state
- 20
Industry mix (Fortune 500 HQ in MO)
| Industry | F500 HQs | Revenue |
|---|---|---|
| Healthcare | 1 | $163B |
|
||
| Insurance | 1 | $21B |
|
||
| Industrial Technology | 1 | $17B |
|
||
| Retail | 1 | $16B |
|
||
| Industrial Distribution | 1 | $10B |
|
||
| Utilities | 1 | $9B |
|
||
Price history
+44.7% since first listed13 events — show timeline
- 2026-06-15 Listed $82,500 Heartland MLS as Distributed by MLS Grid
- 2026-06-15 Coming Soon $82,500 Heartland MLS as Distributed by MLS Grid
- 2008-01-03 Sold (Public Records) — Public Records
- 2008-01-02 Sold (MLS) — Heartland MLS as Distributed by MLS Grid
- 2007-11-14 Listed $79,500 Heartland MLS as Distributed by MLS Grid
- 2007-06-04 Sold (MLS) — Heartland MLS as Distributed by MLS Grid
- 2007-02-16 Listed $37,600 Heartland MLS as Distributed by MLS Grid
- 2006-04-07 Listed $62,000 Heartland MLS as Distributed by MLS Grid
- 2003-11-13 Sold (Public Records) — Public Records
- 2003-11-11 Sold (MLS) — Heartland MLS as Distributed by MLS Grid
- 2003-11-10 Sold (MLS) — Heartland MLS as Distributed by MLS Grid
- 2003-05-06 Listed $57,000 Heartland MLS as Distributed by MLS Grid
- 2003-05-06 Listed $57,000 Heartland MLS as Distributed by MLS Grid
Property tax history
+1.5%/yrLatest (2025): $643 · +5.9% YoY. Source: county tax records.
Cash-flow waterfall
monthlySold comps — $/sqft
last 12 mo · ≤1 miLoading sold comps…