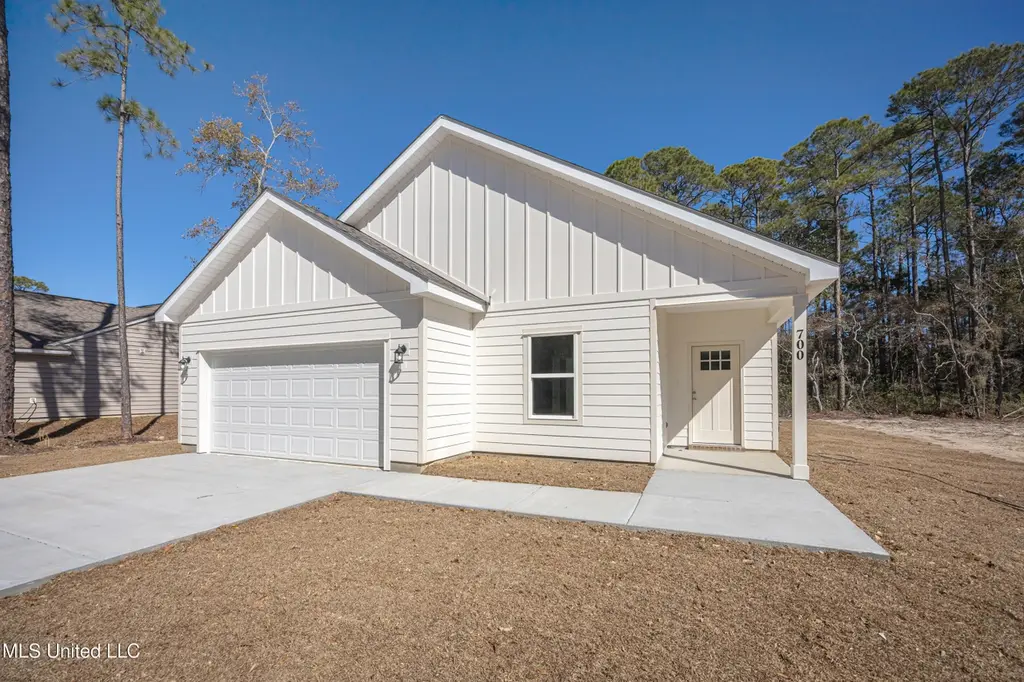
700 Peach St · Gautier, MS
Flood risk 5/10 · Moderate
- FEMA flood zone
- X (shaded)
- Chance of flooding over 30 yrs
- 0.23%
- Est. flood insurance / yr
- $507 – $1,088
Fire risk 4/10 · Minor
- Est. fire insurance / yr
- $1,241 – $2,305
Heat risk 10/10 · Severe
- Hot days now (above 105°F)
- 7 days/yr
- Hot days in 30 yrs
- 23 days/yr
Wind risk 9/10 · Severe
- Chance of severe wind over 30 yrs
- 99.0%
Air-quality risk 2/10 · Minimal
- Unhealthy air days now
- 1 days/yr
- Unhealthy air days in 30 yrs
- 2 days/yr
Risk factors via First Street. Map © Google.
Why this score? — see what drove the F grade
The composite is a weighted blend of 9 inputs, each scored 0–100. Each bar is that input's sub-score; the figure is the points it added to the 100-point composite (weight × sub-score).
- Cash flow +7.8/30.0
- ARV discount +5.4/15.0
- Schools +5.3/10.0
- Livability +3.3/5.0
- Rent growth +2.8/5.0
- Condition / age +2.5/5.0
- 1% rule +2.3/10.0
- DSCR +1.9/10.0
- Appreciation +0.0/10.0
$269,975
🖨 Deal sheet 📄 Offer letter ✓ Due diligence
Listing remarks MLS
New Construction,100% Complete and Move in ready. NOT IN A FLOOD ZONE. Open floor plan. 3br 2ba, double garage, Stainless Appliances, Wood look tile flooring, Granite countertops. This home is in the Ocean Springs School District. Qualifies for USDA 100% Financing. Call now to schedule a showing.
Key facts
- Open floor plan
- New construction
- Stainless appliances
Tags
Neighborhood map
What this means for you Summary
Snapshot
- This is a 3-bed/2.0-bath land listed at $270k.
Deal economics
- At list price, monthly cash flow is $-303 ($-4k/yr) — negative.
- To cash-flow at today's rent, offer at most $226k (16.2% below list).
- To meet the 1% rule (rent ≥ 1% of price), the offer needs to be $198k (26.7% below list).
- Recommended offer: $198k (26.7% below list) — sets the bar for 1% rule.
Location & tenants
- Location reads 66/100 on livability (#89 in MS) — a middle-class / working-renter tenant base. Strengths: cost of living A+, housing A+; Watch: health & safety D+, schools D, employment D.
- Ocean Springs School District (suburban): math 64% / reading 59% proficiency, ranked #1 of 130 in MS (top 1%) — acceptable for families but not a draw, mixed tenant base, ~2y average lease.
- Market conditions: Rents rising (+1.3%/yr); 714 active listings in the ZIP; 6 comparable units currently listed for rent nearby; rentals leasing fast (median 14d on market — plan ~1-2 weeks tenant-placement turnaround); solid renter incomes; 516 units permitted in Jackson County in 2024 (6 in 5+ unit buildings).
- This rent runs 30% of the median local income ($79k/yr) — at the standard rent-burdened threshold; future hikes will face affordability resistance.
Forward outlook
- Local home prices are declining (-3.0%/yr); year-one equity from $2k of loan paydown is wiped out by about $8k of value loss. Plan a longer hold.
Negotiation context
- It's been on market 99 days — a 9% lower offer ($246k) is reasonable based on typical stale-listing flexibility.
- 2 sale attempts with the ask held roughly flat each time — persistent listings suggest the price (not the market) is what's stuck; bring a comps-based counter.
Risks & watch-outs
- Climate carrying-cost: moderate flood risk; severe wind risk, 99% chance of damaging wind over 30y; extreme-heat days projected 7→23/yr by 2055 (HVAC capex compounding) — expect insurance premiums to compound above CPI over the hold.
Questions for the listing agent
- What do current leases actually rent for vs. the listed asking? Can we see a recent rent roll and the last 12 months of T-12 income?
- It's been on market 99 days. Have you received any prior offers? Is the seller open to a 27% concession, seller financing, or rate buy-down credit?
- Why hasn't it sold? Are there any deal-killer items the seller is aware of (foundation, flood, title, zoning, code violations)?
- Is there a deadline driving the sale (1031 exchange, divorce, estate, relocation)? That informs how much negotiation room exists.
- Schools are D-rated, which usually means shorter tenancies and higher turnover. Who's the typical renter profile here, and what's been the actual vacancy rate?
- The area grade is low — what's the realistic commute time and amenity access for the typical tenant pool here? Any planned neighborhood developments (good or bad) we should know about?
- What's the average days-on-market for RENTAL listings here right now (not sales)? A rising rental-DOM trend means longer vacancies and softer asking-rent achievability than the comps imply.
- What's the recent tenant-quality profile in this submarket — average credit score on applications, eviction rate, late-payment / NSF rate, and stable-employment percentage? A property-management company in the area should have these aggregated.
- How much new for-sale + rental construction is in the pipeline within 1–3 miles? Heavy new supply typically softens prices + rents 12–24 months out; constrained supply supports both.
Investment metrics
- 1% rule
- 0.73% ✗
- Cap rate
- 4.95%
- Cash-on-cash
- -4.80%
- DSCR
- 0.79
- GRM
- 11.4
CMA / ARV
- ARV (median comp)
- $258,161
- List price
- $269,975
- Delta
- 4.58%
- Verdict
- FAIR
- Comps
- 20 within 1.0 mi
Projected returns pro-forma
-3.0% appreciation · 1.31% rent growth · sell at horizon
- IRR
- -26.3%
- Equity multiple
- 0.12×
- Total profit
- $-66,303
- Equity at exit
- $40,254
- IRR
- -30.0%
- Equity multiple
- -0.26×
- Total profit
- $-95,559
- Equity at exit
- $23,343
Cash invested: $75,593 (down + closing). Projections, not guarantees.
Landlord ↔ Tenant lean methodology
- Overall (STATE)
- 90 Strongly Landlord-Friendly
- State Mississippi
- 90 Strongly Landlord-Friendly · R+11
- County
- — inherits STATE
- City
- — inherits STATE
ZIP-level market 39564
- Home prices YoY
- -26.8%
- Rents YoY
- 1.3%
- Active inventory
- 714
- Price-to-rent
- 11.4×
Monthly cashflow live
- Estimated rent
- $1,979 high interval (Pro) →
- Mortgage (P&I)
- −$1,416
- Tax est. 1.5%
- −$337 /mo · $4,050/yr
- Insurance
- −$112
- HOA
- −$0
- Vacancy / Maint / Mgmt
- −$416
- Net cashflow
- $-303
Break-even live
UW: 25.0% down · 7.5% · 30yr · 1.5% tax · 5.0% vac · 8.0% maint · 8.0% mgmt
Financing live
Cash to close
- Down payment
- $67,494
- Closing costs
- $8,099
- Reserves months
- —
- Total cash needed
- —
Loan-product check · same deal, 3 products live
Conventional
25% down · 7.5% · 30yr
- Down + closing
- —
- Monthly P&I
- —
- Monthly cashflow
- —
- DSCR
- —
- Eligible?
- —
Personal DTI + credit; lowest rate.
DSCR
20% down · 8.5% · 30yr
- Down + closing
- —
- Monthly P&I
- —
- Monthly cashflow
- —
- DSCR
- —
- Eligible?
- —
No personal income docs; deal must DSCR.
Hard money
10% down · 12.0% · 12mo
- Down + closing
- —
- Monthly P&I
- —
- Monthly cashflow
- —
- DSCR
- —
- Eligible?
- —
Short-term bridge; refi at stabilization.
Rent comps 6 comps
| Address | Beds | Baths | Sqft | Rent | $/sqft | DOM | Units | Dist |
|---|---|---|---|---|---|---|---|---|
| 1105 Spruce St Ocean Springs, MS | 3.0 | 2.0 | 1130 | $1,550 | $1.37 | 13d | 1 | 0.63mi |
| 1608 Hunt St Ocean Springs, MS | 3.0 | 2.0 | 1550 | $1,700 | $1.10 | 43d | 1 | 1.10mi |
| 62 Tantallon Dr Ocean Springs, MS | 4.0 | 2.0 | 1966 | $2,450 | $1.25 | 13d | 1 | 1.16mi |
| 413 Sturnidae Cv Ocean Springs, MS | 3.0 | 2.0 | 1676 | $1,900 | $1.13 | 44d | 1 | 1.19mi |
| 6717 Belle Fontaine Dr Unit 1032111P Ocean Springs, MS | 3.0 | 3.0 | 1991 | $7,902 | $3.97 | 13d | 1 | 1.21mi |
| 4304 Beach Blvd Ocean Springs, MS | 2.0 | 1.0 | 1200 | $2,200 | $1.83 | 13d | 1 | 1.42mi |
Listing history 7 events
-
2026-05-07price $269,975 298-char remark
Show marketing remark (298 chars)
New Construction,100% Complete and Move in ready. NOT IN A FLOOD ZONE. Open floor plan. 3br 2ba, double garage, Stainless Appliances, Wood look tile flooring, Granite countertops. This home is in the Ocean Springs School District. Qualifies for USDA 100% Financing. Call now to schedule a showing.
-
2026-04-20price $274,975 298-char remark
Show marketing remark (298 chars)
New Construction,100% Complete and Move in ready. NOT IN A FLOOD ZONE. Open floor plan. 3br 2ba, double garage, Stainless Appliances, Wood look tile flooring, Granite countertops. This home is in the Ocean Springs School District. Qualifies for USDA 100% Financing. Call now to schedule a showing.
-
2026-02-18$277,775 Active 298-char remark
Show marketing remark (298 chars)
New Construction,100% Complete and Move in ready. NOT IN A FLOOD ZONE. Open floor plan. 3br 2ba, double garage, Stainless Appliances, Wood look tile flooring, Granite countertops. This home is in the Ocean Springs School District. Qualifies for USDA 100% Financing. Call now to schedule a showing.
-
2026-02-16historical
-
2025-10-14$279,975 Active
-
2024-09-23soldstatus
-
2023-04-26soldstatus
ⓘ Source: listings_history table (triggers on properties + properties_extension) + one-shot
backfill from property_details.listing_events for pre-trigger history.
Climate risk First Street
- Flood 5/10 Major FEMA zone X (shaded) · 23% chance over 30 yrs
- Wildfire 4/10 Moderate
- Heat 10/10 Extreme 7 d/yr ≥105°F today · 23 d/yr by 30 yrs out
- Wind 9/10 Extreme 99% chance of damaging wind over 30 yrs
- Air quality 2/10 Low 1 unhealthy d/yr today · 2 by 30 yrs out
Nearby sold comps map
Loading sold comps map…
Walkable amenities ~0.75 mi
Loading nearby amenities…
Taxation est. · year 1
- Rental income
- $23,743
- − Mortgage interest
- −$15,123
- − Property taxes
- −$4,050
- − Insurance
- −$1,350
- − Repairs & maintenance
- −$1,899
- − Management
- −$1,899
- − Depreciation
- −$7,854
- Taxable loss
- −$8,432
- Est. tax savings @ 24.0%
- +$2,024
- After-tax cash flow
- $-1,608/yr
For passive investors: Depreciation is non-cash, so a rental often shows a tax loss while cash-flowing — sheltering income. Rental losses are passive: they offset passive income freely, and up to $25,000/yr can offset ordinary (W-2) income if you actively participate and your MAGI is under $100k (phasing out to $0 by $150k); unused losses carry forward. On sale, claimed depreciation is recaptured at up to 25%, and gains may owe capital-gains tax (a 1031 exchange can defer both). Figures are a year-1 estimate at your 24.0% rate — not tax advice; consult a CPA.
Schools (NCES district)
- District
- Ocean Springs School District
- NCES district ID
- 2803360
- Math proficiency
- 64% ▼ -3.00%
- Reading proficiency
- 59% ▲ 1.00%
- Median HH income
- $60,485
- Composite
- 53.35/100
- National rank
- #1477
- State rank
- #1 of 130 in MS
Livability — Gautier
- Score
- 66/100
- State rank
- #89
- US rank
- #11250
Category grades
Schools grade is shown separately in the Schools card above.
Census & demographics
- County
- Jackson County · 82,196 people
- City population
- 17,225
- Metro
- Gulfport-Biloxi, MS
- Population (ZIP)
- 43,240
- Household income
- $78,596
- Rent vs Own
- Severe rent burden
- 734.0
Population outlook (Jackson County) Hauer SSP2
- Today (2025)
- 146,926 people
- By 2030
- 148,442 · +1.0%
- By 2040
- 149,631 · +1.8%
- By 2050
- 148,723 · +1.2%
- By 2075
- 147,845 · +0.6%
- By 2100
- 144,510 · -1.6%
Race, ethnicity, and origin ACS 2023
- Neighborhood character
- Predominantly White (74%)
- Race & ethnicity
- White 74% Black 10% Hispanic / Latino 8% Two or more races 7% Asian 4%
- Hispanic origin (detail)
- Mexican 3% Puerto Rican 2%
- Common ancestry
- Lithuanian 5% Slovak 4% Romanian 2%
- Foreign-born
- 5% · Canada, South Korea, Vietnam
- Languages at home
- 93% English-only · Spanish 3% Vietnamese 2% Tagalog/Filipino 1%
Political lean MEDSL · Jackson
- 2024 margin
- Solid R (+39.9) · D 29.5% · R 69.4% · Other 1.1%
- 2008→2024 swing
- -6.4pp toward R · 2008: -33.5pp · 2024: -39.9pp
- All cycles
- 2024: R+39.9 2020: R+34.6 2016: R+39.9 2012: R+36.1 2008: R+33.5
Not yet ingested
- Civics
- —
Market trends
- HPI YoY
- ▼ -74.77%
- Current HPI
- 204.2244
- Rent YoY
- ▲ 1.31%
- Metro
- Gulfport-Biloxi, MS
- State GDP YoY
- —
- F500 in state
- 0
Price history
-3.6% since first listed7 events — show timeline
- 2026-05-07 Price Changed $269,975 MLSU
- 2026-04-20 Price Changed $274,975 MLSU
- 2026-02-18 Listed $277,775 MLSU
- 2026-02-16 Listing Removed — MLSU
- 2025-10-14 Listed $279,975 MLSU
- 2024-09-23 Sold (Public Records) — Public Records
- 2023-04-26 Sold (Public Records) — Public Records
Property tax history
+1.7%/yrLatest (2025): $87 · +3.2% YoY. Source: county tax records.
Cash-flow waterfall
monthlySold comps — $/sqft
last 12 mo · ≤1 miLoading sold comps…