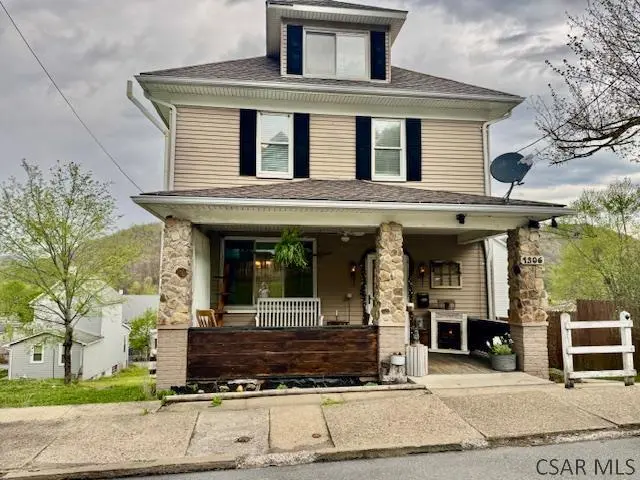
1306 Maryland Ave · Johnstown, PA
Flood risk 1/10 · Minimal
- FEMA flood zone
- X (unshaded)
- Chance of flooding over 30 yrs
- 0.0%
- Est. flood insurance / yr
- $473 – $860
Fire risk 1/10 · Minimal
- Est. fire insurance / yr
- $511 – $949
Heat risk 3/10 · Minor
- Hot days now (above 96°F)
- 7 days/yr
- Hot days in 30 yrs
- 19 days/yr
Wind risk 2/10 · Minimal
- Chance of severe wind over 30 yrs
- —
Air-quality risk 2/10 · Minimal
- Unhealthy air days now
- 1 days/yr
- Unhealthy air days in 30 yrs
- 2 days/yr
Risk factors via First Street. Map © Google.
Why this score? — see what drove the D+ grade
The composite is a weighted blend of 9 inputs, each scored 0–100. Each bar is that input's sub-score; the figure is the points it added to the 100-point composite (weight × sub-score).
- Cash flow +22.0/30.0
- DSCR +7.1/10.0
- 1% rule +5.6/10.0
- Livability +3.9/5.0
- Appreciation +3.4/10.0
- Rent growth +2.5/5.0
- Condition / age +2.5/5.0
- Schools +1.3/10.0
- ARV discount +0.0/15.0
$84,900
🖨 Deal sheet 📄 Offer letter ✓ Due diligence
Listing remarks MLS
Nicely updated 3 bedroom 2 story with spectacular kitchen! GOTTA SEE INSIDE! 2 car detached garage + carport at rear of property.
Key facts
- Finished basement
- Gas insert fireplace
- Pool
Tags
Property features AI
Exterior
- Parking: Detached garage; 2 garage spaces; On-street parking
- Utilities: Public water; Public sewer; Sewer available
- Home design: Single family residence; Two levels / 2 stories; Residential zoning
- Construction: Aluminum siding; Vinyl siding; Shingle roof
- Exterior features: Deck; Porch; Above-ground private pool; Public-maintained road frontage on a city street
Interior
- Kitchen: Dishwasher; Microwave; Range; Oven; Refrigerator
- Flooring: Ceramic tile; Hardwood; Vinyl; Wood
- Bathrooms: 2 full bathrooms
- Heating & cooling: Hot water heating; Natural gas
- Interior features: High-speed internet; Gas fireplace (1)
- Laundry & utility: Laundry in basement; Full, partially finished basement
Neighborhood map
What this means for you Summary
Snapshot
- This is a 3-bed/2.0-bath single-family listed at $85k.
Deal economics
- At list price, monthly cash flow is $136 ($2k/yr) — positive.
- The deal already cash-flows at list — no discount required.
- Meets the 1% rule at list price ($900 rent vs $85k).
- Cap rate 8.2% vs local median 15.0% in Johnstown — below-typical yield; the buyer is paying a premium for something (appreciation thesis, condition, location) that the cap rate doesn't capture.
Location & tenants
- Location reads 77/100 on livability (#363 in PA, #3,168 nationally) — a middle-class / working-renter tenant base. Strengths: amenities A+, commute A+, cost of living A+; Watch: schools D+, crime F, employment F.
- Greater Johnstown SD (urban): math 9% / reading 25% proficiency, ranked #509 of 539 in PA (top 94%) — low school quality limits family demand, transient renter base, plan for 1-2y turnover; 80% free/reduced lunch — lower-income household profile, screen leases tightly.
- Market conditions: 47 active listings in the ZIP; 1 comparable units currently listed for rent nearby; 64 units permitted in Cambria County in 2024 (0 in 5+ unit buildings).
Forward outlook
- Local home prices are declining (-3.0%/yr); year-one equity from $587 of loan paydown is wiped out by about $3k of value loss. Plan a longer hold.
- Cambria County population projected at -28% by 2050 — secular population decline; favor cash flow + early exit over multi-decade hold.
Negotiation context
- Only 9 days on market — expect competitive offers; lowballing is unlikely to land.
- 3 sale attempts since 27y ago with the ask held roughly flat each time — persistent listings suggest the price (not the market) is what's stuck; bring a comps-based counter.
- Current owner paid $52k; list at $85k implies a 65% gain — meaningful room to come down on a strong offer.
Risks & watch-outs
- Watch-outs: built in 1926 — expect roof / HVAC / electrical / plumbing capex.
Questions for the listing agent
- Built in 1926 — when were the roof, HVAC, electrical panel, plumbing, and water heater last replaced?
- Is there a deadline driving the sale (1031 exchange, divorce, estate, relocation)? That informs how much negotiation room exists.
- Schools are D-rated, which usually means shorter tenancies and higher turnover. Who's the typical renter profile here, and what's been the actual vacancy rate?
- Crime grade is F in this area — have there been break-ins, vandalism, or insurance claims at this property in the last 3 years? What carrier currently insures it and at what premium?
- The area grade is low — what's the realistic commute time and amenity access for the typical tenant pool here? Any planned neighborhood developments (good or bad) we should know about?
- What's the average days-on-market for RENTAL listings here right now (not sales)? A rising rental-DOM trend means longer vacancies and softer asking-rent achievability than the comps imply.
- What's the recent tenant-quality profile in this submarket — average credit score on applications, eviction rate, late-payment / NSF rate, and stable-employment percentage? A property-management company in the area should have these aggregated.
- How much new for-sale + rental construction is in the pipeline within 1–3 miles? Heavy new supply typically softens prices + rents 12–24 months out; constrained supply supports both.
Investment metrics
- 1% rule
- 1.06% ✓
- Cap rate
- 8.21%
- Cash-on-cash
- 6.86%
- DSCR
- 1.31
- GRM
- 7.9
CMA / ARV
- ARV (on-the-fly)
- $68,016
- Comps found
- 12
Show comp detail 12 sales within ~0.75 mi
| Address | Dist | Beds/Ba | Sqft | Sold | Price | $/sf | Match |
|---|---|---|---|---|---|---|---|
| 112 Delaware Ave | 0.08mi | 3/1.5 | 1,643 (-6%) | 11mo | $64,900 | $40 | 76 |
| 225 Barron Ave | 0.42mi | 3/2.0 | 1,680 (-4%) | 7mo | $89,900 | $54 | 68 |
| 353 Habicht St | 0.56mi | 3/1.5 | 1,856 (+6%) | 2mo | $55,000 | $30 | 60 |
| 129 J St | 0.44mi | 3/1.5 | 1,648 (-6%) | 11mo | $42,000 | $25 | 59 |
| 820 Virginia Ave | 0.31mi | 4/2.0 (+1) | 1,540 (-12%) | 8mo | $60,000 | $39 | 54 |
| 203 Fairfield Ave | 0.40mi | 4/3.5 (+1) | 1,846 (+6%) | 8mo | $95,000 | $51 | 54 |
| 148 Glenn St | 0.73mi | 3/1.5 | 1,658 (-5%) | 7mo | $96,000 | $58 | 50 |
| 219 Strayer St | 0.69mi | 3/1.5 | 1,580 (-9%) | 0mo | $34,000 | $22 | 50 |
| 124 Bheam Ave | 0.43mi | 3/1.5 | 1,506 (-14%) | 8mo | $42,000 | $28 | 48 |
| 67 Flora St | 0.37mi | 3/1.5 | 1,532 (-12%) | 16mo | $90,000 | $59 | 47 |
| 232 Grape Ave | 0.63mi | 3/1.0 | 1,584 (-9%) | 8mo | $57,655 | $36 | 45 |
| 204 Strayer St | 0.66mi | 2/2.0 (-1) | 1,536 (-12%) | 1mo | $60,000 | $39 | 44 |
Match score weights: distance 35% · size 25% · config 20% · recency 20%. Top-matched comps best support the ARV.
Projected returns pro-forma
-3.0% appreciation · 3.0% rent growth · sell at horizon
- IRR
- -5.8%
- Equity multiple
- 0.79×
- Total profit
- $-5,098
- Equity at exit
- $12,659
- IRR
- 3.9%
- Equity multiple
- 1.28×
- Total profit
- $6,730
- Equity at exit
- $7,341
Cash invested: $23,772 (down + closing). Projections, not guarantees.
Landlord ↔ Tenant lean methodology
- Overall (STATE)
- 62 Landlord-Friendly
- State Pennsylvania
- 62 Landlord-Friendly · EVEN
- County
- — inherits STATE
- City
- — inherits STATE
ZIP-level market 15906
- Home prices YoY
- -4.0%
- Active inventory
- 47
- Price-to-rent
- 7.9×
Monthly cashflow live
- Estimated rent
- $900 medium interval (Pro) →
- Mortgage (P&I)
- −$445
- Tax from tax record
- −$95 /mo · $1,134/yr
- Insurance
- −$35
- HOA
- −$0
- Vacancy / Maint / Mgmt
- −$189
- Net cashflow
- $136
Break-even live
UW: 25.0% down · 7.5% · 30yr · 1.5% tax · 5.0% vac · 8.0% maint · 8.0% mgmt
Financing live
Cash to close
- Down payment
- $21,225
- Closing costs
- $2,547
- Reserves months
- —
- Total cash needed
- —
Loan-product check · same deal, 3 products live
Conventional
25% down · 7.5% · 30yr
- Down + closing
- —
- Monthly P&I
- —
- Monthly cashflow
- —
- DSCR
- —
- Eligible?
- —
Personal DTI + credit; lowest rate.
DSCR
20% down · 8.5% · 30yr
- Down + closing
- —
- Monthly P&I
- —
- Monthly cashflow
- —
- DSCR
- —
- Eligible?
- —
No personal income docs; deal must DSCR.
Hard money
10% down · 12.0% · 12mo
- Down + closing
- —
- Monthly P&I
- —
- Monthly cashflow
- —
- DSCR
- —
- Eligible?
- —
Short-term bridge; refi at stabilization.
Rent comps 1 comps
| Address | Beds | Baths | Sqft | Rent | $/sqft | DOM | Units | Dist |
|---|---|---|---|---|---|---|---|---|
| 459 Stone St Johnstown, PA | 3.0 | 1.0 | 1120 | $900 | $0.80 | 23d | 1 | 0.86mi |
Listing history 11 events
-
2026-04-29status Pending
-
2026-04-26historical Active Under Contract
-
2026-04-20$84,900 Active
-
2003-03-18soldstatus $51,600 132-char remark
Show marketing remark (132 chars)
Nicely updated 3 bedroom 2 story with spectacular kitchen! GOTTA SEE INSIDE! 2 car detached garage + carport at rear of property.
-
2003-03-17soldstatus $51,600
-
2002-09-16$52,900 132-char remark
Show marketing remark (132 chars)
Nicely updated 3 bedroom 2 story with spectacular kitchen! GOTTA SEE INSIDE! 2 car detached garage + carport at rear of property.
-
1999-05-27soldstatus $47,500 158-char remark
Show marketing remark (158 chars)
Outstanding interior! Beautiful oak kitchen w/ ceramic flooring, large deck w/ built-in benches. 2nd bathroom in bsmt. is new, however, sink never installed.
-
1999-05-24soldstatus $47,500
-
1999-01-26$49,900 158-char remark
Show marketing remark (158 chars)
Outstanding interior! Beautiful oak kitchen w/ ceramic flooring, large deck w/ built-in benches. 2nd bathroom in bsmt. is new, however, sink never installed.
-
1996-08-01soldstatus $49,000
-
1986-10-01soldstatus $26,000
ⓘ Source: listings_history table (triggers on properties + properties_extension) + one-shot
backfill from property_details.listing_events for pre-trigger history.
Tax reassessment forecast PA · Partial reset (capped growth)
- Current annual tax
- $1,134 · $95/mo
- Projected year-2 tax
- $1,238 · $103/mo
- Expected delta
- +$104/yr (+$9/mo · 9.1%)
ⓘ Screening estimate from a state-policy table — verify with the county assessor before closing.
Climate risk First Street
- Flood 1/10 Low FEMA zone X (unshaded) · 0% chance over 30 yrs
- Wildfire 1/10 Low
- Heat 3/10 Moderate 7 d/yr ≥96°F today · 19 d/yr by 30 yrs out
- Wind 2/10 Low
- Air quality 2/10 Low 1 unhealthy d/yr today · 2 by 30 yrs out
Nearby sold comps map
Loading sold comps map…
Walkable amenities ~0.75 mi
Loading nearby amenities…
Taxation est. · year 1
- Rental income
- $10,800
- − Mortgage interest
- −$4,756
- − Property taxes
- −$1,134
- − Insurance
- −$424
- − Repairs & maintenance
- −$864
- − Management
- −$864
- − Depreciation
- −$2,470
- Taxable income
- $288
- Est. tax owed @ 24.0%
- −$69
- After-tax cash flow
- $1,561/yr
For passive investors: Depreciation is non-cash, so a rental often shows a tax loss while cash-flowing — sheltering income. Rental losses are passive: they offset passive income freely, and up to $25,000/yr can offset ordinary (W-2) income if you actively participate and your MAGI is under $100k (phasing out to $0 by $150k); unused losses carry forward. On sale, claimed depreciation is recaptured at up to 25%, and gains may owe capital-gains tax (a 1031 exchange can defer both). Figures are a year-1 estimate at your 24.0% rate — not tax advice; consult a CPA.
Schools (NCES district)
- District
- Greater Johnstown SD
- NCES district ID
- 4210950
- Math proficiency
- 9% ▼ -6.00%
- Reading proficiency
- 25% ▼ -6.00%
- Median HH income
- $27,890
- Composite
- 13.25/100
- National rank
- #9550
- State rank
- #509 of 539 in PA
Livability — Johnstown
- Score
- 77/100
- State rank
- #363
- US rank
- #3168
Category grades
Schools grade is shown separately in the Schools card above.
Census & demographics
- Census place
- Johnstown, PA
- City population
- 30,791
- Population (ZIP)
- 9,654
Population outlook (Cambria County) Hauer SSP2
- Today (2025)
- 122,754 people
- By 2030
- 115,827 · -5.6%
- By 2040
- 101,309 · -17.5%
- By 2050
- 88,379 · -28.0%
- By 2075
- 65,237 · -46.9%
- By 2100
- 46,909 · -61.8%
Race, ethnicity, and origin ACS 2023
- Neighborhood character
- Predominantly White (79%)
- Race & ethnicity
- White 79% Black 11% Two or more races 7% Hispanic / Latino 3%
- Common ancestry
- Romanian 8% Polish 2% Slovak 2%
- Foreign-born
- 1% · Canada
- Languages at home
- 98% English-only · Spanish 1%
Political lean MEDSL · Cambria
- 2024 margin
- Solid R (+39.7) · D 29.8% · R 69.5%
- 2008→2024 swing
- -40.4pp toward R · 2008: 0.7pp · 2024: -39.7pp
- All cycles
- 2024: R+39.7 2020: R+37.3 2016: R+37.8 2012: R+17.8 2008: D+0.7
Not yet ingested
- Civics
- —
Market trends
- HPI YoY
- ▼ -3.26%
- Current HPI
- 77.6797
- Rent YoY
- —
- Metro
- —
- State GDP YoY
- ▲ 1.68%
- F500 in state
- 34
Industry mix (Fortune 500 HQ in PA)
| Industry | F500 HQs | Revenue |
|---|---|---|
| Healthcare | 2 | $309B |
|
||
| Insurance | 2 | $27B |
|
||
| Telecommunications / Media | 1 | $124B |
|
||
| Industrial Distribution | 1 | $22B |
|
||
| Financial Services | 1 | $20B |
|
||
| Chemicals / Materials | 1 | $18B |
|
||
Price history
+226.5% since first listed11 events — show timeline
- 2026-04-29 Pending — CSMLS
- 2026-04-26 Contingent — CSMLS
- 2026-04-20 Listed $84,900 CSMLS
- 2003-03-18 Sold (MLS) $51,600 CSMLS
- 2003-03-17 Sold (Public Records) $51,600 Public Records
- 2002-09-16 Listed $52,900 CSMLS
- 1999-05-27 Sold (MLS) $47,500 CSMLS
- 1999-05-24 Sold (Public Records) $47,500 Public Records
- 1999-01-26 Listed $49,900 CSMLS
- 1996-08-01 Sold (Public Records) $49,000 Public Records
- 1986-10-01 Sold (Public Records) $26,000 Public Records
Property tax history
+0.2%/yrLatest (2026): $1,134 · +0.0% YoY. Source: county tax records.
Cash-flow waterfall
monthlySold comps — $/sqft
last 12 mo · ≤1 miLoading sold comps…