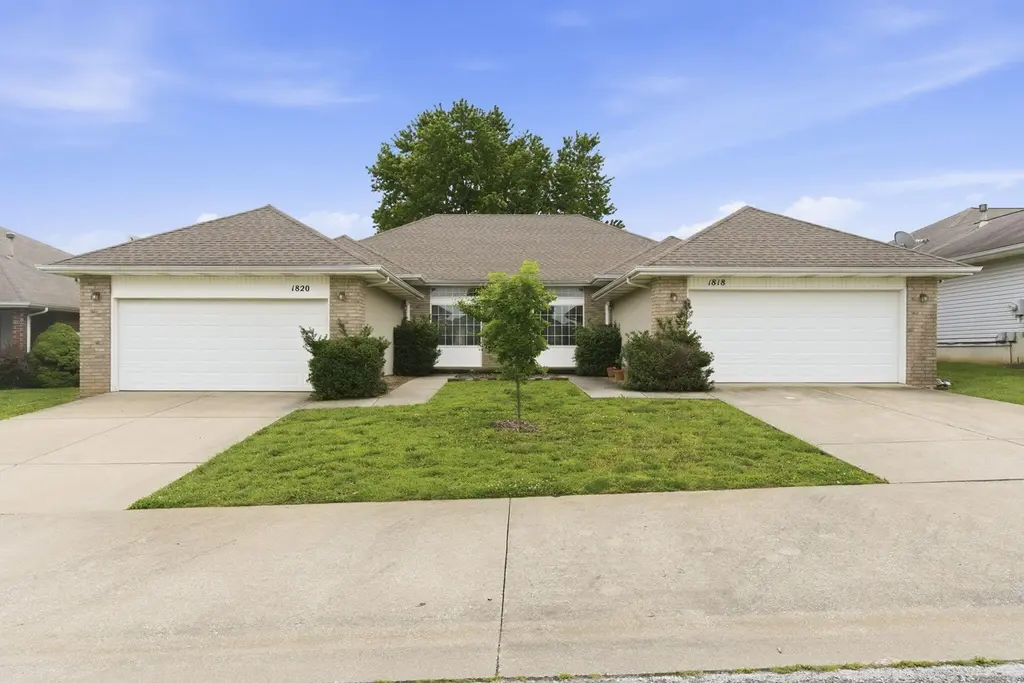
 Duplex
1818-1820 Cedarcrest Ave · Nixa, MO
Flood risk 1/10 · Minimal
- FEMA flood zone
- X (unshaded)
- Chance of flooding over 30 yrs
- 0.0%
- Est. flood insurance / yr
- $473 – $860
Fire risk 4/10 · Minor
- Est. fire insurance / yr
- $1,054 – $1,958
Heat risk 5/10 · Moderate
- Hot days now (above 104°F)
- 7 days/yr
- Hot days in 30 yrs
- 19 days/yr
Wind risk 2/10 · Minimal
- Chance of severe wind over 30 yrs
- 0.0%
Air-quality risk 1/10 · Minimal
- Unhealthy air days now
- 0 days/yr
- Unhealthy air days in 30 yrs
- 0 days/yr
Risk factors via First Street. Map © Google.
Why this score? — see what drove the D- grade
The composite is a weighted blend of 9 inputs, each scored 0–100. Each bar is that input's sub-score; the figure is the points it added to the 100-point composite (weight × sub-score).
- Cash flow +13.1/30.0
- Schools +5.6/10.0
- DSCR +3.9/10.0
- Rent growth +3.9/5.0
- Livability +3.7/5.0
- 1% rule +2.8/10.0
- Condition / age +2.5/5.0
- ARV discount +0.0/15.0
- Appreciation +0.0/10.0
$350,000
🖨 Deal sheet (PDF) 📄 Offer letter ✓ Due diligence
Multi-family units
County records classify this as Multi-Family (2-4 Unit). Listing-text estimate: 2 units. confirmed
Listing remarks
Welcome to this well maintained duplex in Nixa offering a great opportunity for investors or owner occupants alike. Each side features 2 bedrooms, 2 bathrooms, and a flexible bonus room that could serve as a second living area, office, or hobby space. These thoughtfully maintained units include granite countertops, stainless steel appliances, and subway tile backsplashes for a clean and modern feel. The spacious primary bedroom offers a large walk-in closet and private attached bathroom with a walk-in shower, while the second bedroom also includes a walk-in closet. A hall bathroom with shower tub combo and convenient laundry closet add to the functional layout. Each side enjoys a private pa
Key facts
- Flexible bonus room
- Large walk-in closet
- Granite countertops
Tags
Property features AI
Finance
- Other: Lot size approximately 0.23 acres
Exterior
- Parking: Attached garage; 4 garage spaces
- Utilities: Public water; Electricity available; Water available; Sewer available; Natural gas available
- Home design: Duplex (residential income); Zoned R-1; Located in the Morris Corners subdivision
- Construction: Vinyl siding and brick exterior; Composition roof
- Exterior features: Balcony
Interior
- Kitchen: Range; Dishwasher; Refrigerator; Microwave
- Heating & cooling: Central heating; Central air
- Interior features: Ceiling fan(s); Balcony
Neighborhood map
What this means for you Summary
Snapshot
- This is a 2 × 2-bed/2-bath units multifamily listed at $350k.
Deal economics
- At list price, monthly cash flow is $-12 ($-146/yr) — negative. Per door: $-6/mo.
- To cash-flow at today's rent, offer at most $348k (0.6% below list).
- To meet the 1% rule (rent ≥ 1% of price), the offer needs to be $272k (22.3% below list).
- Recommended offer: $272k (22.3% below list) — sets the bar for 1% rule.
- Cap rate 6.3% vs local median 3.6% in Nixa — top-decile yield for the area; either an underpriced asset or a hidden risk that comps aren't pricing in. Stress-test before assuming the spread holds.
Location & tenants
- Location reads 74/100 on livability (#68 in MO, #4,558 nationally) — a middle-class / working-renter tenant base. Strengths: crime A+, cost of living A+, housing A+; Watch: amenities F, commute F, health & safety F.
- Nixa Public Schools (suburban): math 66% / reading 65% proficiency, ranked #6 of 324 in MO (top 2%) — acceptable for families but not a draw, mixed tenant base, ~2y average lease.
- Zoned schools: High Pointe Elem. (math 69% / reading 63%, grade B+, #60 of 1,115 statewide, top 5%, 619 students, 40% FRL); Nixa Junior High (math 70% / reading 61%, grade A-, #3 of 391 statewide, top 1%, 1,067 students, 29% FRL); Nixa High (math 70% / reading 77%, grade B+, #6 of 521 statewide, top 1%, 1,957 students, 24% FRL) — zoned schools at 31% FRL track the district average.
- Market conditions: Rents rising fast (+5.7%/yr); 400 active listings in the ZIP; 1 comparable units currently listed for rent nearby; solid renter incomes; 537 units permitted in Christian County in 2024 (0 in 5+ unit buildings).
- This rent runs 38% of the median local income ($87k/yr) — at the standard rent-burdened threshold; future hikes will face affordability resistance.
Forward outlook
- Local home prices are declining (-3.0%/yr); year-one equity from $2k of loan paydown is wiped out by about $10k of value loss. Plan a longer hold.
- Christian County population projected at +24% by 2050 — long-run rental-demand tailwind backs the buy-and-hold thesis.
Negotiation context
- Only 3 days on market — expect competitive offers; lowballing is unlikely to land.
- 2 sale attempts since 3y ago with the ask held roughly flat each time — persistent listings suggest the price (not the market) is what's stuck; bring a comps-based counter.
Risks & watch-outs
- Climate carrying-cost: extreme-heat days projected 7→19/yr by 2055 (HVAC capex compounding) — expect insurance premiums to compound above CPI over the hold.
Questions for the listing agent
- What do current leases actually rent for vs. the listed asking? Can we see a recent rent roll and the last 12 months of T-12 income?
- Can we see the unit-by-unit rent roll, current vacancy, and any below-market leases? What's the average tenancy length?
- What capital expenditures (roof, boiler, parking lot, exteriors) have been made in the last 5 years, and what's planned in the next 2?
- Is there a deadline driving the sale (1031 exchange, divorce, estate, relocation)? That informs how much negotiation room exists.
- Schools are B-rated — typically a magnet for longer-tenancy family renters. What's the average tenant stay here, and is there a school-zone premium baked into asking?
- The area grade is low — what's the realistic commute time and amenity access for the typical tenant pool here? Any planned neighborhood developments (good or bad) we should know about?
- What's the average days-on-market for RENTAL listings here right now (not sales)? A rising rental-DOM trend means longer vacancies and softer asking-rent achievability than the comps imply.
- What's the recent tenant-quality profile in this submarket — average credit score on applications, eviction rate, late-payment / NSF rate, and stable-employment percentage? A property-management company in the area should have these aggregated.
- How much new apartment / multifamily construction is in the pipeline within 1–3 miles? Heavy new supply (>2% of stock underway) typically softens rents 12–24 months out; light construction supports rent growth.
Investment metrics
- 1% rule
- 0.78% ✗
- Cap rate
- 6.25%
- Cash-on-cash
- -0.15%
- DSCR
- 0.99
- GRM
- 10.7
CMA / ARV
- ARV (on-the-fly)
- $296,037
- Comps found
- 2
Show comp detail 2 sales within ~0.75 mi
| Address | Dist | Beds/Ba | Sqft | Sold | Price | $/sf | Match |
|---|---|---|---|---|---|---|---|
| 1801 N 1803 N Laurel Hill Pl | 0.06mi | 4/4.0 | 2,764 (+4%) | 23mo | $295,000 | $107 | 72 |
| 1835-1837 N Plaza Dr | 0.20mi | 6/2.0 | 2,700 (+1%) | 24mo | $300,000 | $111 | 69 |
Match score weights: distance 35% · size 25% · config 20% · recency 20%. Top-matched comps best support the ARV.
Projected returns pro-forma
-3.0% appreciation · 5.67% rent growth · sell at horizon
- IRR
- -14.0%
- Equity multiple
- 0.49×
- Total profit
- $-50,114
- Equity at exit
- $52,186
- IRR
- -1.7%
- Equity multiple
- 0.87×
- Total profit
- $-12,625
- Equity at exit
- $30,262
Cash invested: $98,000 (down + closing). Projections, not guarantees.
Landlord ↔ Tenant lean methodology
- Overall (STATE)
- 81 Strongly Landlord-Friendly
- State Missouri
- 81 Strongly Landlord-Friendly · R+10
- County
- — inherits STATE
- City
- — inherits STATE
ZIP-level market 65714
- Home prices YoY
- -25.0%
- Rents YoY
- 5.7%
- Active inventory
- 400
- Price-to-rent
- 21.5×
Monthly cashflow live
- Estimated rent
- $2,718 high interval (Pro) →
- Mortgage (P&I)
- −$1,835
- Tax from tax record
- −$178 /mo · $2,138/yr
- Insurance
- −$146
- HOA
- −$0
- Vacancy / Maint / Mgmt
- −$571
- Net cashflow
- $-12
Break-even live
Sensitivity live
| Price | -10% $186 | -5% $87 | +0% $-12 | +5% $-111 | +10% $-210 |
|---|---|---|---|---|---|
| Rent | -10% $-227 | -5% $-120 | +0% $-12 | +5% $95 | +10% $203 |
| Rate | -1.0pp $164 | -0.5pp $77 | base $-12 | +0.5pp $-103 | +1.0pp $-195 |
2-unit breakdown (identical units grouped — click to expand)
| Units | Beds | Baths | Est. rent |
|---|---|---|---|
| 2× units | 2 | 2 | $2,718 |
| #1 | 2 | 2 | $1,359 |
| #2 | 2 | 2 | $1,359 |
| Total (2 units) | $2,718 | ||
UW: 25.0% down · 7.5% · 30yr · 1.5% tax · 5.0% vac · 8.0% maint · 8.0% mgmt
Financing live
Cash to close
- Down payment
- $87,500
- Closing costs
- $10,500
- Reserves months
- —
- Total cash needed
- —
Loan-product check · same deal, 3 products live
Conventional
25% down · 7.5% · 30yr
- Down + closing
- —
- Monthly P&I
- —
- Monthly cashflow
- —
- DSCR
- —
- Eligible?
- —
Personal DTI + credit; lowest rate.
DSCR
20% down · 8.5% · 30yr
- Down + closing
- —
- Monthly P&I
- —
- Monthly cashflow
- —
- DSCR
- —
- Eligible?
- —
No personal income docs; deal must DSCR.
Hard money
10% down · 12.0% · 12mo
- Down + closing
- —
- Monthly P&I
- —
- Monthly cashflow
- —
- DSCR
- —
- Eligible?
- —
Short-term bridge; refi at stabilization.
Rent comps 1 comps
| Address | Beds | Baths | Sqft | Rent | $/sqft | DOM | Units | Dist |
|---|---|---|---|---|---|---|---|---|
| 1116 N Arlington St Nixa, MO | 3.0 | 2.0 | 2226 | $2,100 | $0.94 | 15d | 1 | 1.43mi |
Listing history 5 events
-
2026-06-02status $350,000 Pending 3 DOM
-
2026-06-01days on market $350,000 Active 3 DOM
-
2026-05-31days on market $350,000 Active 2 DOM
-
2026-05-30remarks 699-char remark
-
2026-05-30$350,000 Active 1 DOM
ⓘ Source: listings_history table (triggers on properties + properties_extension) + one-shot
backfill from property_details.listing_events for pre-trigger history.
Tax reassessment forecast MO · Resets to sale price
- Current annual tax
- $2,138 · $178/mo
- Projected year-2 tax
- $3,395 · $283/mo
- Expected delta
- +$1,257/yr (+$105/mo · 58.8%)
ⓘ Screening estimate from a state-policy table — verify with the county assessor before closing.
Climate risk First Street
- Flood 1/10 Low FEMA zone X (unshaded) · 0% chance over 30 yrs
- Wildfire 4/10 Moderate
- Heat 5/10 Major 7 d/yr ≥104°F today · 19 d/yr by 30 yrs out
- Wind 2/10 Low 0% chance of damaging wind over 30 yrs
- Air quality 1/10 Low 0 unhealthy d/yr today · 0 by 30 yrs out
Nearby sold comps map
Loading sold comps map…
Walkable amenities ~0.75 mi
Loading nearby amenities…
Taxation est. · year 1
- Rental income
- $32,616
- − Mortgage interest
- −$19,605
- − Property taxes
- −$2,138
- − Insurance
- −$1,750
- − Repairs & maintenance
- −$2,609
- − Management
- −$2,609
- − Depreciation
- −$10,182
- Taxable loss
- −$6,278
- Est. tax savings @ 24.0%
- +$1,507
- After-tax cash flow
- $1,360/yr
For passive investors: Depreciation is non-cash, so a rental often shows a tax loss while cash-flowing — sheltering income. Rental losses are passive: they offset passive income freely, and up to $25,000/yr can offset ordinary (W-2) income if you actively participate and your MAGI is under $100k (phasing out to $0 by $150k); unused losses carry forward. On sale, claimed depreciation is recaptured at up to 25%, and gains may owe capital-gains tax (a 1031 exchange can defer both). Figures are a year-1 estimate at your 24.0% rate — not tax advice; consult a CPA.
Schools (NCES district)
- District
- Nixa Public Schools
- NCES district ID
- 2922530
- Math proficiency
- 66% ▲ 8.00%
- Reading proficiency
- 65% ▲ 4.00%
- Median HH income
- $54,073
- Composite
- 56.04/100
- National rank
- #1186
- State rank
- #6 of 324 in MO
Livability — Nixa
- Score
- 74/100
- State rank
- #68
- US rank
- #4558
Category grades
Schools grade is shown separately in the Schools card above.
Census & demographics
- County
- Christian County · 70,465 people
- City population
- 37,013
- Metro
- Springfield, MO
- Population (ZIP)
- 37,013
- Household income
- $86,765
- Rent vs Own
- Severe rent burden
- 769.0
Population outlook (Christian County) Hauer SSP2
- Today (2025)
- 95,071 people
- By 2030
- 100,379 · +5.6%
- By 2040
- 109,902 · +15.6%
- By 2050
- 117,487 · +23.6%
- By 2075
- 130,738 · +37.5%
- By 2100
- 131,730 · +38.6%
Race, ethnicity, and origin ACS 2023
- Neighborhood character
- Predominantly White (89%)
- Race & ethnicity
- White 89% Two or more races 4% Hispanic / Latino 4% Asian 2% Black 1%
- Common ancestry
- Italian 3% Slovak 3% Lithuanian 2%
- Foreign-born
- 4% · Canada, Vietnam
- Languages at home
- 94% English-only · Spanish 3% Russian/Polish/Slavic 2% Vietnamese 1%
Political lean MEDSL · Christian
- 2024 margin
- Solid R (+52.2) · D 23.3% · R 75.6% · Other 1.1%
- 2008→2024 swing
- -16.4pp toward R · 2008: -35.8pp · 2024: -52.2pp
- All cycles
- 2024: R+52.2 2020: R+50.8 2016: R+54.2 2012: R+46.5 2008: R+35.8
Not yet ingested
- Civics
- —
Market trends
- HPI YoY
- ▼ -71.42%
- Current HPI
- 213.8371
- Rent YoY
- ▲ 5.67%
- Metro
- Springfield, MO
- State GDP YoY
- ▲ 1.84%
- F500 in state
- 20
Industry mix (Fortune 500 HQ in MO)
| Industry | F500 HQs | Revenue |
|---|---|---|
| Healthcare | 1 | $163B |
|
||
| Insurance | 1 | $21B |
|
||
| Industrial Technology | 1 | $17B |
|
||
| Retail | 1 | $16B |
|
||
| Industrial Distribution | 1 | $10B |
|
||
| Utilities | 1 | $9B |
|
||
Price history
+25825.9% since first listed5 events — show timeline
- 2026-05-29 Listed $350,000 SOMO
- 2023-10-03 Rental Removed $1,350 RENT.
- 2023-09-24 Price Changed $1,350 RENT.
- 2023-09-24 Listed for Rent — RENT.
- 2022-11-08 Rental Removed — RENT.
Property tax history
+2.8%/yrLatest (2025): $2,138 · +6.1% YoY. Source: county tax records.
Cash-flow waterfall
monthlySold comps — $/sqft
last 12 mo · ≤1 miLoading sold comps…