 Fourplex
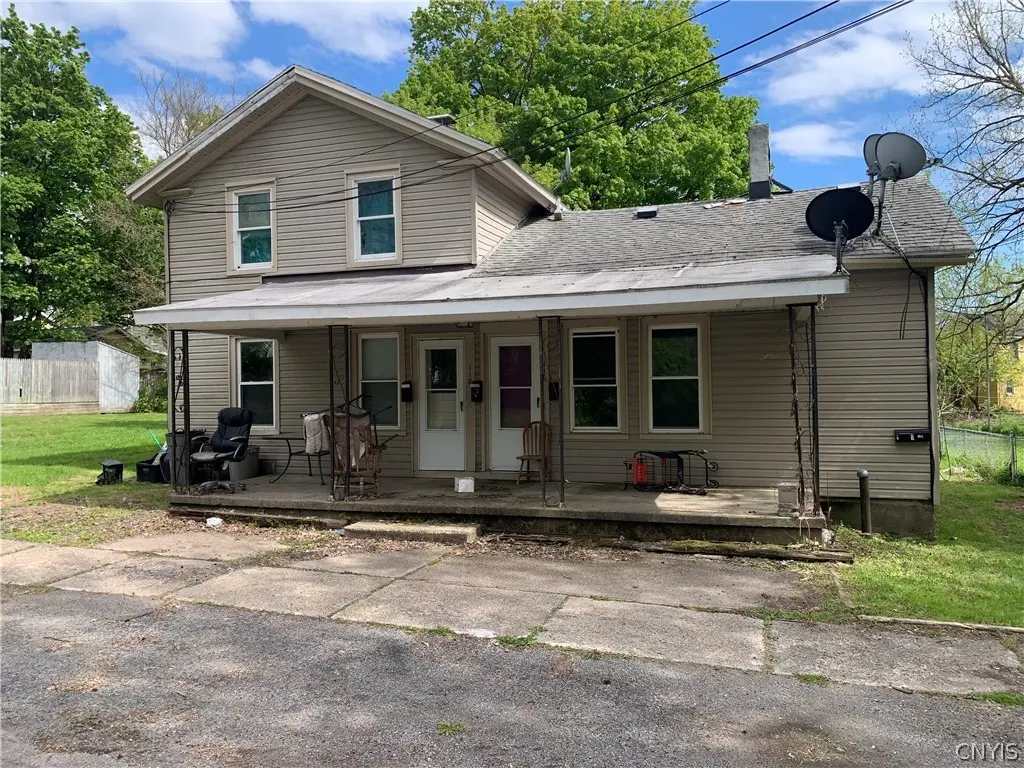
116 Lyon St · Fulton, NY
Flood risk 4/10 · Minor
- FEMA flood zone
- X (unshaded)
- Chance of flooding over 30 yrs
- 0.24%
- Est. flood insurance / yr
- $507 – $1,088
Fire risk 3/10 · Minor
- Est. fire insurance / yr
- $691 – $1,283
Heat risk 2/10 · Minimal
- Hot days now (above 95°F)
- 7 days/yr
- Hot days in 30 yrs
- 16 days/yr
Wind risk 1/10 · Minimal
- Chance of severe wind over 30 yrs
- 0.0%
Air-quality risk 2/10 · Minimal
- Unhealthy air days now
- 1 days/yr
- Unhealthy air days in 30 yrs
- 1 days/yr
Risk factors via First Street. Map © Google.
Why this score? — see what drove the C- grade
The composite is a weighted blend of 9 inputs, each scored 0–100. Each bar is that input's sub-score; the figure is the points it added to the 100-point composite (weight × sub-score).
- Cash flow +15.0/30.0
- Appreciation +8.4/10.0
- ARV discount +7.5/15.0
- 1% rule +5.0/10.0
- DSCR +5.0/10.0
- Livability +3.1/5.0
- Schools +3.0/10.0
- Rent growth +2.5/5.0
- Condition / age +2.5/5.0
$48,000
🖨 Deal sheet 📄 Offer letter ✓ Due diligence
Multi-family units
County records classify this as Multi-Family (5+ Unit). Listing-text estimate: 4 units. estimate disagrees with records
5+ unit building — per-unit beds/baths from public records are typically unavailable; the breakdown below (if shown) is an estimate from the listing text.
Listing remarks MLS
Looking for a great rental property? The property is fully rented with tenants whom have been on premise for years!! Property does need some TLC and therefore being sold AS IS! Schedule your showing today! Thank you for showing!
Key facts
- 0.25 acre lot
- 2 parking spots
- Built 1957
Property features AI
Finance
- Financial info: Multifamily property with 2 total units; Separate gas and electric meters: 4 gas meters, 4 electric meters; Operating expense details: see remarks; Owner-paid items/rent inclusions: see remarks
Exterior
- Parking: Two or more parking spaces
- Utilities: Sewer connected; Water available (public); Circuit breaker electrical service
- Home design: Two-story building; Existing property
- Construction: Vinyl siding; Stone foundation; Built (existing structure)
- Exterior features: Irregular residential lot; City street frontage; Lot dimensions approximately 50 x 220
Interior
- Kitchen: Eat-in kitchens in both units
- Bedrooms: One unit with 3 bedrooms; One unit with 2 bedrooms
- Flooring: Carpet; Vinyl; Varied flooring
- Bathrooms: Four full bathrooms total (each unit has 2 full bathrooms)
- Heating & cooling: Gas forced-air heating
- Interior features: Full basement
- Laundry & utility: Gas water heater
Neighborhood map
What this means for you Summary
Snapshot
- This is a 4 × 5-bed/?-bath units multifamily listed at $48k.
Deal economics
- At list price, monthly cash flow is $4k ($49k/yr) — positive. Per door: $1k/mo.
- The deal already cash-flows at list — no discount required.
- Meets the 1% rule at list price ($6k rent vs $48k).
- Recommended offer: $47k (1.5% below list) — sets the bar for market timing.
- Cap rate 107.8% vs local median 6.9% in Fulton — top-decile yield for the area; either an underpriced asset or a hidden risk that comps aren't pricing in. Stress-test before assuming the spread holds.
Location & tenants
- Location reads 61/100 on livability (#907 in NY) — a middle-class / working-renter tenant base. Strengths: cost of living A+, housing A+; Watch: employment D, schools D-, crime F.
- Fulton City School District (town): math 29% / reading 43% proficiency, ranked #554 of 590 in NY (top 94%) — families likely to look elsewhere, expect single-tenant / working-renter base with shorter leases.
- Market conditions: 115 active listings in the ZIP; 172 units permitted in Oswego County in 2024 (27 in 5+ unit buildings).
Forward outlook
- In year one you build about $4k of equity ($332 loan paydown + $3k appreciation (6.8% local appreciation)).
- Oswego County population projected at -23% by 2050 — secular population decline; favor cash flow + early exit over multi-decade hold.
- At projected returns (6.8% appreciation + 3.0% rent growth), your $13k cash investment doubles in ~1 year — after that, you're playing with house money.
- By year 9, paydown + projected appreciation supports a ~$33k cash-out refi (75% LTV) — recoverable capital for the next deal without selling this one.
Negotiation context
- It's been on market 22 days — a 2% lower offer ($47k) is reasonable based on typical stale-listing flexibility.
- 2 sale attempts since 5y ago with the ask held roughly flat each time — persistent listings suggest the price (not the market) is what's stuck; bring a comps-based counter.
Risks & watch-outs
- Watch-outs: built in 1957 — expect roof / HVAC / electrical / plumbing capex.
Questions for the listing agent
- Can we see the unit-by-unit rent roll, current vacancy, and any below-market leases? What's the average tenancy length?
- What capital expenditures (roof, boiler, parking lot, exteriors) have been made in the last 5 years, and what's planned in the next 2?
- Built in 1957 — when were the roof, HVAC, electrical panel, plumbing, and water heater last replaced?
- Is there a deadline driving the sale (1031 exchange, divorce, estate, relocation)? That informs how much negotiation room exists.
- Schools are D-rated, which usually means shorter tenancies and higher turnover. Who's the typical renter profile here, and what's been the actual vacancy rate?
- Crime grade is F in this area — have there been break-ins, vandalism, or insurance claims at this property in the last 3 years? What carrier currently insures it and at what premium?
- What's the average days-on-market for RENTAL listings here right now (not sales)? A rising rental-DOM trend means longer vacancies and softer asking-rent achievability than the comps imply.
- What's the recent tenant-quality profile in this submarket — average credit score on applications, eviction rate, late-payment / NSF rate, and stable-employment percentage? A property-management company in the area should have these aggregated.
- How much new apartment / multifamily construction is in the pipeline within 1–3 miles? Heavy new supply (>2% of stock underway) typically softens rents 12–24 months out; light construction supports rent growth.
Investment metrics
- 1% rule
- 11.59% ✓
- Cap rate
- 107.83%
- Cash-on-cash
- 362.63%
- DSCR
- 17.14
- GRM
- 0.7
CMA / ARV
- ARV (median comp)
- $170,334
- List price
- $48,000
- Delta
- -71.82%
- Verdict
- UNDERPRICED
- Comps
- 20 within 1.0 mi
Projected returns pro-forma
6.75% appreciation · 3.0% rent growth · sell at horizon
- IRR
- —
- Equity multiple
- 21.44×
- Total profit
- $274,776
- Equity at exit
- $32,469
- IRR
- —
- Equity multiple
- 46.04×
- Total profit
- $605,392
- Equity at exit
- $60,970
Cash invested: $13,440 (down + closing). Projections, not guarantees.
Landlord ↔ Tenant lean methodology
- Overall (STATE)
- 15 Strongly Tenant-Friendly
- State New York
- 15 Strongly Tenant-Friendly · D+10
- County
- — inherits STATE
- City
- — inherits STATE
ZIP-level market 13069
- Home prices YoY
- 2.3%
- Active inventory
- 115
- Price-to-rent
- 2.9×
Monthly cashflow live
- Estimated rent
- $5,561 medium interval (Pro) →
- Mortgage (P&I)
- −$252
- Tax est. 1.5%
- −$60 /mo · $720/yr
- Insurance
- −$20
- HOA
- −$0
- Vacancy / Maint / Mgmt
- −$1,168
- Net cashflow
- $4,061
Break-even live
4-unit breakdown (identical units grouped — click to expand)
| Units | Beds | Baths | Est. rent |
|---|---|---|---|
| 4× units | 5 | — | $5,560 |
| #1 | 5 | — | $1,390 |
| #2 | 5 | — | $1,390 |
| #3 | 5 | — | $1,390 |
| #4 | 5 | — | $1,390 |
| Total (4 units) | $5,561 | ||
UW: 25.0% down · 7.5% · 30yr · 1.5% tax · 5.0% vac · 8.0% maint · 8.0% mgmt
Financing live
Cash to close
- Down payment
- $12,000
- Closing costs
- $1,440
- Reserves months
- —
- Total cash needed
- —
Loan-product check · same deal, 3 products live
Conventional
25% down · 7.5% · 30yr
- Down + closing
- —
- Monthly P&I
- —
- Monthly cashflow
- —
- DSCR
- —
- Eligible?
- —
Personal DTI + credit; lowest rate.
DSCR
20% down · 8.5% · 30yr
- Down + closing
- —
- Monthly P&I
- —
- Monthly cashflow
- —
- DSCR
- —
- Eligible?
- —
No personal income docs; deal must DSCR.
Hard money
10% down · 12.0% · 12mo
- Down + closing
- —
- Monthly P&I
- —
- Monthly cashflow
- —
- DSCR
- —
- Eligible?
- —
Short-term bridge; refi at stabilization.
Listing history 10 events
-
2026-06-07statusdays on market $48,000 Pending 22 DOM
-
2026-06-02days on market $48,000 Active 21 DOM
-
2026-06-01days on market $48,000 Active 20 DOM
-
2026-05-31days on market $48,000 Active 19 DOM
-
2026-05-30days on market $48,000 Active 18 DOM
-
2026-05-12$48,000 Active 304-char remark
-
2021-12-05soldstatus $59,900 Closed Sale or Rented 228-char remark
Show marketing remark (228 chars)
Looking for a great rental property? The property is fully rented with tenants whom have been on premise for years!! Property does need some TLC and therefore being sold AS IS! Schedule your showing today! Thank you for showing!
-
2021-09-27status Pending Sale 228-char remark
Show marketing remark (228 chars)
Looking for a great rental property? The property is fully rented with tenants whom have been on premise for years!! Property does need some TLC and therefore being sold AS IS! Schedule your showing today! Thank you for showing!
-
2021-09-14historical 228-char remark
Show marketing remark (228 chars)
Looking for a great rental property? The property is fully rented with tenants whom have been on premise for years!! Property does need some TLC and therefore being sold AS IS! Schedule your showing today! Thank you for showing!
-
2021-09-13$59,900 Active 228-char remark
Show marketing remark (228 chars)
Looking for a great rental property? The property is fully rented with tenants whom have been on premise for years!! Property does need some TLC and therefore being sold AS IS! Schedule your showing today! Thank you for showing!
ⓘ Source: listings_history table (triggers on properties + properties_extension) + one-shot
backfill from property_details.listing_events for pre-trigger history.
Climate risk First Street
- Flood 4/10 Moderate FEMA zone X (unshaded) · 24% chance over 30 yrs
- Wildfire 3/10 Moderate
- Heat 2/10 Low 7 d/yr ≥95°F today · 16 d/yr by 30 yrs out
- Wind 1/10 Low 0% chance of damaging wind over 30 yrs
- Air quality 2/10 Low 1 unhealthy d/yr today · 1 by 30 yrs out
Nearby sold comps map
Loading sold comps map…
Walkable amenities ~0.75 mi
Loading nearby amenities…
Taxation est. · year 1
- Rental income
- $66,732
- − Mortgage interest
- −$2,689
- − Property taxes
- −$720
- − Insurance
- −$240
- − Repairs & maintenance
- −$5,339
- − Management
- −$5,339
- − Depreciation
- −$1,396
- Taxable income
- $51,010
- Est. tax owed @ 24.0%
- −$12,242
- After-tax cash flow
- $36,495/yr
For passive investors: Depreciation is non-cash, so a rental often shows a tax loss while cash-flowing — sheltering income. Rental losses are passive: they offset passive income freely, and up to $25,000/yr can offset ordinary (W-2) income if you actively participate and your MAGI is under $100k (phasing out to $0 by $150k); unused losses carry forward. On sale, claimed depreciation is recaptured at up to 25%, and gains may owe capital-gains tax (a 1031 exchange can defer both). Figures are a year-1 estimate at your 24.0% rate — not tax advice; consult a CPA.
Schools (NCES district)
- District
- Fulton City School District
- NCES district ID
- 3611700
- Math proficiency
- 29% ▼ -11.00%
- Reading proficiency
- 43% ▲ 5.00%
- Median HH income
- $43,337
- Composite
- 30.49/100
- National rank
- #6220
- State rank
- #554 of 590 in NY
Livability — Fulton
- Score
- 61/100
- State rank
- #907
- US rank
- #17723
Category grades
Schools grade is shown separately in the Schools card above.
Census & demographics
- Census place
- Fulton, NY
- Population (ZIP)
- 23,176
Population outlook (Oswego County) Hauer SSP2
- Today (2025)
- 114,465 people
- By 2030
- 109,968 · -3.9%
- By 2040
- 99,205 · -13.3%
- By 2050
- 87,979 · -23.1%
- By 2075
- 65,100 · -43.1%
- By 2100
- 47,117 · -58.8%
Race, ethnicity, and origin ACS 2023
- Neighborhood character
- Predominantly White (93%)
- Race & ethnicity
- White 93% Hispanic / Latino 4% Two or more races 3%
- Common ancestry
- Lithuanian 6% Romanian 6% Iranian 2%
- Foreign-born
- 2% · Canada
- Languages at home
- 96% English-only · Spanish 2% German/W. Germanic 1%
Political lean MEDSL · Oswego
- 2024 margin
- Strong R (+24.2) · D 37.9% · R 62.1%
- 2008→2024 swing
- -26.6pp toward R · 2008: 2.5pp · 2024: -24.2pp
- All cycles
- 2024: R+24.2 2020: R+20.2 2016: R+23.2 2012: D+7.9 2008: D+2.5
Not yet ingested
- Civics
- —
Market trends
- HPI YoY
- ▲ 6.75%
- Current HPI
- 304.443
- Rent YoY
- —
- Metro
- —
- State GDP YoY
- ▲ 2.60%
- F500 in state
- 92
Industry mix (Fortune 500 HQ in NY)
| Industry | F500 HQs | Revenue |
|---|---|---|
| Financial Services | 10 | $950B |
|
||
| Consumer Goods | 9 | $162B |
|
||
| Insurance | 4 | $225B |
|
||
| Telecommunications | 2 | $144B |
|
||
| Pharmaceuticals | 2 | $112B |
|
||
| Media / Entertainment | 2 | $69B |
|
||
Price history
-19.9% since first listed6 events — show timeline
- 2026-06-03 Pending — CNYIS
- 2026-05-12 Listed $48,000 CNYIS
- 2021-12-05 Sold (MLS) $59,900 CNYIS
- 2021-09-27 Pending — CNYIS
- 2021-09-14 Listing Removed — CNYIS
- 2021-09-13 Listed $59,900 CNYIS
Property tax history
+2.6%/yrLatest (2025): $3,245 · +7.5% YoY. Source: county tax records.
Cash-flow waterfall
monthlySold comps — $/sqft
last 12 mo · ≤1 miLoading sold comps…