 🏷️ Likely Rental
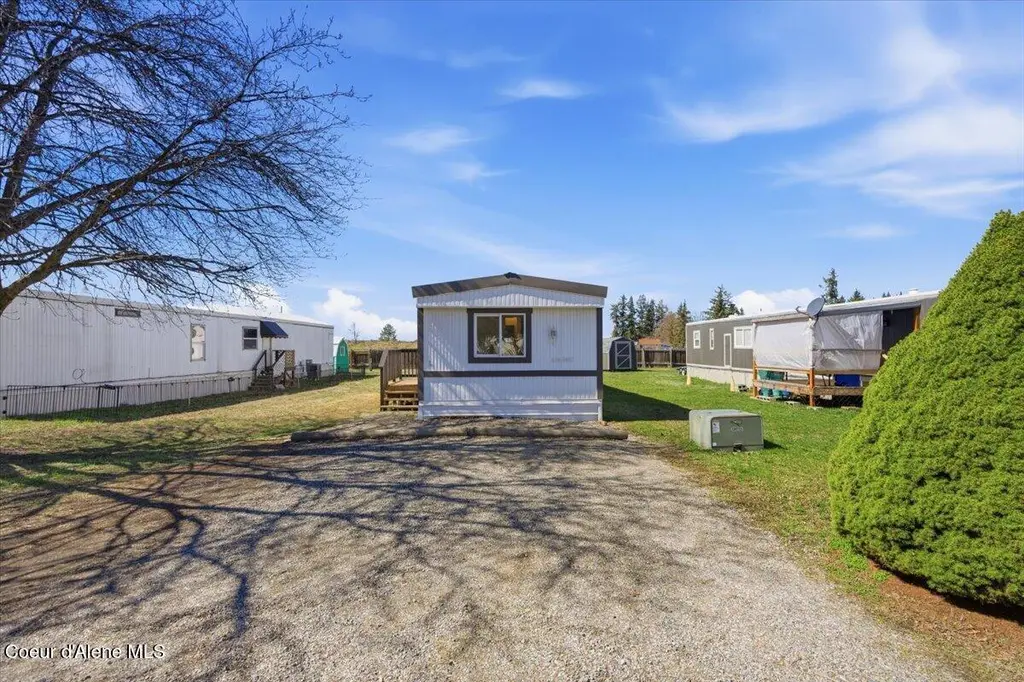
10657 N Benoit St · Hayden, ID
Flood risk 1/10 · Minimal
- FEMA flood zone
- X (unshaded)
- Chance of flooding over 30 yrs
- 0.0%
- Est. flood insurance / yr
- $507 – $1,088
Fire risk 5/10 · Moderate
- Est. fire insurance / yr
- $584 – $1,086
Heat risk 2/10 · Minimal
- Hot days now (above 92°F)
- 7 days/yr
- Hot days in 30 yrs
- 14 days/yr
Wind risk 1/10 · Minimal
- Chance of severe wind over 30 yrs
- —
Air-quality risk 9/10 · Severe
- Unhealthy air days now
- 14 days/yr
- Unhealthy air days in 30 yrs
- 16 days/yr
Risk factors via First Street. Map © Google.
Why this score? — see what drove the B grade
The composite is a weighted blend of 9 inputs, each scored 0–100. Each bar is that input's sub-score; the figure is the points it added to the 100-point composite (weight × sub-score).
- Cash flow +30.0/30.0
- 1% rule +10.0/10.0
- DSCR +10.0/10.0
- ARV discount +7.5/15.0
- Schools +4.4/10.0
- Condition / age +4.0/5.0
- Livability +3.2/5.0
- Rent growth +2.8/5.0
- Appreciation +0.0/10.0
$85,000
🖨 Deal sheet 📄 Offer letter ✓ Due diligence
Listing remarks
Completely remodeled in 2026, this move-in ready 2 bed, 2 bath single-wide home offers affordable living in a quiet, well-maintained 55+ community. Featuring new LVP flooring throughout, an updated kitchen, and beautifully refreshed bathrooms, this home delivers modern comfort at an exceptional value. Located in a peaceful park setting with lot rent at just $485/month, this is an ideal opportunity for low-maintenance living or a smart investment. Vacant and easy to show.
Key facts
- Remodeled
- Refreshed bathrooms
- Updated kitchen
Tags
Property features AI
Exterior
- Utilities: Public water; Shared septic
- Home design: Manufactured home; Single-story (manufactured); Paved private maintained road access
- Construction: Aluminum siding; Aluminum roof; Pillar/post/pier foundation; Built as a manufactured structure
- Exterior features: Open porch; Lawn; Open, level lot
Interior
- Kitchen: Electric range; Microwave; Refrigerator
- Bedrooms: 2 main-level bedrooms
- Flooring: LVP
- Bathrooms: 3 main-level bathrooms
- Heating & cooling: Electric heating; Furnace
- Interior features: Washer hookup; Crawl space basement
- Laundry & utility: Electric dryer hookup; Washer hookup
Neighborhood map
What this means for you Summary
Snapshot
- This is a 2-bed/2.0-bath single-family listed at $85k. Condition is rated good.
Deal economics
- At list price, monthly cash flow is $865 ($10k/yr) — positive.
- The deal already cash-flows at list — no discount required.
- Meets the 1% rule at list price ($2k rent vs $85k).
- Recommended offer: $80k (6.0% below list) — sets the bar for market timing.
- Cap rate 18.5% vs local median 2.2% in Hayden — top-decile yield for the area; either an underpriced asset or a hidden risk that comps aren't pricing in. Stress-test before assuming the spread holds.
Location & tenants
- Location reads 64/100 on livability (#150 in ID) — a middle-class / working-renter tenant base. Strengths: crime A+, housing A+; Watch: schools D+, amenities F, commute F.
- Coeur D'Alene District (urban): math 44% / reading 60% proficiency, ranked #23 of 92 in ID (top 25%) — acceptable for families but not a draw, mixed tenant base, ~2y average lease.
- Market conditions: Rents rising (+1.2%/yr); 383 active listings in the ZIP; solid renter incomes; 1,606 units permitted in Kootenai County in 2024 (154 in 5+ unit buildings).
Forward outlook
- Local home prices are declining (-3.0%/yr); year-one equity from $588 of loan paydown is wiped out by about $3k of value loss. Plan a longer hold.
- Kootenai County population projected at +33% by 2050 — long-run rental-demand tailwind backs the buy-and-hold thesis.
- At projected returns (-3.0% appreciation + 1.2% rent growth), your $24k cash investment doubles in ~3 years — after that, you're playing with house money.
Negotiation context
- It's been on market 78 days — a 6% lower offer ($80k) is reasonable based on typical stale-listing flexibility.
Risks & watch-outs
- Climate carrying-cost: moderate wildfire risk — expect insurance premiums to compound above CPI over the hold.
Questions for the listing agent
- It's been on market 78 days. Have you received any prior offers? Is the seller open to a 6% concession, seller financing, or rate buy-down credit?
- Built in 1978 — when were the roof, HVAC, electrical panel, plumbing, and water heater last replaced?
- Why hasn't it sold? Are there any deal-killer items the seller is aware of (foundation, flood, title, zoning, code violations)?
- Is there a deadline driving the sale (1031 exchange, divorce, estate, relocation)? That informs how much negotiation room exists.
- Schools are D-rated, which usually means shorter tenancies and higher turnover. Who's the typical renter profile here, and what's been the actual vacancy rate?
- What's the average days-on-market for RENTAL listings here right now (not sales)? A rising rental-DOM trend means longer vacancies and softer asking-rent achievability than the comps imply.
- What's the recent tenant-quality profile in this submarket — average credit score on applications, eviction rate, late-payment / NSF rate, and stable-employment percentage? A property-management company in the area should have these aggregated.
- How much new for-sale + rental construction is in the pipeline within 1–3 miles? Heavy new supply typically softens prices + rents 12–24 months out; constrained supply supports both.
Investment metrics
- 1% rule
- 2.16% ✓
- Cap rate
- 18.50%
- Cash-on-cash
- 43.60%
- DSCR
- 2.94
- GRM
- 3.9
CMA / ARV
- ARV (on-the-fly)
- $353,892
- Comps found
- 11
Show comp detail 11 sales within ~0.75 mi
| Address | Dist | Beds/Ba | Sqft | Sold | Price | $/sf | Match |
|---|---|---|---|---|---|---|---|
| 10660 N Benoit St | 0.04mi | 2/2.0 | 924 (0%) | 4mo | $89,950 | $97 | 95 |
| 653 W Wyoming Ave | 0.46mi | 2/2.0 | 924 (0%) | 1mo | $40,000 | $43 | 78 |
| 10418 N Camp Ct | 0.43mi | 2/1.0 | 936 (+1%) | 4mo | $360,000 | $385 | 70 |
| 10545 N Camp Ct | 0.37mi | 2/1.0 | 954 (+3%) | 4mo | $365,000 | $383 | 70 |
| 896 W Mustang Ave | 0.36mi | 3/2.0 (+1) | 1,032 (+12%) | 3mo | $435,000 | $422 | 56 |
| 11546 N Stinson Loop | 0.44mi | 3/2.0 (+1) | 1,019 (+10%) | 3mo | $450,000 | $442 | 55 |
| 11672 N Stinson Loop | 0.45mi | 3/2.0 (+1) | 1,030 (+12%) | 1mo | $439,000 | $426 | 54 |
| 637 W Texas Ave | 0.45mi | 2/1.0 | 868 (-6%) | 17mo | $35,000 | $40 | 51 |
| 861 W Kyler Ave | 0.52mi | 2/1.0 | 954 (+3%) | 22mo | $349,000 | $366 | 48 |
| 11221 N Crusader St | 0.34mi | 2/1.0 | 792 (-14%) | 10mo | $359,900 | $454 | 48 |
| 11231 N Alaska Loop | 0.45mi | 2/2.0 | 1,038 (+12%) | 23mo | $157,900 | $152 | 40 |
Match score weights: distance 35% · size 25% · config 20% · recency 20%. Top-matched comps best support the ARV.
Projected returns pro-forma
-3.0% appreciation · 1.16% rent growth · sell at horizon
- IRR
- 38.4%
- Equity multiple
- 2.60×
- Total profit
- $37,990
- Equity at exit
- $12,674
- IRR
- 44.0%
- Equity multiple
- 4.82×
- Total profit
- $90,899
- Equity at exit
- $7,349
Cash invested: $23,800 (down + closing). Projections, not guarantees.
Landlord ↔ Tenant lean methodology
- Overall (STATE)
- 91 Strongly Landlord-Friendly
- State Idaho
- 91 Strongly Landlord-Friendly · R+18
- County
- — inherits STATE
- City
- — inherits STATE
ZIP-level market 83835
- Rents YoY
- 1.2%
- Active inventory
- 383
- Price-to-rent
- 3.9×
Monthly cashflow live
- Estimated rent
- $1,838 medium interval (Pro) →
- Mortgage (P&I)
- −$446
- Tax est. 1.5%
- −$106 /mo · $1,275/yr
- Insurance
- −$35
- HOA
- −$0
- Vacancy / Maint / Mgmt
- −$386
- Net cashflow
- $865
Break-even live
UW: 25.0% down · 7.5% · 30yr · 1.5% tax · 5.0% vac · 8.0% maint · 8.0% mgmt
Financing live
Cash to close
- Down payment
- $21,250
- Closing costs
- $2,550
- Reserves months
- —
- Total cash needed
- —
Loan-product check · same deal, 3 products live
Conventional
25% down · 7.5% · 30yr
- Down + closing
- —
- Monthly P&I
- —
- Monthly cashflow
- —
- DSCR
- —
- Eligible?
- —
Personal DTI + credit; lowest rate.
DSCR
20% down · 8.5% · 30yr
- Down + closing
- —
- Monthly P&I
- —
- Monthly cashflow
- —
- DSCR
- —
- Eligible?
- —
No personal income docs; deal must DSCR.
Hard money
10% down · 12.0% · 12mo
- Down + closing
- —
- Monthly P&I
- —
- Monthly cashflow
- —
- DSCR
- —
- Eligible?
- —
Short-term bridge; refi at stabilization.
Listing history 18 events
-
2026-06-19days on market $85,000 Active 78 DOM
-
2026-06-18days on market $85,000 Active 77 DOM
-
2026-06-17days on market $85,000 Active 76 DOM
-
2026-06-16days on market $85,000 Active 75 DOM
-
2026-06-15days on market $85,000 Active 74 DOM
-
2026-06-14days on market $85,000 Active 72 DOM
-
2026-06-13days on market $85,000 Active 71 DOM
-
2026-06-10days on market $85,000 Active 69 DOM
-
2026-06-09days on market $85,000 Active 68 DOM
-
2026-06-08days on market $85,000 Active 67 DOM
-
2026-06-07days on market $85,000 Active 66 DOM
-
2026-06-03days on market $85,000 Active 62 DOM
-
2026-06-02days on market $85,000 Active 61 DOM
-
2026-06-01days on market $85,000 Active 60 DOM
-
2026-05-31days on market $85,000 Active 59 DOM
-
2026-05-30days on market $85,000 Active 58 DOM
-
2026-04-29price $85,000
-
2026-04-01$95,000 Active
ⓘ Source: listings_history table (triggers on properties + properties_extension) + one-shot
backfill from property_details.listing_events for pre-trigger history.
Climate risk First Street
- Flood 1/10 Low FEMA zone X (unshaded) · 0% chance over 30 yrs
- Wildfire 5/10 Major
- Heat 2/10 Low 7 d/yr ≥92°F today · 14 d/yr by 30 yrs out
- Wind 1/10 Low
- Air quality 9/10 Extreme 14 unhealthy d/yr today · 16 by 30 yrs out
Nearby sold comps map
Loading sold comps map…
Walkable amenities ~0.75 mi
Loading nearby amenities…
Taxation est. · year 1
- Rental income
- $22,059
- − Mortgage interest
- −$4,761
- − Property taxes
- −$1,275
- − Insurance
- −$425
- − Repairs & maintenance
- −$1,765
- − Management
- −$1,765
- − Depreciation
- −$2,473
- Taxable income
- $9,595
- Est. tax owed @ 24.0%
- −$2,303
- After-tax cash flow
- $8,074/yr
For passive investors: Depreciation is non-cash, so a rental often shows a tax loss while cash-flowing — sheltering income. Rental losses are passive: they offset passive income freely, and up to $25,000/yr can offset ordinary (W-2) income if you actively participate and your MAGI is under $100k (phasing out to $0 by $150k); unused losses carry forward. On sale, claimed depreciation is recaptured at up to 25%, and gains may owe capital-gains tax (a 1031 exchange can defer both). Figures are a year-1 estimate at your 24.0% rate — not tax advice; consult a CPA.
Condition & rehab AI · 12 photos
This move-in ready single-wide home offers modern comfort and exceptional value in a quiet, well-maintained 55+ community.
Value-add opportunities
- Both Paint exterior — Fresh paint enhances curb appeal and value
- Both Replace outdoor lighting — Modern lighting improves safety and aesthetics
- Both Install smart thermostat — Saves energy and appeals to tech-savvy buyers
Renovation cost estimate screening
Value-add ROI direction
- Both Paint exterior — Fresh paint enhances curb appeal and value ↑
- Both Replace outdoor lighting — Modern lighting improves safety and aesthetics ↑
- Both Install smart thermostat — Saves energy and appeals to tech-savvy buyers ↑
ⓘ Cost ranges are severity-bucket heuristics (US national rule-of-thumb). Get contractor quotes + a written scope before underwriting a rehab budget.
Schools (NCES district)
- District
- Coeur D'Alene District
- NCES district ID
- 1600780
- Math proficiency
- 44% ▼ -6.00%
- Reading proficiency
- 60% ▼ -2.00%
- Median HH income
- $47,652
- Composite
- 44.16/100
- National rank
- #2858
- State rank
- #23 of 92 in ID
Livability — Hayden
- Score
- 64/100
- State rank
- #150
- US rank
- #14103
Category grades
Schools grade is shown separately in the Schools card above.
Census & demographics
- Census place
- Hayden, ID
- County
- Kootenai County · 146,553 people
- City population
- 24,238
- Metro
- Coeur d'Alene, ID
- Population (ZIP)
- 24,238
- Household income
- $91,316
- Rent vs Own
- Severe rent burden
- 345.0
Population outlook (Kootenai County) Hauer SSP2
- Today (2025)
- 177,692 people
- By 2030
- 190,689 · +7.3%
- By 2040
- 214,704 · +20.8%
- By 2050
- 236,510 · +33.1%
- By 2075
- 285,984 · +60.9%
- By 2100
- 316,459 · +78.1%
Race, ethnicity, and origin ACS 2023
- Neighborhood character
- Predominantly White (91%)
- Race & ethnicity
- White 91% Two or more races 6% Hispanic / Latino 4%
- Common ancestry
- Portuguese 6% Italian 3% Slovak 3%
- Foreign-born
- 3% · Canada
- Languages at home
- 98% English-only · Spanish 1%
Political lean MEDSL · Kootenai
- 2024 margin
- Solid R (+51.9) · D 22.9% · R 74.8% · Other 2.2%
- 2008→2024 swing
- -25.6pp toward R · 2008: -26.3pp · 2024: -51.9pp
- All cycles
- 2024: R+51.9 2020: R+42.9 2016: R+42.5 2012: R+34.3 2008: R+26.3
Not yet ingested
- Civics
- —
Market trends
- HPI YoY
- ▼ -271.03%
- Current HPI
- 256.927
- Rent YoY
- ▲ 1.16%
- Metro
- Coeur d'Alene, ID
- State GDP YoY
- ▲ 4.51%
- F500 in state
- 6
Industry mix (Fortune 500 HQ in ID)
| Industry | F500 HQs | Revenue |
|---|---|---|
| Retail | 1 | $79B |
|
||
| Technology | 1 | $25B |
|
||
| Food / Agriculture | 1 | $6B |
|
||
Price history
-10.5% since first listed2 events — show timeline
- 2026-04-29 Price Changed $85,000 CDAMLS
- 2026-04-01 Listed $95,000 CDAMLS
Cash-flow waterfall
monthlySold comps — $/sqft
last 12 mo · ≤1 miLoading sold comps…