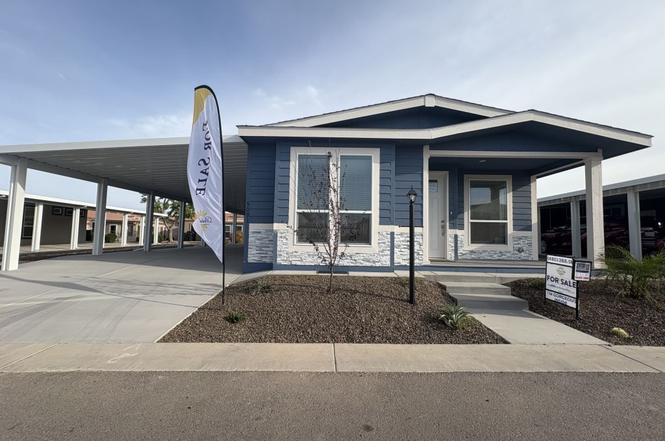
3301 S Goldfield Rd #5091 · Apache Junction, AZ
Flood risk 3/10 · Minor
- FEMA flood zone
- X (unshaded)
- Chance of flooding over 30 yrs
- 0.2%
- Est. flood insurance / yr
- $507 – $1,088
Fire risk 6/10 · Moderate
- Est. fire insurance / yr
- $610 – $1,132
Heat risk 9/10 · Severe
- Hot days now (above 111°F)
- 7 days/yr
- Hot days in 30 yrs
- 18 days/yr
Wind risk 1/10 · Minimal
- Chance of severe wind over 30 yrs
- —
Air-quality risk 3/10 · Minor
- Unhealthy air days now
- 3 days/yr
- Unhealthy air days in 30 yrs
- 4 days/yr
Risk factors via First Street. Map © Google.
Why this score? — see what drove the D grade
The composite is a weighted blend of 9 inputs, each scored 0–100. Each bar is that input's sub-score; the figure is the points it added to the 100-point composite (weight × sub-score).
- Cash flow +15.2/30.0
- ARV discount +7.5/15.0
- DSCR +4.6/10.0
- 1% rule +4.2/10.0
- Livability +3.3/5.0
- Rent growth +2.9/5.0
- Condition / age +2.5/5.0
- Schools +1.5/10.0
- Appreciation +0.0/10.0
$206,500
🖨 Deal sheet (PDF) 📄 Offer letter ✓ Due diligence
Listing remarks
55+ age qualified community. Welcome to Dolce Vita a 55+ age active and vibrant community, where you can find yourself in your dream home. We have a stunning, brand new, beautiful, updated, Sonora 2026 2 bed, 2 bath home for sale featuring 1634.80 sq ft of beautifully designed living space. Located in Apache Junction, this property offers the perfect blend of modern amenities and timeless charm. Step inside to find open-concept floor plan, hardwood floors, high ceilings, natural light. The kitchen boasts features like, stainless steel appliances, custom cabinetry, perfect for both everyday living and entertaining. The spacious primary suite offers a peaceful retreat, complete with walk-in s
Key facts
- Custom cabinetry
- Quartz countertops
- Natural light
Tags
Property features AI
Finance
- Other: Active listing; Virtual tour available
- Financial info: List price $204,900
Exterior
- Home design: Spec home, Plan name Sonora; Unit at 3301 S Goldfield Rd #5091, Apache Junction, AZ
- Exterior features: Living area approximately 1,634 (interior size listed)
Interior
- Bedrooms: 2 bedrooms
- Bathrooms: 2 total bathrooms
- Interior features: 2 full bathrooms
Neighborhood map
What this means for you Summary
Snapshot
- This is a 2-bed/2.0-bath manufactured listed at $206k.
Deal economics
- At list price, monthly cash flow is $70 ($845/yr) — positive.
- The deal already cash-flows at list — no discount required.
- To meet the 1% rule (rent ≥ 1% of price), the offer needs to be $190k (8.2% below list).
- Recommended offer: $182k (12.0% below list) — sets the bar for market timing.
- Cap rate 6.7% vs local median 3.5% in Apache Junction — top-decile yield for the area; either an underpriced asset or a hidden risk that comps aren't pricing in. Stress-test before assuming the spread holds.
Location & tenants
- Location reads 66/100 on livability (#70 in AZ) — a middle-class / working-renter tenant base. Strengths: cost of living A+, housing A+; Watch: crime D+, amenities F, commute F.
- Apache Junction Unified District (4443) (suburban): math 15% / reading 20% proficiency, ranked #195 of 249 in AZ (top 78%) — low school quality limits family demand, transient renter base, plan for 1-2y turnover.
- Zoned schools: Peralta Trail Elementary School (math 17% / reading 26%, grade F, #717 of 1,109 statewide, top 65%, 286 students, 74% FRL); Cactus Canyon Junior High (math 14% / reading 19%, grade F, #151 of 218 statewide, top 70%, 702 students, 50% FRL); Apache Junction High School (math 12% / reading 17%, grade F, #267 of 381 statewide, top 72%, 999 students, 48% FRL) — zoned schools at 57% FRL track the district average.
- Market conditions: Rents rising (+1.6%/yr); 358 active listings in the ZIP; 10 comparable units currently listed for rent nearby; rentals at typical pace (median 26d on market — plan ~3-4 weeks tenant-placement turnaround); 9,504 units permitted in Pinal County in 2024 (776 in 5+ unit buildings).
- This rent runs 32% of the median local income ($72k/yr) — at the standard rent-burdened threshold; future hikes will face affordability resistance.
Forward outlook
- Local home prices are declining (-3.0%/yr); year-one equity from $1k of loan paydown is wiped out by about $6k of value loss. Plan a longer hold.
Negotiation context
- It's been on market 159 days — a 12% lower offer ($182k) is reasonable based on typical stale-listing flexibility.
Risks & watch-outs
- Climate carrying-cost: major wildfire risk; extreme-heat days projected 7→18/yr by 2055 (HVAC capex compounding) — expect insurance premiums to compound above CPI over the hold.
Questions for the listing agent
- It's been on market 159 days. Have you received any prior offers? Is the seller open to a 12% concession, seller financing, or rate buy-down credit?
- Why hasn't it sold? Are there any deal-killer items the seller is aware of (foundation, flood, title, zoning, code violations)?
- Is there a deadline driving the sale (1031 exchange, divorce, estate, relocation)? That informs how much negotiation room exists.
- Schools are F-rated, which usually means shorter tenancies and higher turnover. Who's the typical renter profile here, and what's been the actual vacancy rate?
- Crime grade is D in this area — have there been break-ins, vandalism, or insurance claims at this property in the last 3 years? What carrier currently insures it and at what premium?
- The area grade is low — what's the realistic commute time and amenity access for the typical tenant pool here? Any planned neighborhood developments (good or bad) we should know about?
- What's the average days-on-market for RENTAL listings here right now (not sales)? A rising rental-DOM trend means longer vacancies and softer asking-rent achievability than the comps imply.
- What's the recent tenant-quality profile in this submarket — average credit score on applications, eviction rate, late-payment / NSF rate, and stable-employment percentage? A property-management company in the area should have these aggregated.
- How much new for-sale + rental construction is in the pipeline within 1–3 miles? Heavy new supply typically softens prices + rents 12–24 months out; constrained supply supports both.
Investment metrics
- 1% rule
- 0.92% ✗
- Cap rate
- 6.70%
- Cash-on-cash
- 1.46%
- DSCR
- 1.06
- GRM
- 9.1
CMA / ARV
- ARV (on-the-fly)
- $132,354
- Comps found
- 12
Show comp detail 12 sales within ~0.75 mi
| Address | Dist | Beds/Ba | Sqft | Sold | Price | $/sf | Match |
|---|---|---|---|---|---|---|---|
| 3301 S Goldfield Rd #2095 | 0.00mi | 2/2.0 | 1,632 (-0%) | 2mo | $129,900 | $80 | 98 |
| 3301 S Goldfield Rd #1054 | 0.00mi | 2/2.0 | 1,586 (-3%) | 1mo | $165,000 | $104 | 94 |
| 3301 S Goldfield Rd #2056 | 0.11mi | 2/2.0 | 1,680 (+3%) | 2mo | $177,500 | $106 | 89 |
| 3301 S Goldfield Rd #6014 | 0.06mi | 2/2.0 | 1,749 (+7%) | 3mo | $220,000 | $126 | 83 |
| 3301 S Goldfield Rd #2102 | 0.16mi | 2/2.0 | 1,720 (+5%) | 2mo | $120,000 | $70 | 83 |
| 3301 S Goldfield Rd #4018 | 0.11mi | 2/2.0 | 1,776 (+9%) | 2mo | $227,500 | $128 | 78 |
| 3301 S Goldfield Rd #2015 | 0.11mi | 2/2.0 | 1,795 (+10%) | 1mo | $145,000 | $81 | 77 |
| 3301 S Goldfield Rd #6055 | 0.11mi | 3/2.5 (+1) | 1,533 (-6%) | 3mo | $225,000 | $147 | 75 |
| 2400 E Baseline Ave #44 | 0.52mi | 2/2.0 | 1,568 (-4%) | 2mo | $115,000 | $73 | 67 |
| 3355 S Cortez Rd #28 | 0.56mi | 2/2.0 | 1,512 (-8%) | 0mo | $77,000 | $51 | 61 |
| 2400 E Baseline Ave #163 | 0.52mi | 2/2.0 | 1,512 (-8%) | 2mo | $80,000 | $53 | 61 |
| 3301 S Goldfield Rd #1015 | 0.11mi | 3/3.0 (+1) | 1,874 (+15%) | 2mo | $140,000 | $75 | 60 |
Match score weights: distance 35% · size 25% · config 20% · recency 20%. Top-matched comps best support the ARV.
Projected returns pro-forma
-3.0% appreciation · 1.57% rent growth · sell at horizon
- IRR
- -15.6%
- Equity multiple
- 0.45×
- Total profit
- $-31,640
- Equity at exit
- $30,790
- IRR
- -9.7%
- Equity multiple
- 0.44×
- Total profit
- $-32,385
- Equity at exit
- $17,854
Cash invested: $57,820 (down + closing). Projections, not guarantees.
Landlord ↔ Tenant lean methodology
- Overall (STATE)
- 87 Strongly Landlord-Friendly
- State Arizona
- 87 Strongly Landlord-Friendly · R+3
- County
- — inherits STATE
- City
- — inherits STATE
ZIP-level market 85119
- Home prices YoY
- -33.5%
- Rents YoY
- 1.6%
- Active inventory
- 358
- Price-to-rent
- 9.1×
Monthly cashflow live
- Estimated rent
- $1,896 high interval (Pro) →
- Mortgage (P&I)
- −$1,083
- Tax est. 1.5%
- −$258 /mo · $3,098/yr
- Insurance
- −$86
- HOA
- −$0
- Vacancy / Maint / Mgmt
- −$398
- Net cashflow
- $70
Break-even live
Sensitivity live
| Price | -10% $213 | -5% $142 | +0% $70 | +5% $-1 | +10% $-72 |
|---|---|---|---|---|---|
| Rent | -10% $-79 | -5% $-4 | +0% $70 | +5% $145 | +10% $220 |
| Rate | -1.0pp $174 | -0.5pp $123 | base $70 | +0.5pp $17 | +1.0pp $-38 |
UW: 25.0% down · 7.5% · 30yr · 1.5% tax · 5.0% vac · 8.0% maint · 8.0% mgmt
Financing live
Cash to close
- Down payment
- $51,625
- Closing costs
- $6,195
- Reserves months
- —
- Total cash needed
- —
Loan-product check · same deal, 3 products live
Conventional
25% down · 7.5% · 30yr
- Down + closing
- —
- Monthly P&I
- —
- Monthly cashflow
- —
- DSCR
- —
- Eligible?
- —
Personal DTI + credit; lowest rate.
DSCR
20% down · 8.5% · 30yr
- Down + closing
- —
- Monthly P&I
- —
- Monthly cashflow
- —
- DSCR
- —
- Eligible?
- —
No personal income docs; deal must DSCR.
Hard money
10% down · 12.0% · 12mo
- Down + closing
- —
- Monthly P&I
- —
- Monthly cashflow
- —
- DSCR
- —
- Eligible?
- —
Short-term bridge; refi at stabilization.
Rent comps 10 comps
| Address | Beds | Baths | Sqft | Rent | $/sqft | DOM | Units | Dist |
|---|---|---|---|---|---|---|---|---|
| 3301 S Goldfield Rd Unit 4077 Apache Junction, AZ | 2.0 | 2.0 | 1548 | $1,850 | $1.20 | 26d | 1 | 0.11mi |
| 2369 E 35th Ave Apache Junction, AZ | 3.0 | 2.5 | 1892 | $2,100 | $1.11 | 7d | 1 | 0.71mi |
| 3705 S Conestoga Rd Apache Junction, AZ | 3.0 | 2.0 | 1700 | $1,895 | $1.11 | 26d | 1 | 0.72mi |
| 3333 S Conestoga Rd Apache Junction, AZ | 3.0 | 2.0 | 1387 | $2,900 | $2.09 | 26d | 1 | 0.73mi |
| 3879 S Conestoga Rd Apache Junction, AZ | 3.0 | 2.0 | 1578 | $1,910 | $1.21 | 26d | 1 | 0.75mi |
| 2681 E Boulder Ave Apache Junction, AZ | 3.0 | 3.5 | 1776 | $2,200 | $1.24 | 26d | 1 | 0.76mi |
| 3277 S Chaparral Rd Apache Junction, AZ | 3.0 | 2.5 | 1614 | $1,770 | $1.10 | 5d | 1 | 0.90mi |
| 3448 S Chaparral Rd Apache Junction, AZ | 3.0 | 2.0 | 1186 | $1,848 | $1.56 | 13d | 1 | 0.91mi |
| 3478 S Chaparral Rd Apache Junction, AZ | 3.0 | 2.5 | 1614 | $1,850 | $1.15 | 7d | 1 | 0.93mi |
| 1510 E 26th Ln Unit 2 Apache Junction, AZ | 2.0 | 1.5 | 1160 | $1,550 | $1.34 | 0d | 1 | 1.37mi |
Listing history 14 events
-
2026-06-21days on market $206,500 Active 159 DOM
-
2026-06-18days on market $206,500 Active 156 DOM
-
2026-06-17days on market $206,500 Active 155 DOM
-
2026-06-16days on market $206,500 Active 154 DOM
-
2026-06-15days on market $206,500 Active 153 DOM
-
2026-06-13days on market $206,500 Active 151 DOM
-
2026-06-09days on market $206,500 Active 147 DOM
-
2026-06-08days on market $206,500 Active 146 DOM
-
2026-06-07days on market $206,500 Active 145 DOM
-
2026-06-04days on market $206,500 Active 142 DOM
-
2026-06-03days on market $206,500 Active 141 DOM
-
2026-06-02days on market $206,500 Active 140 DOM
-
2026-06-01days on market $206,500 Active 139 DOM
-
2026-05-31days on market $206,500 Active 138 DOM
ⓘ Source: listings_history table (triggers on properties + properties_extension) + one-shot
backfill from property_details.listing_events for pre-trigger history.
Climate risk First Street
- Flood 3/10 Moderate FEMA zone X (unshaded) · 20% chance over 30 yrs
- Wildfire 6/10 Major
- Heat 9/10 Extreme 7 d/yr ≥111°F today · 18 d/yr by 30 yrs out
- Wind 1/10 Low
- Air quality 3/10 Moderate 3 unhealthy d/yr today · 4 by 30 yrs out
Nearby sold comps map
Loading sold comps map…
Walkable amenities ~0.75 mi
Loading nearby amenities…
Taxation est. · year 1
- Rental income
- $22,746
- − Mortgage interest
- −$11,567
- − Property taxes
- −$3,098
- − Insurance
- −$1,032
- − Repairs & maintenance
- −$1,820
- − Management
- −$1,820
- − Depreciation
- −$6,007
- Taxable loss
- −$2,598
- Est. tax savings @ 24.0%
- +$623
- After-tax cash flow
- $1,468/yr
For passive investors: Depreciation is non-cash, so a rental often shows a tax loss while cash-flowing — sheltering income. Rental losses are passive: they offset passive income freely, and up to $25,000/yr can offset ordinary (W-2) income if you actively participate and your MAGI is under $100k (phasing out to $0 by $150k); unused losses carry forward. On sale, claimed depreciation is recaptured at up to 25%, and gains may owe capital-gains tax (a 1031 exchange can defer both). Figures are a year-1 estimate at your 24.0% rate — not tax advice; consult a CPA.
Schools (NCES district)
- District
- Apache Junction Unified District (4443)
- NCES district ID
- 0400790
- Math proficiency
- 15% ▼ -17.00%
- Reading proficiency
- 20% ▼ -13.00%
- Median HH income
- $44,930
- Composite
- 15.34/100
- National rank
- #9325
- State rank
- #195 of 249 in AZ
Livability — Apache Junction
- Score
- 66/100
- State rank
- #70
- US rank
- #11242
Category grades
Schools grade is shown separately in the Schools card above.
Census & demographics
- Census place
- Apache Junction, AZ
- County
- Pinal County · 399,947 people
- City population
- 56,611
- Metro
- Phoenix-Mesa-Chandler, AZ
- Population (ZIP)
- 25,420
- Household income
- $71,585
- Rent vs Own
- Severe rent burden
- 305.0
Population outlook (Pinal County) Hauer SSP2
- Today (2025)
- 437,574 people
- By 2030
- 446,903 · +2.1%
- By 2040
- 452,589 · +3.4%
- By 2050
- 444,126 · +1.5%
- By 2075
- 430,300 · -1.7%
- By 2100
- 393,536 · -10.1%
Race, ethnicity, and origin ACS 2023
- Neighborhood character
- Predominantly White (74%)
- Race & ethnicity
- White 74% Hispanic / Latino 19% Two or more races 12% Black 2% Asian 1%
- Hispanic origin (detail)
- Mexican 17%
- Common ancestry
- Slovak 5% Portuguese 3% Lithuanian 3%
- Foreign-born
- 8% · Canada
- Languages at home
- 87% English-only · Spanish 11%
Political lean MEDSL · Pinal
- 2024 margin
- Strong R (+22.1) · D 38.5% · R 60.6%
- 2008→2024 swing
- -7.6pp toward R · 2008: -14.5pp · 2024: -22.1pp
- All cycles
- 2024: R+22.1 2020: R+17.3 2016: R+19.3 2012: R+17.1 2008: R+14.5
Not yet ingested
- Civics
- —
Market trends
- HPI YoY
- ▼ -138.19%
- Current HPI
- 274.3808
- Rent YoY
- ▲ 1.57%
- Metro
- Phoenix-Mesa-Chandler, AZ
- State GDP YoY
- ▲ 4.54%
- F500 in state
- 20
Industry mix (Fortune 500 HQ in AZ)
| Industry | F500 HQs | Revenue |
|---|---|---|
| Technology | 2 | $13B |
|
||
| Mining / Metals | 1 | $23B |
|
||
| Environmental Services | 1 | $16B |
|
||
| Metals / Steel | 1 | $14B |
|
||
| Technology Distribution | 1 | $9B |
|
||
| Homebuilding | 1 | $8B |
|
||
Cash-flow waterfall
monthlySold comps — $/sqft
last 12 mo · ≤1 miLoading sold comps…