265 Burgundy Unit F · Delray Beach, FL
Flood risk 1/10 · Minimal
- FEMA flood zone
- X (unshaded)
- Chance of flooding over 30 yrs
- 0.0%
- Est. flood insurance / yr
- $507 – $1,088
Fire risk 1/10 · Minimal
- Est. fire insurance / yr
- $947 – $1,759
Heat risk 9/10 · Severe
- Hot days now (above 106°F)
- 7 days/yr
- Hot days in 30 yrs
- 26 days/yr
Wind risk 10/10 · Severe
- Chance of severe wind over 30 yrs
- 99.0%
Air-quality risk 3/10 · Minor
- Unhealthy air days now
- 2 days/yr
- Unhealthy air days in 30 yrs
- 3 days/yr
Risk factors via First Street. Map © Google.
Why this score? — see what drove the D+ grade
The composite is a weighted blend of 9 inputs, each scored 0–100. Each bar is that input's sub-score; the figure is the points it added to the 100-point composite (weight × sub-score).
- Cash flow +14.4/30.0
- 1% rule +9.4/10.0
- ARV discount +7.5/15.0
- DSCR +4.4/10.0
- Schools +4.3/10.0
- Livability +3.9/5.0
- Rent growth +3.6/5.0
- Condition / age +2.5/5.0
- Appreciation +0.0/10.0
$135,000
🖨 Deal sheet 📄 Offer letter ✓ Due diligence
Listing remarks
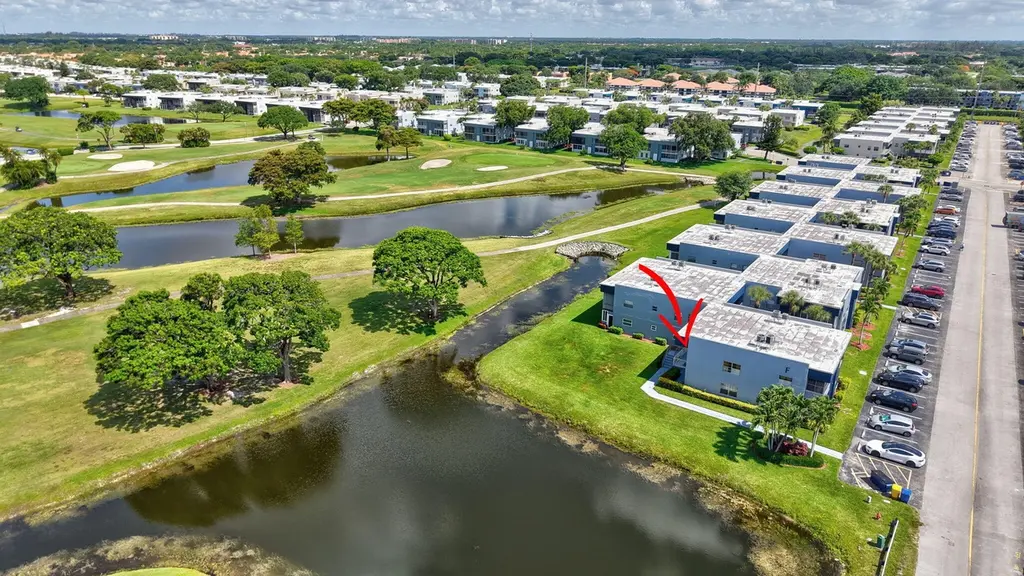
Rarely available CORNER UNIT WITH PANORAMIC TRANQUIL LAKE AND GOLF VIEWS! This pristine residence offers the best south views and tons of natural light. Relax outside and watch the golfers while enjoying the fabulous cross breeze off the lakes. Enclosed lanai adds extra living space perfect for home office or den. White tile floors throughout. Washer/dryer in unit. Second floor unit with elevator. Located just across from the Burgundy satellite pool. Move in ready! Residents enjoy Kings Point's resort-style amenities featuring tennis, pickleball, golf, indoor and outdoor pools, fitness center, clubs, entertainment and courtesy transportation. Come and make your new home in one of Delray Be
Key facts
- Golf views
- Natural light
- Panoramic lake views
Tags
Property features AI
Finance
- Other: Senior community
- Financial info: No land lease; Pets not allowed (per listing)
- HOA & community: Has homeowners association; Monthly HOA fee (listed): $765; HOA amenities include clubhouse, elevators, fitness center, parking, pool, tennis courts, courtesy bus, maintained community, pickleball courts, sidewalks, security, and maintenance; HOA covers cable TV, insurance, building maintenance, security, trash, water, common areas, elevator, roof repairs, and pool service
Exterior
- Parking: Assigned parking; Guest parking; Total of 1 parking space
- Security: Gated community with guard; On-site security guard
- Utilities: Public water; Public sewer; Cable available; Electricity available; Water available
- Home design: Condominium; Two-story building with one living level; Unit faces southeast
- Construction: Stucco and CBS construction; Built as part of the 'BURGUNDY' building; Roof described as 'Other'
- Exterior features: Corner lot; Waterfront property (no specific waterfront features listed); Second-floor entry
Interior
- Kitchen: Electric range; Refrigerator
- Bedrooms: One main-level bedroom
- Flooring: Tile flooring
- Bathrooms: One full bathroom; One half bathroom
- Heating & cooling: Central heating; Central air conditioning
- Interior features: No notable interior features listed
- Laundry & utility: In-unit laundry
Neighborhood map
What this means for you Summary
Snapshot
- This is a 1-bed/1.5-bath condo listed at $135k.
Deal economics
- At list price, monthly cash flow is $28 ($331/yr) — positive.
- The deal already cash-flows at list — no discount required.
- Meets the 1% rule at list price ($2k rent vs $135k).
- Cap rate 6.5% vs local median 4.3% in Delray Beach — top-decile yield for the area; either an underpriced asset or a hidden risk that comps aren't pricing in. Stress-test before assuming the spread holds.
Location & tenants
- Location reads 77/100 on livability (#202 in FL, #3,160 nationally) — a middle-class / working-renter tenant base. Strengths: housing A+, health & safety A+, commute A-; Watch: cost of living C-, crime D-, amenities F.
- Palm Beach (suburban): math 46% / reading 53% proficiency, ranked #34 of 73 in FL (top 47%) — families likely to look elsewhere, expect single-tenant / working-renter base with shorter leases.
- Zoned schools: Orchard View Elementary School (math 48% / reading 47%, grade D, #1,182 of 2,144 statewide, top 55%, 596 students, 76% FRL); Spanish River Community High School (math 64% / reading 74%, grade B, #63 of 667 statewide, top 10%, 2,578 students, 25% FRL) — zoned schools at 50% FRL track the district average.
- Market conditions: Rents rising fast (+4.3%/yr); 546 active listings in the ZIP; 40 comparable units currently listed for rent nearby; rentals at typical pace (median 25d on market — plan ~3-4 weeks tenant-placement turnaround); 3,974 units permitted in Palm Beach County in 2024 (1,012 in 5+ unit buildings).
- This rent runs 37% of the median local income ($62k/yr) — at the standard rent-burdened threshold; future hikes will face affordability resistance.
Forward outlook
- Local home prices are declining (-3.0%/yr); year-one equity from $933 of loan paydown is wiped out by about $4k of value loss. Plan a longer hold.
- Palm Beach County population projected at +30% by 2050 — long-run rental-demand tailwind backs the buy-and-hold thesis.
Negotiation context
- Only 9 days on market — expect competitive offers; lowballing is unlikely to land.
Risks & watch-outs
- Watch-outs: HOA is 32% of rent.
- Climate carrying-cost: severe wind risk, 99% chance of damaging wind over 30y; extreme-heat days projected 7→26/yr by 2055 (HVAC capex compounding) — expect insurance premiums to compound above CPI over the hold.
Questions for the listing agent
- Built in 1979 — when were the roof, HVAC, electrical panel, plumbing, and water heater last replaced?
- What does the HOA fee cover, when was the last increase, and are there any pending special assessments or reserve-fund shortfalls?
- Any open or pending special assessments — roof, HVAC, plumbing, elevator, façade? What's the per-unit balance and payoff schedule, and is the seller paying it off at close or rolling it to the buyer?
- Is there a deadline driving the sale (1031 exchange, divorce, estate, relocation)? That informs how much negotiation room exists.
- Schools are B-rated — typically a magnet for longer-tenancy family renters. What's the average tenant stay here, and is there a school-zone premium baked into asking?
- Crime grade is D in this area — have there been break-ins, vandalism, or insurance claims at this property in the last 3 years? What carrier currently insures it and at what premium?
- The area grade is low — what's the realistic commute time and amenity access for the typical tenant pool here? Any planned neighborhood developments (good or bad) we should know about?
- What's the average days-on-market for RENTAL listings here right now (not sales)? A rising rental-DOM trend means longer vacancies and softer asking-rent achievability than the comps imply.
- What's the recent tenant-quality profile in this submarket — average credit score on applications, eviction rate, late-payment / NSF rate, and stable-employment percentage? A property-management company in the area should have these aggregated.
- How much new apartment / multifamily construction is in the pipeline within 1–3 miles? Heavy new supply (>2% of stock underway) typically softens rents 12–24 months out; light construction supports rent growth.
Investment metrics
- 1% rule
- 1.44% ✓
- Cap rate
- 6.54%
- Cash-on-cash
- 0.88%
- DSCR
- 1.04
- GRM
- 5.8
CMA / ARV
No comps found within radius.
Projected returns pro-forma
-3.0% appreciation · 4.28% rent growth · sell at horizon
- IRR
- -12.3%
- Equity multiple
- 0.54×
- Total profit
- $-17,206
- Equity at exit
- $20,129
- IRR
- -0.2%
- Equity multiple
- 0.99×
- Total profit
- $-509
- Equity at exit
- $11,672
Cash invested: $37,800 (down + closing). Projections, not guarantees.
Landlord ↔ Tenant lean methodology
- Overall (STATE)
- 87 Strongly Landlord-Friendly
- State Florida
- 87 Strongly Landlord-Friendly · R+3
- County
- — inherits STATE
- City
- — inherits STATE
ZIP-level market 33484
- Rents YoY
- 4.3%
- Active inventory
- 546
- Price-to-rent
- 5.8×
Monthly cashflow live
- Estimated rent
- $1,941 high interval (Pro) →
- Mortgage (P&I)
- −$708
- Tax from tax record
- −$114 /mo · $1,364/yr
- Insurance
- −$56
- HOA
- −$628
- Vacancy / Maint / Mgmt
- −$408
- Net cashflow
- $28
Break-even live
UW: 25.0% down · 7.5% · 30yr · 1.5% tax · 5.0% vac · 8.0% maint · 8.0% mgmt
Financing live
Cash to close
- Down payment
- $33,750
- Closing costs
- $4,050
- Reserves months
- —
- Total cash needed
- —
Loan-product check · same deal, 3 products live
Conventional
25% down · 7.5% · 30yr
- Down + closing
- —
- Monthly P&I
- —
- Monthly cashflow
- —
- DSCR
- —
- Eligible?
- —
Personal DTI + credit; lowest rate.
DSCR
20% down · 8.5% · 30yr
- Down + closing
- —
- Monthly P&I
- —
- Monthly cashflow
- —
- DSCR
- —
- Eligible?
- —
No personal income docs; deal must DSCR.
Hard money
10% down · 12.0% · 12mo
- Down + closing
- —
- Monthly P&I
- —
- Monthly cashflow
- —
- DSCR
- —
- Eligible?
- —
Short-term bridge; refi at stabilization.
Rent comps 40 comps
| Address | Beds | Baths | Sqft | Rent | $/sqft | DOM | Units | Dist |
|---|---|---|---|---|---|---|---|---|
| 468 Capri J Delray Beach, FL | 2.0 | 2.0 | 910 | $1,400 | $1.54 | 24d | 1 | 0.11mi |
| 66 Capri B #66 Delray Beach, FL | 2.0 | 2.0 | 910 | $2,000 | $2.20 | 18d | 1 | 0.12mi |
| 949 Normandy Trl Unit 949 Delray Beach, FL | 2.0 | 2.0 | 907 | $3,500 | $3.86 | 24d | 1 | 0.13mi |
| 998 Normandy Trl Unit 998 Delray Beach, FL | 2.0 | 2.0 | 907 | $1,800 | $1.98 | 24d | 1 | 0.13mi |
| 998 Normandy Trl Unit 998 Delray Beach, FL | 2.0 | 2.0 | 907 | $1,800 | $1.98 | 15d | 1 | 0.13mi |
| 481 Burgundy K Delray Beach, FL | 2.0 | 2.0 | 902 | $1,700 | $1.88 | 24d | 1 | 0.13mi |
| 115 Capri B Unit 115 Delray Beach, FL | 2.0 | 2.0 | 1044 | $2,000 | $1.92 | 24d | 1 | 0.14mi |
| 930 Normandy T Delray Beach, FL | 1.0 | 1.5 | 760 | $2,800 | $3.68 | 7d | 1 | 0.14mi |
| 812 Burgundy Q Delray Beach, FL | 2.0 | 2.0 | 907 | $1,799 | $1.98 | 24d | 1 | 0.14mi |
| 66 Capri B Unit B Delray Beach, FL | 2.0 | 2.0 | 910 | $2,000 | $2.20 | 14d | 1 | 0.15mi |
| 207 Capri E #207 Delray Beach, FL | 2.0 | 2.0 | 910 | $1,700 | $1.87 | 7d | 1 | 0.16mi |
| 509 Capri Dr Unit 509 Delray Beach, FL | 2.0 | 2.0 | 910 | $2,500 | $2.75 | 2d | 1 | 0.18mi |
| 507 Capri Dr Delray Beach, FL | 2.0 | 2.0 | 910 | $2,200 | $2.42 | 24d | 1 | 0.18mi |
| 767 Burgundy P Delray Beach, FL | 2.0 | 2.0 | 902 | $1,550 | $1.72 | 24d | 1 | 0.18mi |
| 519 Burgundy K Delray Beach, FL | 1.0 | 1.5 | 760 | $2,400 | $3.16 | 24d | 1 | 0.18mi |
| 313 Burgundy G Delray Beach, FL | 2.0 | 2.0 | 907 | $2,050 | $2.26 | 24d | 1 | 0.18mi |
| 548 Burgundy L Delray Beach, FL | 2.0 | 2.0 | 902 | $1,900 | $2.11 | 7d | 1 | 0.18mi |
| 416 Burgundy N Unit I Delray Beach, FL | 1.0 | 1.5 | 760 | $2,100 | $2.76 | 24d | 1 | 0.19mi |
| 542 Normandy Ln Unit 542 Delray Beach, FL | 2.0 | 2.0 | 907 | $1,600 | $1.76 | 24d | 1 | 0.19mi |
| 98 Capri C Delray Beach, FL | 1.0 | 1.5 | 795 | $1,695 | $2.13 | 24d | 1 | 0.19mi |
| 39 Burgundy a Delray Beach, FL | 2.0 | 2.0 | 902 | $1,400 | $1.55 | 24d | 1 | 0.23mi |
| 29 Burgundy a Delray Beach, FL | 2.0 | 2.0 | 902 | $1,800 | $2.00 | 24d | 1 | 0.23mi |
| 522 Capri K Unit K Delray Beach, FL | 1.0 | 1.5 | 730 | $1,350 | $1.85 | 24d | 1 | 0.23mi |
| 452 Normandy J Unit J Delray Beach, FL | 2.0 | 2.0 | 907 | $1,600 | $1.76 | 24d | 1 | 0.25mi |
| 452 Normandy J Delray Beach, FL | 2.0 | 2.0 | 907 | $1,600 | $1.76 | 24d | 1 | 0.25mi |
| 595 Normandy M Delray Beach, FL | 2.0 | 2.0 | 907 | $1,750 | $1.93 | 24d | 1 | 0.26mi |
| 556 Capri L Unit L Delray Beach, FL | 2.0 | 2.0 | 910 | $1,575 | $1.73 | 24d | 1 | 0.26mi |
| 560 Capri Ln Delray Beach, FL | 1.0 | 1.5 | 760 | $1,500 | $1.97 | 24d | 1 | 0.27mi |
| 974 Normandy Trl #974 Delray Beach, FL | 2.0 | 2.0 | 907 | $1,800 | $1.98 | 24d | 1 | 0.28mi |
| 5220 Las Verdes Cir #101 Delray Beach, FL | 2.0 | 2.0 | 876 | $1,950 | $2.23 | 5d | 1 | 0.33mi |
| 794 Normandy Q Delray Beach, FL | 2.0 | 2.0 | 907 | $1,800 | $1.98 | 17d | 1 | 0.33mi |
| 5220 Las Verdes Cir Delray Beach, FL | 2.0 | 2.0 | 963 | $1,825 | $1.90 | 22d | 2 | 0.34mi |
| 960 Flanders T Delray Beach, FL | 1.0 | 1.5 | 760 | $1,500 | $1.97 | 24d | 1 | 0.36mi |
| 120 Normandy C Delray Beach, FL | 1.0 | 1.5 | 760 | $1,495 | $1.97 | 7d | 1 | 0.36mi |
| 5190 Las Verdes Cir #315 Delray Beach, FL | 2.0 | 2.0 | 930 | $2,000 | $2.15 | 7d | 1 | 0.37mi |
| 15235 Lakes of Delray Blvd #299 Delray Beach, FL | 2.0 | 2.0 | 900 | $1,975 | $2.19 | 18d | 1 | 0.40mi |
| 811 Flanders Q Delray Beach, FL | 2.0 | 2.0 | 920 | $1,700 | $1.85 | 14d | 1 | 0.40mi |
| 811 Flanders Q Delray Beach, FL | 2.0 | 2.0 | 920 | $1,700 | $1.85 | 3d | 1 | 0.40mi |
| 5310 Las Verdes Cir #106 Delray Beach, FL | 2.0 | 2.0 | 1050 | $1,900 | $1.81 | 24d | 1 | 0.43mi |
| 5299 Copperleaf Cir Delray Beach, FL | 2.0 | 2.0 | 1070 | $2,000 | $1.87 | 24d | 1 | 0.43mi |
HOA detail condo
- Monthly dues
- $628 · $7,536/yr
- Likely covers
- poolgym
- Assessments
- None detected in remarks — confirm with the listing agent.
Listing history 7 events
-
2026-06-18days on market $135,000 Active 9 DOM
-
2026-06-17days on market $135,000 Active 8 DOM
-
2026-06-16days on market $135,000 Active 7 DOM
-
2026-06-15days on market $135,000 Active 6 DOM
-
2026-06-13days on market $135,000 Active 4 DOM
-
2026-06-10remarks 699-char remark
-
2026-06-10$135,000 Active 1 DOM
ⓘ Source: listings_history table (triggers on properties + properties_extension) + one-shot
backfill from property_details.listing_events for pre-trigger history.
Tax reassessment forecast FL · Resets to sale price
- Current annual tax
- $1,364 · $114/mo
- Projected year-2 tax
- $1,364 · $114/mo
- Expected delta
- $0/yr ($0/mo · 0.0%)
ⓘ Screening estimate from a state-policy table — verify with the county assessor before closing.
Climate risk First Street
- Flood 1/10 Low FEMA zone X (unshaded) · 0% chance over 30 yrs
- Wildfire 1/10 Low
- Heat 9/10 Extreme 7 d/yr ≥106°F today · 26 d/yr by 30 yrs out
- Wind 10/10 Extreme 99% chance of damaging wind over 30 yrs
- Air quality 3/10 Moderate 2 unhealthy d/yr today · 3 by 30 yrs out
Nearby sold comps map
Loading sold comps map…
Walkable amenities ~0.75 mi
Loading nearby amenities…
Taxation est. · year 1
- Rental income
- $23,293
- − Mortgage interest
- −$7,562
- − Property taxes
- −$1,364
- − Insurance
- −$675
- − Repairs & maintenance
- −$1,863
- − Management
- −$1,863
- − HOA
- −$7,536
- − Depreciation
- −$3,927
- Taxable loss
- −$1,498
- Est. tax savings @ 24.0%
- +$360
- After-tax cash flow
- $691/yr
For passive investors: Depreciation is non-cash, so a rental often shows a tax loss while cash-flowing — sheltering income. Rental losses are passive: they offset passive income freely, and up to $25,000/yr can offset ordinary (W-2) income if you actively participate and your MAGI is under $100k (phasing out to $0 by $150k); unused losses carry forward. On sale, claimed depreciation is recaptured at up to 25%, and gains may owe capital-gains tax (a 1031 exchange can defer both). Figures are a year-1 estimate at your 24.0% rate — not tax advice; consult a CPA.
Schools (NCES district)
- District
- Palm Beach
- NCES district ID
- 1201500
- Math proficiency
- 46% ▼ -16.00%
- Reading proficiency
- 53% ▼ -4.00%
- Median HH income
- $53,943
- Composite
- 42.72/100
- National rank
- #3160
- State rank
- #34 of 73 in FL
Livability — Delray Beach
- Score
- 77/100
- State rank
- #202
- US rank
- #3160
Category grades
Schools grade is shown separately in the Schools card above.
Census & demographics
- County
- Palm Beach County · 1,438,312 people
- City population
- 123,167
- Metro
- Miami-Fort Lauderdale-Pompano Beach, FL
- Population (ZIP)
- 26,208
- Household income
- $62,151
- Rent vs Own
- Severe rent burden
- 991.0
Population outlook (Palm Beach County) Hauer SSP2
- Today (2025)
- 1,637,487 people
- By 2030
- 1,743,255 · +6.5%
- By 2040
- 1,948,712 · +19.0%
- By 2050
- 2,132,979 · +30.3%
- By 2075
- 2,530,027 · +54.5%
- By 2100
- 2,706,979 · +65.3%
Race, ethnicity, and origin ACS 2023
- Neighborhood character
- Predominantly White (74%)
- Race & ethnicity
- White 74% Hispanic / Latino 14% Two or more races 10% Black 5% Asian 2%
- Hispanic origin (detail)
- Puerto Rican 2% Cuban 2%
- Common ancestry
- Scotch-Irish 7% Romanian 6% Italian 2%
- Foreign-born
- 23% · Canada, Jamaica, China
- Languages at home
- 76% English-only · Spanish 13% Russian/Polish/Slavic 3% French/Haitian/Cajun 3%
Political lean MEDSL · Palm Beach
- 2024 margin
- Toss-up / Even · D 50.0% · R 49.2%
- 2008→2024 swing
- -22.1pp toward R · 2008: 22.9pp · 2024: 0.8pp
- All cycles
- 2024: D+0.8 2020: D+12.8 2016: D+15.3 2012: D+17.0 2008: D+22.9
Not yet ingested
- Civics
- —
Market trends
- HPI YoY
- ▼ -232.73%
- Current HPI
- 254.5016
- Rent YoY
- ▲ 4.28%
- Metro
- Miami-Fort Lauderdale-Pompano Beach, FL
- State GDP YoY
- ▲ 3.28%
- F500 in state
- 36
Industry mix (Fortune 500 HQ in FL)
| Industry | F500 HQs | Revenue |
|---|---|---|
| Industrial Technology | 2 | $29B |
|
||
| Insurance | 2 | $17B |
|
||
| Retail | 1 | $60B |
|
||
| Technology Distribution | 1 | $58B |
|
||
| Homebuilding | 1 | $35B |
|
||
| Technology Manufacturing | 1 | $35B |
|
||
Price history
1 event — show timeline
- 2026-06-09 Listed $135,000 Beaches MLS
Property tax history
+14.1%/yrLatest (2025): $1,364 · -16.4% YoY. Source: county tax records.
Cash-flow waterfall
monthlySold comps — $/sqft
last 12 mo · ≤1 miLoading sold comps…