3767 McBroom Chapel Rd · Cookeville, TN
Flood risk 1/10 · Minimal
- FEMA flood zone
- X (unshaded)
- Chance of flooding over 30 yrs
- 0.0%
- Est. flood insurance / yr
- $507 – $1,088
Fire risk 3/10 · Minor
- Est. fire insurance / yr
- $949 – $1,763
Heat risk 5/10 · Moderate
- Hot days now (above 103°F)
- 7 days/yr
- Hot days in 30 yrs
- 20 days/yr
Wind risk 3/10 · Minor
- Chance of severe wind over 30 yrs
- 7.0%
Air-quality risk 2/10 · Minimal
- Unhealthy air days now
- 0 days/yr
- Unhealthy air days in 30 yrs
- 2 days/yr
Risk factors via First Street. Map © Google.
Why this score? — see what drove the B- grade
The composite is a weighted blend of 9 inputs, each scored 0–100. Each bar is that input's sub-score; the figure is the points it added to the 100-point composite (weight × sub-score).
- Cash flow +25.7/30.0
- ARV discount +15.0/15.0
- DSCR +8.6/10.0
- 1% rule +5.7/10.0
- Livability +3.8/5.0
- Schools +2.6/10.0
- Condition / age +2.5/5.0
- Rent growth +2.1/5.0
- Appreciation +0.0/10.0
$165,000
🖨 Deal sheet 📄 Offer letter ✓ Due diligence
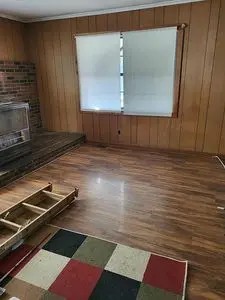
Listing remarks
Built in 1958 the first time and addition was added at each end 1971. Needs remodel it has finished drywall behind the paneling if you rather take that down. I have a quote for a total remodel new everything to get it move in ready
Key facts
- Built 1996
- Listed 23 days
Neighborhood map
What this means for you Summary
Snapshot
- This is a 4-bed/2.0-bath single-family listed at $165k.
Deal economics
- At list price, monthly cash flow is $395 ($5k/yr) — positive.
- The deal already cash-flows at list — no discount required.
- Meets the 1% rule at list price ($2k rent vs $165k).
- Recommended offer: $163k (1.5% below list) — sets the bar for market timing.
- Cap rate 9.2% vs local median 3.1% in Cookeville — top-decile yield for the area; either an underpriced asset or a hidden risk that comps aren't pricing in. Stress-test before assuming the spread holds.
Location & tenants
- Location reads 76/100 on livability (#11 in TN, #3,551 nationally) — a middle-class / working-renter tenant base. Strengths: amenities A+, cost of living A+, health & safety A+; Watch: schools D-, commute F, employment F.
- Putnam County (town): math 32% / reading 31% proficiency, ranked #49 of 139 in TN (top 35%) — families likely to look elsewhere, expect single-tenant / working-renter base with shorter leases.
- Market conditions: Rents soft (-1.4%/yr); 285 active listings in the ZIP; 700 units permitted in Putnam County in 2024 (48 in 5+ unit buildings).
- This rent runs 41% of the median local income ($52k/yr) — at the standard rent-burdened threshold; future hikes will face affordability resistance.
Forward outlook
- Local home prices are declining (-3.0%/yr); year-one equity from $1k of loan paydown is wiped out by about $5k of value loss. Plan a longer hold.
- Putnam County population projected at +16% by 2050 — long-run rental-demand tailwind backs the buy-and-hold thesis.
Negotiation context
- It's been on market 24 days — a 2% lower offer ($163k) is reasonable based on typical stale-listing flexibility.
Risks & watch-outs
- Climate carrying-cost: extreme-heat days projected 7→20/yr by 2055 (HVAC capex compounding) — expect insurance premiums to compound above CPI over the hold.
Questions for the listing agent
- Is there a deadline driving the sale (1031 exchange, divorce, estate, relocation)? That informs how much negotiation room exists.
- Schools are D-rated, which usually means shorter tenancies and higher turnover. Who's the typical renter profile here, and what's been the actual vacancy rate?
- What's the average days-on-market for RENTAL listings here right now (not sales)? A rising rental-DOM trend means longer vacancies and softer asking-rent achievability than the comps imply.
- What's the recent tenant-quality profile in this submarket — average credit score on applications, eviction rate, late-payment / NSF rate, and stable-employment percentage? A property-management company in the area should have these aggregated.
- How much new for-sale + rental construction is in the pipeline within 1–3 miles? Heavy new supply typically softens prices + rents 12–24 months out; constrained supply supports both.
Investment metrics
- 1% rule
- 1.07% ✓
- Cap rate
- 9.17%
- Cash-on-cash
- 10.27%
- DSCR
- 1.46
- GRM
- 7.8
CMA / ARV
- ARV (on-the-fly)
- $308,688
- Comps found
- 10
Show comp detail 10 sales within ~0.75 mi
| Address | Dist | Beds/Ba | Sqft | Sold | Price | $/sf | Match |
|---|---|---|---|---|---|---|---|
| 500 N Mcbroom Chapel | 0.24mi | 3/2.0 (-1) | 1,508 (+6%) | 6mo | $329,000 | $218 | 68 |
| 440 N Mcbroom Chapel Rd | 0.20mi | 3/2.0 (-1) | 1,491 (+5%) | 24mo | $325,000 | $218 | 57 |
| 3733 Shady Oak Cir | 0.39mi | 3/2.0 (-1) | 1,506 (+6%) | 12mo | $282,000 | $187 | 56 |
| 322 South Dr | 0.31mi | 3/2.0 (-1) | 1,312 (-7%) | 21mo | $260,000 | $198 | 51 |
| 113 Long Meadow Dr | 0.40mi | 3/2.0 (-1) | 1,546 (+9%) | 15mo | $338,400 | $219 | 49 |
| 182 South Dr NE | 0.56mi | 3/1.5 (-1) | 1,458 (+3%) | 16mo | $300,000 | $206 | 48 |
| 173 Tara Dr | 0.46mi | 3/1.5 (-1) | 1,226 (-13%) | 2mo | $267,900 | $219 | 48 |
| 106 Long Meadow Dr | 0.44mi | 3/1.0 (-1) | 1,274 (-10%) | 11mo | $224,500 | $176 | 45 |
| 3759 Shady Oak Cir | 0.45mi | 3/2.0 (-1) | 1,267 (-10%) | 18mo | $265,000 | $209 | 41 |
| 4320 Big Orange Dr | 0.67mi | 3/2.0 (-1) | 1,592 (+12%) | 12mo | $399,900 | $251 | 33 |
Match score weights: distance 35% · size 25% · config 20% · recency 20%. Top-matched comps best support the ARV.
Projected returns pro-forma
-3.0% appreciation · 0.0% rent growth · sell at horizon
- IRR
- -4.0%
- Equity multiple
- 0.85×
- Total profit
- $-6,787
- Equity at exit
- $24,602
- IRR
- 2.2%
- Equity multiple
- 1.14×
- Total profit
- $6,281
- Equity at exit
- $14,266
Cash invested: $46,200 (down + closing). Projections, not guarantees.
Landlord ↔ Tenant lean methodology
- Overall (STATE)
- 87 Strongly Landlord-Friendly
- State Tennessee
- 87 Strongly Landlord-Friendly · R+13
- County
- — inherits STATE
- City
- — inherits STATE
ZIP-level market 38501
- Home prices YoY
- -24.2%
- Rents YoY
- -1.4%
- Active inventory
- 285
- Price-to-rent
- 7.8×
Monthly cashflow live
- Estimated rent
- $1,765 medium interval (Pro) →
- Mortgage (P&I)
- −$865
- Tax from tax record
- −$65 /mo · $781/yr
- Insurance
- −$69
- HOA
- −$0
- Vacancy / Maint / Mgmt
- −$371
- Net cashflow
- $395
Break-even live
UW: 25.0% down · 7.5% · 30yr · 1.5% tax · 5.0% vac · 8.0% maint · 8.0% mgmt
Financing live
Cash to close
- Down payment
- $41,250
- Closing costs
- $4,950
- Reserves months
- —
- Total cash needed
- —
Loan-product check · same deal, 3 products live
Conventional
25% down · 7.5% · 30yr
- Down + closing
- —
- Monthly P&I
- —
- Monthly cashflow
- —
- DSCR
- —
- Eligible?
- —
Personal DTI + credit; lowest rate.
DSCR
20% down · 8.5% · 30yr
- Down + closing
- —
- Monthly P&I
- —
- Monthly cashflow
- —
- DSCR
- —
- Eligible?
- —
No personal income docs; deal must DSCR.
Hard money
10% down · 12.0% · 12mo
- Down + closing
- —
- Monthly P&I
- —
- Monthly cashflow
- —
- DSCR
- —
- Eligible?
- —
Short-term bridge; refi at stabilization.
Listing history 17 events
-
2026-06-19days on market $165,000 Active 24 DOM
-
2026-06-18days on market $165,000 Active 23 DOM
-
2026-06-17days on market $165,000 Active 22 DOM
-
2026-06-16days on market $165,000 Active 21 DOM
-
2026-06-15days on market $165,000 Active 20 DOM
-
2026-06-14days on market $165,000 Active 18 DOM
-
2026-06-13days on market $165,000 Active 17 DOM
-
2026-06-10days on market $165,000 Active 15 DOM
-
2026-06-09days on market $165,000 Active 14 DOM
-
2026-06-08days on market $165,000 Active 13 DOM
-
2026-06-07days on market $165,000 Active 12 DOM
-
2026-06-05days on market $165,000 Active 9 DOM
-
2026-06-02days on market $165,000 Active 7 DOM
-
2026-06-01days on market $165,000 Active 6 DOM
-
2026-05-31days on market $165,000 Active 5 DOM
-
2026-05-30days on market $165,000 Active 4 DOM
-
2026-05-26$165,000 Active
ⓘ Source: listings_history table (triggers on properties + properties_extension) + one-shot
backfill from property_details.listing_events for pre-trigger history.
Tax reassessment forecast TN · Resets to sale price
- Current annual tax
- $781 · $65/mo
- Projected year-2 tax
- $1,172 · $98/mo
- Expected delta
- +$390/yr (+$33/mo · 50.0%)
ⓘ Screening estimate from a state-policy table — verify with the county assessor before closing.
Climate risk First Street
- Flood 1/10 Low FEMA zone X (unshaded) · 0% chance over 30 yrs
- Wildfire 3/10 Moderate
- Heat 5/10 Major 7 d/yr ≥103°F today · 20 d/yr by 30 yrs out
- Wind 3/10 Moderate 7% chance of damaging wind over 30 yrs
- Air quality 2/10 Low 0 unhealthy d/yr today · 2 by 30 yrs out
Nearby sold comps map
Loading sold comps map…
Walkable amenities ~0.75 mi
Loading nearby amenities…
Taxation est. · year 1
- Rental income
- $21,182
- − Mortgage interest
- −$9,243
- − Property taxes
- −$781
- − Insurance
- −$825
- − Repairs & maintenance
- −$1,695
- − Management
- −$1,695
- − Depreciation
- −$4,800
- Taxable income
- $2,145
- Est. tax owed @ 24.0%
- −$515
- After-tax cash flow
- $4,230/yr
For passive investors: Depreciation is non-cash, so a rental often shows a tax loss while cash-flowing — sheltering income. Rental losses are passive: they offset passive income freely, and up to $25,000/yr can offset ordinary (W-2) income if you actively participate and your MAGI is under $100k (phasing out to $0 by $150k); unused losses carry forward. On sale, claimed depreciation is recaptured at up to 25%, and gains may owe capital-gains tax (a 1031 exchange can defer both). Figures are a year-1 estimate at your 24.0% rate — not tax advice; consult a CPA.
Schools (NCES district)
- District
- Putnam County
- NCES district ID
- 4703480
- Math proficiency
- 32% ▼ -6.00%
- Reading proficiency
- 31% ▼ -5.00%
- Median HH income
- $35,738
- Composite
- 26.09/100
- National rank
- #7291
- State rank
- #49 of 139 in TN
Livability — Cookeville
- Score
- 76/100
- State rank
- #11
- US rank
- #3551
Category grades
Schools grade is shown separately in the Schools card above.
Census & demographics
- County
- Putnam County · 72,571 people
- City population
- 72,571
- Metro
- Cookeville, TN
- Population (ZIP)
- 42,471
- Household income
- $52,145
- Rent vs Own
- Severe rent burden
- 2410.0
Population outlook (Putnam County) Hauer SSP2
- Today (2025)
- 80,122 people
- By 2030
- 82,798 · +3.3%
- By 2040
- 87,913 · +9.7%
- By 2050
- 92,659 · +15.6%
- By 2075
- 104,965 · +31.0%
- By 2100
- 113,256 · +41.4%
Race, ethnicity, and origin ACS 2023
- Neighborhood character
- Predominantly White (82%)
- Race & ethnicity
- White 82% Hispanic / Latino 9% Two or more races 6% Black 4% Asian 1%
- Hispanic origin (detail)
- Mexican 4%
- Common ancestry
- Serbian 2% Slovak 2% Lithuanian 2%
- Foreign-born
- 6% · Canada
- Languages at home
- 92% English-only · Spanish 5% Other Indo-European 1% French/Haitian/Cajun 1%
Political lean MEDSL · Putnam
- 2024 margin
- Solid R (+47.4) · D 25.7% · R 73.1% · Other 1.1%
- 2008→2024 swing
- -20.5pp toward R · 2008: -26.9pp · 2024: -47.4pp
- All cycles
- 2024: R+47.4 2020: R+43.4 2016: R+45.0 2012: R+37.1 2008: R+26.9
Not yet ingested
- Civics
- —
Market trends
- HPI YoY
- ▼ -91.19%
- Current HPI
- 285.6959
- Rent YoY
- ▼ -1.45%
- Metro
- Cookeville, TN
- State GDP YoY
- ▲ 2.78%
- F500 in state
- 22
Industry mix (Fortune 500 HQ in TN)
| Industry | F500 HQs | Revenue |
|---|---|---|
| Healthcare | 3 | $91B |
|
||
| Retail | 3 | $72B |
|
||
| Transportation / Logistics | 1 | $88B |
|
||
| Paper / Packaging | 1 | $19B |
|
||
| Insurance | 1 | $13B |
|
||
| Energy | 1 | $12B |
|
||
Price history
1 event — show timeline
- 2026-05-26 Listed $165,000 FSBO.com
Property tax history
+6.3%/yrLatest (2025): $781 · +0.0% YoY. Source: county tax records.
Cash-flow waterfall
monthlySold comps — $/sqft
last 12 mo · ≤1 miLoading sold comps…