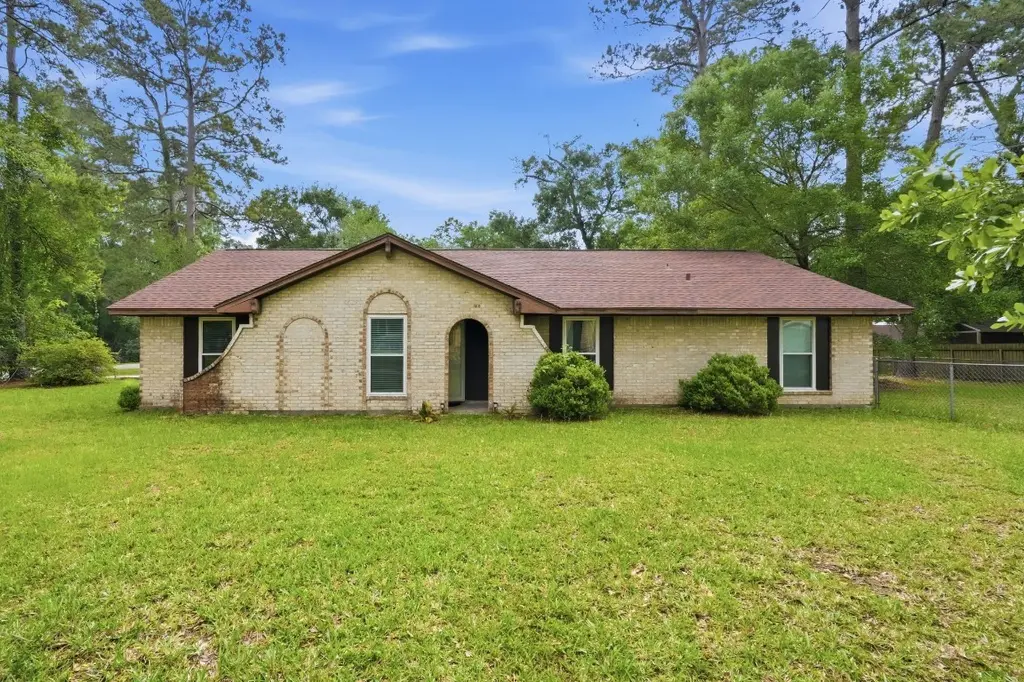
1200 Williams St · Cleveland, TX
Flood risk 1/10 · Minimal
- FEMA flood zone
- X (unshaded)
- Chance of flooding over 30 yrs
- 0.0%
- Est. flood insurance / yr
- $507 – $1,088
Fire risk 4/10 · Minor
- Est. fire insurance / yr
- $1,222 – $2,270
Heat risk 9/10 · Severe
- Hot days now (above 110°F)
- 7 days/yr
- Hot days in 30 yrs
- 24 days/yr
Wind risk 8/10 · Major
- Chance of severe wind over 30 yrs
- 99.0%
Air-quality risk 2/10 · Minimal
- Unhealthy air days now
- 1 days/yr
- Unhealthy air days in 30 yrs
- 1 days/yr
Risk factors via First Street. Map © Google.
Why this score? — see what drove the D grade
The composite is a weighted blend of 9 inputs, each scored 0–100. Each bar is that input's sub-score; the figure is the points it added to the 100-point composite (weight × sub-score).
- Cash flow +15.0/30.0
- ARV discount +5.9/15.0
- 1% rule +4.8/10.0
- DSCR +4.6/10.0
- Rent growth +3.5/5.0
- Livability +3.1/5.0
- Condition / age +2.5/5.0
- Schools +2.1/10.0
- Appreciation +0.0/10.0
$225,000
🖨 Deal sheet (PDF) 📄 Offer letter ✓ Due diligence
Listing remarks
Charming Corner-lot home in the Heart of Cleveland! Welcome to this well-maintained 4 bedroom, 2 bath home perfectly situated on a spacious corner lot. With a functional layout and plenty of room to spread out, this property is perfect for both everyday living and entertaining. Corner lot and spacious backyard, perfect for those upcoming graduation and summer gatherings! Roof replaced 2 years ago, offering added value and peace of mind. Schedule your showing today!
Key facts
- Spacious backyard
- Functional layout
- Well maintained
Tags
Property features AI
Exterior
- Security: Owned security system; Smoke detectors
- Utilities: Public sewer
- Home design: Residential property; Single-story (all main rooms listed on first floor); Corner lot
- Construction: Brick construction; Built in 1979; Composition roof; Slab foundation
- Exterior features: Fenced backyard; Porch
Interior
- Kitchen: Dishwasher; Electric cooktop; Electric oven; Microwave
- Bedrooms: Primary bedroom on the first floor; Three additional bedrooms on the first floor (total 4 rooms)
- Flooring: Laminate
- Bathrooms: 2 full bathrooms
- Heating & cooling: Central heating (electric); Central air (electric); Attic fan
- Interior features: Pantry; Ceiling fan(s); Ventilation (improved indoor air quality); Free-standing fireplace (1)
Neighborhood map
What this means for you Summary
Snapshot
- This is a 4-bed/2.0-bath single-family listed at $225k.
Deal economics
- At list price, monthly cash flow is $72 ($862/yr) — positive.
- The deal already cash-flows at list — no discount required.
- To meet the 1% rule (rent ≥ 1% of price), the offer needs to be $220k (2.3% below list).
- Recommended offer: $218k (3.0% below list) — sets the bar for market timing.
- Cap rate 6.7% vs local median 4.6% in Cleveland — top-decile yield for the area; either an underpriced asset or a hidden risk that comps aren't pricing in. Stress-test before assuming the spread holds.
Location & tenants
- Location reads 61/100 on livability (#1,013 in TX) — a middle-class / working-renter tenant base. Strengths: cost of living A+, housing A+; Watch: crime D-, amenities F, commute F.
- Cleveland ISD (town): math 24% / reading 25% proficiency, ranked #723 of 826 in TX (top 88%) — low school quality limits family demand, transient renter base, plan for 1-2y turnover; 71% free/reduced lunch — lower-income household profile, screen leases tightly.
- Zoned schools: Northside El (math 33% / reading 31%, grade F, #2,268 of 4,322 statewide, top 55%, 1,235 students, 90% FRL); Cleveland Middle (math 22% / reading 25%, grade F, #1,317 of 1,662 statewide, top 80%, 1,696 students, 98% FRL); Cleveland H S (math 30% / reading 32%, grade F, #1,077 of 1,632 statewide, top 66%, 3,310 students, 92% FRL) — zoned schools average 93% FRL vs 71% district-wide (23 pts higher); higher-poverty schools than district average — tighter screening recommended.
- Market conditions: Rents rising fast (+4.0%/yr); 1577 active listings in the ZIP; 2 comparable units currently listed for rent nearby; 1,321 units permitted in Liberty County in 2024 (0 in 5+ unit buildings).
- This rent runs 42% of the median local income ($62k/yr) — at the standard rent-burdened threshold; future hikes will face affordability resistance.
Forward outlook
- Local home prices are declining (-3.0%/yr); year-one equity from $2k of loan paydown is wiped out by about $7k of value loss. Plan a longer hold.
- Liberty County population projected at +24% by 2050 — long-run rental-demand tailwind backs the buy-and-hold thesis.
Negotiation context
- It's been on market 36 days — a 3% lower offer ($218k) is reasonable based on typical stale-listing flexibility.
- 5 sale attempts since 2y ago with the ask held roughly flat each time — persistent listings suggest the price (not the market) is what's stuck; bring a comps-based counter.
Risks & watch-outs
- Climate carrying-cost: severe wind risk, 99% chance of damaging wind over 30y; extreme-heat days projected 7→24/yr by 2055 (HVAC capex compounding) — expect insurance premiums to compound above CPI over the hold.
Questions for the listing agent
- It's been on market 36 days. Have you received any prior offers? Is the seller open to a 3% concession, seller financing, or rate buy-down credit?
- Built in 1979 — when were the roof, HVAC, electrical panel, plumbing, and water heater last replaced?
- Is there a deadline driving the sale (1031 exchange, divorce, estate, relocation)? That informs how much negotiation room exists.
- Schools are F-rated, which usually means shorter tenancies and higher turnover. Who's the typical renter profile here, and what's been the actual vacancy rate?
- Crime grade is D in this area — have there been break-ins, vandalism, or insurance claims at this property in the last 3 years? What carrier currently insures it and at what premium?
- The area grade is low — what's the realistic commute time and amenity access for the typical tenant pool here? Any planned neighborhood developments (good or bad) we should know about?
- What's the average days-on-market for RENTAL listings here right now (not sales)? A rising rental-DOM trend means longer vacancies and softer asking-rent achievability than the comps imply.
- What's the recent tenant-quality profile in this submarket — average credit score on applications, eviction rate, late-payment / NSF rate, and stable-employment percentage? A property-management company in the area should have these aggregated.
- How much new for-sale + rental construction is in the pipeline within 1–3 miles? Heavy new supply typically softens prices + rents 12–24 months out; constrained supply supports both.
Investment metrics
- 1% rule
- 0.98% ✗
- Cap rate
- 6.68%
- Cash-on-cash
- 1.37%
- DSCR
- 1.06
- GRM
- 8.5
CMA / ARV
- ARV (median comp)
- $217,491
- List price
- $225,000
- Delta
- 3.45%
- Verdict
- FAIR
- Comps
- 20 within 1.0 mi
Show comp detail 7 sales within ~0.75 mi
| Address | Dist | Beds/Ba | Sqft | Sold | Price | $/sf | Match |
|---|---|---|---|---|---|---|---|
| 407 Tanner Ave | 0.32mi | 3/2.0 (-1) | 1,922 (-5%) | 3mo | $142,900 | $74 | 70 |
| 315 Tanner Ave | 0.38mi | 3/2.5 (-1) | 1,933 (-4%) | 3mo | $219,900 | $114 | 66 |
| 670 Maria Elena Way | 0.68mi | 4/2.5 | 1,954 (-3%) | 1mo | $206,990 | $106 | 60 |
| 509 Hancock Ave | 0.19mi | 3/2.0 (-1) | 1,747 (-13%) | 9mo | $199,000 | $114 | 56 |
| 807 Garner St | 0.23mi | 3/2.0 (-1) | 1,776 (-12%) | 18mo | $224,500 | $126 | 49 |
| 4509 5914 21 | 0.68mi | 3/2.0 (-1) | 1,754 (-13%) | 3mo | $265,000 | $151 | 39 |
| 103 Rice St | 0.70mi | 4/2.0 | 2,286 (+13%) | 18mo | $288,500 | $126 | 31 |
Match score weights: distance 35% · size 25% · config 20% · recency 20%. Top-matched comps best support the ARV.
Projected returns pro-forma
-3.0% appreciation · 4.0% rent growth · sell at horizon
- IRR
- -12.9%
- Equity multiple
- 0.53×
- Total profit
- $-29,550
- Equity at exit
- $33,548
- IRR
- -2.3%
- Equity multiple
- 0.84×
- Total profit
- $-10,075
- Equity at exit
- $19,454
Cash invested: $63,000 (down + closing). Projections, not guarantees.
Landlord ↔ Tenant lean methodology
- Overall (STATE)
- 87 Strongly Landlord-Friendly
- State Texas
- 87 Strongly Landlord-Friendly · R+5
- County
- — inherits STATE
- City
- — inherits STATE
ZIP-level market 77327
- Home prices YoY
- -5.2%
- Rents YoY
- 4.0%
- Active inventory
- 1577
- Price-to-rent
- 8.5×
Monthly cashflow live
- Estimated rent
- $2,199 medium interval (Pro) →
- Mortgage (P&I)
- −$1,180
- Tax from tax record
- −$392 /mo · $4,699/yr
- Insurance
- −$94
- HOA
- −$0
- Vacancy / Maint / Mgmt
- −$462
- Net cashflow
- $72
Break-even live
Sensitivity live
| Price | -10% $199 | -5% $136 | +0% $72 | +5% $8 | +10% $-56 |
|---|---|---|---|---|---|
| Rent | -10% $-102 | -5% $-15 | +0% $72 | +5% $159 | +10% $246 |
| Rate | -1.0pp $185 | -0.5pp $129 | base $72 | +0.5pp $14 | +1.0pp $-46 |
UW: 25.0% down · 7.5% · 30yr · 1.5% tax · 5.0% vac · 8.0% maint · 8.0% mgmt
Financing live
Cash to close
- Down payment
- $56,250
- Closing costs
- $6,750
- Reserves months
- —
- Total cash needed
- —
Loan-product check · same deal, 3 products live
Conventional
25% down · 7.5% · 30yr
- Down + closing
- —
- Monthly P&I
- —
- Monthly cashflow
- —
- DSCR
- —
- Eligible?
- —
Personal DTI + credit; lowest rate.
DSCR
20% down · 8.5% · 30yr
- Down + closing
- —
- Monthly P&I
- —
- Monthly cashflow
- —
- DSCR
- —
- Eligible?
- —
No personal income docs; deal must DSCR.
Hard money
10% down · 12.0% · 12mo
- Down + closing
- —
- Monthly P&I
- —
- Monthly cashflow
- —
- DSCR
- —
- Eligible?
- —
Short-term bridge; refi at stabilization.
Rent comps 2 comps
| Address | Beds | Baths | Sqft | Rent | $/sqft | DOM | Units | Dist |
|---|---|---|---|---|---|---|---|---|
| 909 Jefferson Ave Cleveland, TX | 3.0 | 2.0 | 1600 | $1,870 | $1.17 | 0d | 1 | 0.26mi |
| 11040 Pelican Hill Ln Cleveland, TX | 5.0 | 3.0 | 2600 | $2,200 | $0.85 | 4d | 1 | 1.10mi |
Listing history 19 events
-
2026-06-21days on market $225,000 Active 36 DOM
-
2026-06-18days on market $225,000 Active 33 DOM
-
2026-06-17days on market $225,000 Active 32 DOM
-
2026-06-16days on market $225,000 Active 31 DOM
-
2026-06-15days on market $225,000 Active 30 DOM
-
2026-06-13statusdays on market $225,000 Active 28 DOM
-
2026-06-10status $225,000 Active Under Contract 24 DOM
-
2026-05-01$225,000 Active 470-char remark
-
2026-03-23historical
-
2026-02-24price $220,000
-
2026-02-07$230,000 Active
-
2025-05-28historical
-
2025-05-23status Active
-
2025-05-16historical
-
2025-02-12price $225,000
-
2025-01-20price $230,000
-
2025-01-11price $241,000
-
2024-12-10$246,000 Active
-
2000-08-16soldstatus
ⓘ Source: listings_history table (triggers on properties + properties_extension) + one-shot
backfill from property_details.listing_events for pre-trigger history.
Tax reassessment forecast TX · Resets to sale price
- Current annual tax
- $4,699 · $392/mo
- Projected year-2 tax
- $4,699 · $392/mo
- Expected delta
- $0/yr ($0/mo · 0.0%)
ⓘ Screening estimate from a state-policy table — verify with the county assessor before closing.
Climate risk First Street
- Flood 1/10 Low FEMA zone X (unshaded) · 0% chance over 30 yrs
- Wildfire 4/10 Moderate
- Heat 9/10 Extreme 7 d/yr ≥110°F today · 24 d/yr by 30 yrs out
- Wind 8/10 Severe 99% chance of damaging wind over 30 yrs
- Air quality 2/10 Low 1 unhealthy d/yr today · 1 by 30 yrs out
Nearby sold comps map
Loading sold comps map…
Walkable amenities ~0.75 mi
Loading nearby amenities…
Taxation est. · year 1
- Rental income
- $26,386
- − Mortgage interest
- −$12,603
- − Property taxes
- −$4,699
- − Insurance
- −$1,125
- − Repairs & maintenance
- −$2,111
- − Management
- −$2,111
- − Depreciation
- −$6,545
- Taxable loss
- −$2,809
- Est. tax savings @ 24.0%
- +$674
- After-tax cash flow
- $1,536/yr
For passive investors: Depreciation is non-cash, so a rental often shows a tax loss while cash-flowing — sheltering income. Rental losses are passive: they offset passive income freely, and up to $25,000/yr can offset ordinary (W-2) income if you actively participate and your MAGI is under $100k (phasing out to $0 by $150k); unused losses carry forward. On sale, claimed depreciation is recaptured at up to 25%, and gains may owe capital-gains tax (a 1031 exchange can defer both). Figures are a year-1 estimate at your 24.0% rate — not tax advice; consult a CPA.
Schools (NCES district)
- District
- Cleveland ISD
- NCES district ID
- 4814370
- Math proficiency
- 24% ▼ -13.00%
- Reading proficiency
- 25% ▼ -4.00%
- Median HH income
- $39,173
- Composite
- 20.61/100
- National rank
- #8549
- State rank
- #723 of 826 in TX
Livability — Cleveland
- Score
- 61/100
- State rank
- #1013
- US rank
- #17943
Category grades
Schools grade is shown separately in the Schools card above.
Census & demographics
- Census place
- Cleveland, TX
- County
- Liberty County · 82,189 people
- City population
- 17,208
- Metro
- Houston-The Woodlands-Sugar Land, TX
- Population (ZIP)
- 42,685
- Household income
- $62,219
- Rent vs Own
- Severe rent burden
- 437.0
Population outlook (Liberty County) Hauer SSP2
- Today (2025)
- 87,956 people
- By 2030
- 92,161 · +4.8%
- By 2040
- 100,784 · +14.6%
- By 2050
- 109,471 · +24.5%
- By 2075
- 133,470 · +51.7%
- By 2100
- 147,372 · +67.6%
Race, ethnicity, and origin ACS 2023
- Neighborhood character
- Diverse neighborhood (Simpson 0.57)
- Race & ethnicity
- Hispanic / Latino 54% White 36% Two or more races 18% Black 8% Native American 2%
- Hispanic origin (detail)
- Mexican 42%
- Common ancestry
- Lithuanian 2% Serbian 1% Slovak 0%
- Foreign-born
- 22% · Canada
- Languages at home
- 51% English-only · Spanish 48%
Political lean MEDSL · Liberty
- 2024 margin
- Solid R (+61.6) · D 19.0% · R 80.6%
- 2008→2024 swing
- -17.9pp toward R · 2008: -43.7pp · 2024: -61.6pp
- All cycles
- 2024: R+61.6 2020: R+59.7 2016: R+58.0 2012: R+53.3 2008: R+43.7
Not yet ingested
- Civics
- —
Market trends
- HPI YoY
- ▼ -12.39%
- Current HPI
- 224.9222
- Rent YoY
- ▲ 4.00%
- Metro
- Houston-The Woodlands-Sugar Land, TX
- State GDP YoY
- ▲ 3.95%
- F500 in state
- 110
Industry mix (Fortune 500 HQ in TX)
| Industry | F500 HQs | Revenue |
|---|---|---|
| Energy | 16 | $1,198B |
|
||
| Technology | 5 | $198B |
|
||
| Engineering / Construction | 4 | $72B |
|
||
| Energy Services | 3 | $60B |
|
||
| Utilities | 3 | $41B |
|
||
| Healthcare | 2 | $330B |
|
||
Price history
-8.5% since first listed16 events — show timeline
- 2026-06-13 Relisted — HARMLS
- 2026-06-09 Contingent — HARMLS
- 2026-05-26 Pending — HARMLS
- 2026-05-20 Pending — HARMLS
- 2026-05-01 Listed $225,000 HARMLS
- 2026-03-23 Listing Removed — HARMLS
- 2026-02-24 Price Changed $220,000 HARMLS
- 2026-02-07 Listed $230,000 HARMLS
- 2025-05-28 Listing Removed — HARMLS
- 2025-05-23 Relisted — HARMLS
- 2025-05-16 Listing Removed — HARMLS
- 2025-02-12 Price Changed $225,000 HARMLS
- 2025-01-20 Price Changed $230,000 HARMLS
- 2025-01-11 Price Changed $241,000 HARMLS
- 2024-12-10 Listed $246,000 HARMLS
- 2000-08-16 Sold (Public Records) — Public Records
Property tax history
+6.4%/yrLatest (2025): $4,699 · +3.7% YoY. Source: county tax records.
Cash-flow waterfall
monthlySold comps — $/sqft
last 12 mo · ≤1 miLoading sold comps…