 5-Plex
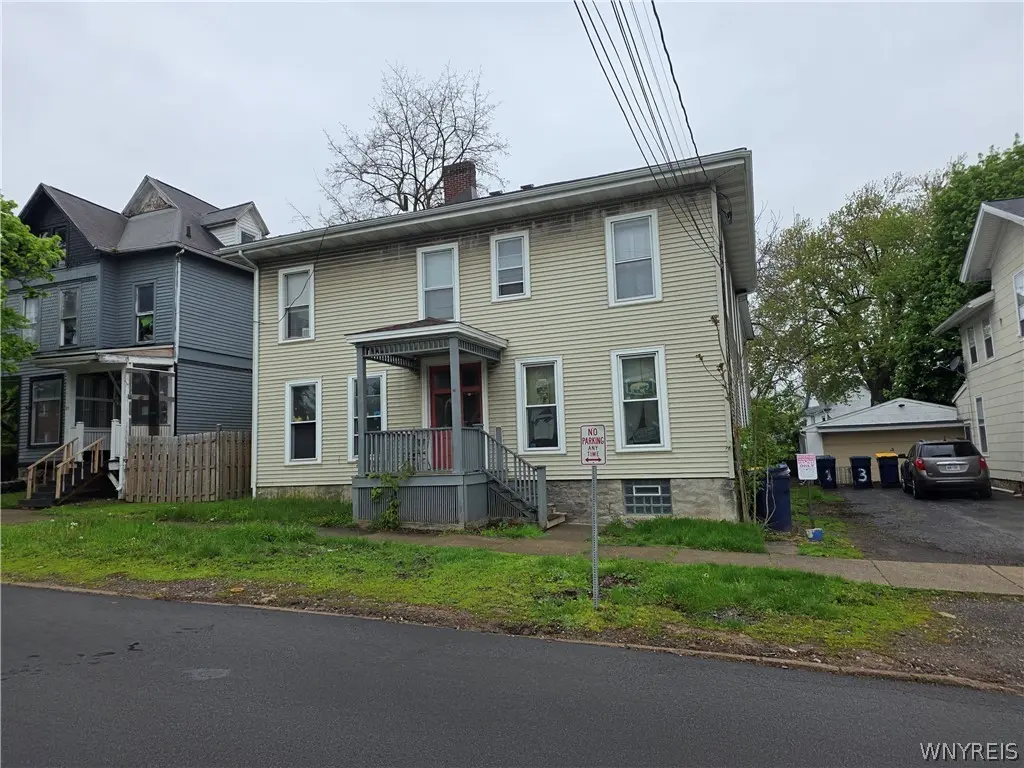
89 Pine St · Lockport, NY
Flood risk 1/10 · Minimal
- FEMA flood zone
- X
- Chance of flooding over 30 yrs
- 0.0%
- Est. flood insurance / yr
- $508 – $851
Fire risk 1/10 · Minimal
- Est. fire insurance / yr
- $691 – $1,283
Heat risk 2/10 · Minimal
- Hot days now (above threshold)
- 7 days/yr
- Hot days in 30 yrs
- 15 days/yr
Wind risk No data
- Chance of severe wind over 30 yrs
- —
Air-quality risk 2/10 · Minimal
- Unhealthy air days now
- 1 days/yr
- Unhealthy air days in 30 yrs
- 2 days/yr
Risk factors via First Street. Map © Google.
Why this score? — see what drove the B grade
The composite is a weighted blend of 9 inputs, each scored 0–100. Each bar is that input's sub-score; the figure is the points it added to the 100-point composite (weight × sub-score).
- Cash flow +30.0/30.0
- 1% rule +10.0/10.0
- DSCR +10.0/10.0
- ARV discount +7.5/15.0
- Schools +3.9/10.0
- Livability +3.8/5.0
- Rent growth +3.4/5.0
- Condition / age +2.5/5.0
- Appreciation +0.0/10.0
$234,500
🖨 Deal sheet 📄 Offer letter ✓ Due diligence
Multi-family units
County records classify this as Multi-Family (5+ Unit). Listing-text estimate: 5 units. confirmed
5+ unit building — per-unit beds/baths from public records are typically unavailable; the breakdown below (if shown) is an estimate from the listing text.
Listing remarks
Excellent investment opportunity in the City of Lockport! This well-maintained 5-unit multi-family property is a valuable addition to any investor’s portfolio. Featuring three 1-bedroom apartments and two studio units, the property offers a strong unit mix with consistent rental appeal. Conveniently located near local shopping, dining, and everyday amenities, tenants will appreciate the accessibility and convenience of city living. This income-producing property also includes existing framework for a potential sixth unit, creating an opportunity for additional cash flow with estimated rental income of approximately $800 per month. Current gross monthly rents total $3,725, with contrac
Key facts
- Strong unit mix
- 3,920 sq ft lot
- Built 1880
Tags
Property features AI
Finance
- Other: Five total units; Five separate gas meters and one electric meter
- Financial info: Owner pays electricity and water for rental units; Operating expenses may include accounting, electric, insurance, management, maintenance (structure and general), professional management, trash, and utilities
Exterior
- Parking: No driveway; No garage
- Utilities: Public water connected; Sewer connected; Cable available; High-speed internet available
- Home design: Two-story building; Existing construction
- Construction: Vinyl siding; Asphalt roof
- Exterior features: Open porch; Patio/porch with open porch; Rectangular residential lot; City street frontage
Interior
- Kitchen: Free-standing range; Oven; Refrigerator
- Flooring: Laminate; Vinyl; Varies
- Heating & cooling: Gas forced-air heating
- Interior features: Full basement; See remarks for additional exterior/interior details
- Laundry & utility: Gas water heater
Neighborhood map
What this means for you Summary
Snapshot
- This is a 3×1bd/1ba + 2×?bd/1ba units multifamily listed at $234k.
Deal economics
- At list price, monthly cash flow is $2k ($29k/yr) — positive. Per door: $487/mo.
- The deal already cash-flows at list — no discount required.
- Meets the 1% rule at list price ($5k rent vs $234k).
- Recommended offer: $227k (3.0% below list) — sets the bar for market timing.
- Cap rate 18.8% vs local median 4.5% in Lockport — top-decile yield for the area; either an underpriced asset or a hidden risk that comps aren't pricing in. Stress-test before assuming the spread holds.
Location & tenants
- Location reads 76/100 on livability (#232 in NY, #3,669 nationally) — a middle-class / working-renter tenant base. Strengths: amenities A+, cost of living A+, housing A+; Watch: commute D+, crime F, employment D-.
- Lockport City School District (town): math 44% / reading 49% proficiency, ranked #452 of 590 in NY (top 77%) — families likely to look elsewhere, expect single-tenant / working-renter base with shorter leases.
- Market conditions: Rents rising (+3.7%/yr); 357 active listings in the ZIP; solid renter incomes; 167 units permitted in Niagara County in 2024 (0 in 5+ unit buildings).
- At $5,127/mo this rent would consume 82% of the median local household income ($75k/yr) (locally 1112% of renters already pay >50% of income on rent) — very limited rent-growth headroom before tenants either downsize or default.
Forward outlook
- Local home prices are declining (-3.0%/yr); year-one equity from $2k of loan paydown is wiped out by about $7k of value loss. Plan a longer hold.
- Niagara County population projected at -19% by 2050 — secular population decline; favor cash flow + early exit over multi-decade hold.
- At projected returns (-3.0% appreciation + 3.7% rent growth), your $66k cash investment doubles in ~3 years — after that, you're playing with house money.
Negotiation context
- It's been on market 34 days — a 3% lower offer ($227k) is reasonable based on typical stale-listing flexibility.
- 6 sale attempts since 11y ago with the ask held roughly flat each time — persistent listings suggest the price (not the market) is what's stuck; bring a comps-based counter.
- Current owner paid $166k; 41% above their basis — modest negotiation headroom, anchor on the comps not their cost.
Risks & watch-outs
- Watch-outs: built in 1880 — expect roof / HVAC / electrical / plumbing capex.
Questions for the listing agent
- It's been on market 34 days. Have you received any prior offers? Is the seller open to a 3% concession, seller financing, or rate buy-down credit?
- Can we see the unit-by-unit rent roll, current vacancy, and any below-market leases? What's the average tenancy length?
- What capital expenditures (roof, boiler, parking lot, exteriors) have been made in the last 5 years, and what's planned in the next 2?
- Built in 1880 — when were the roof, HVAC, electrical panel, plumbing, and water heater last replaced?
- Is there a deadline driving the sale (1031 exchange, divorce, estate, relocation)? That informs how much negotiation room exists.
- Schools are B-rated — typically a magnet for longer-tenancy family renters. What's the average tenant stay here, and is there a school-zone premium baked into asking?
- Crime grade is F in this area — have there been break-ins, vandalism, or insurance claims at this property in the last 3 years? What carrier currently insures it and at what premium?
- What's the average days-on-market for RENTAL listings here right now (not sales)? A rising rental-DOM trend means longer vacancies and softer asking-rent achievability than the comps imply.
- What's the recent tenant-quality profile in this submarket — average credit score on applications, eviction rate, late-payment / NSF rate, and stable-employment percentage? A property-management company in the area should have these aggregated.
- How much new apartment / multifamily construction is in the pipeline within 1–3 miles? Heavy new supply (>2% of stock underway) typically softens rents 12–24 months out; light construction supports rent growth.
Investment metrics
- 1% rule
- 2.19% ✓
- Cap rate
- 18.75%
- Cash-on-cash
- 44.51%
- DSCR
- 2.98
- GRM
- 3.8
CMA / ARV
No comps found within radius.
Projected returns pro-forma
-3.0% appreciation · 3.67% rent growth · sell at horizon
- IRR
- 42.3%
- Equity multiple
- 2.84×
- Total profit
- $120,653
- Equity at exit
- $34,965
- IRR
- 48.7%
- Equity multiple
- 5.87×
- Total profit
- $319,550
- Equity at exit
- $20,275
Cash invested: $65,660 (down + closing). Projections, not guarantees.
Landlord ↔ Tenant lean methodology
- Overall (STATE)
- 15 Strongly Tenant-Friendly
- State New York
- 15 Strongly Tenant-Friendly · D+10
- County
- — inherits STATE
- City
- — inherits STATE
ZIP-level market 14094
- Rents YoY
- 3.7%
- Active inventory
- 357
- Price-to-rent
- 18.8×
Monthly cashflow live
- Estimated rent
- $5,127 medium interval (Pro) →
- Mortgage (P&I)
- −$1,230
- Tax from tax record
- −$288 /mo · $3,452/yr
- Insurance
- −$98
- HOA
- −$0
- Vacancy / Maint / Mgmt
- −$1,077
- Net cashflow
- $2,435
Break-even live
5-unit breakdown (identical units grouped — click to expand)
| Units | Beds | Baths | Est. rent |
|---|---|---|---|
| 3× units | 1 | 1 | $3,111 |
| #1 | 1 | 1 | $1,037 |
| #2 | 1 | 1 | $1,037 |
| #3 | 1 | 1 | $1,037 |
| 2× units | 0 | 1 | $2,016 |
| #4 | 0 | 1 | $1,008 |
| #5 | 0 | 1 | $1,008 |
| Total (5 units) | $5,127 | ||
UW: 25.0% down · 7.5% · 30yr · 1.5% tax · 5.0% vac · 8.0% maint · 8.0% mgmt
Financing live
Cash to close
- Down payment
- $58,625
- Closing costs
- $7,035
- Reserves months
- —
- Total cash needed
- —
Loan-product check · same deal, 3 products live
Conventional
25% down · 7.5% · 30yr
- Down + closing
- —
- Monthly P&I
- —
- Monthly cashflow
- —
- DSCR
- —
- Eligible?
- —
Personal DTI + credit; lowest rate.
DSCR
20% down · 8.5% · 30yr
- Down + closing
- —
- Monthly P&I
- —
- Monthly cashflow
- —
- DSCR
- —
- Eligible?
- —
No personal income docs; deal must DSCR.
Hard money
10% down · 12.0% · 12mo
- Down + closing
- —
- Monthly P&I
- —
- Monthly cashflow
- —
- DSCR
- —
- Eligible?
- —
Short-term bridge; refi at stabilization.
Listing history 32 events
-
2026-06-18days on market $234,500 Active 34 DOM
-
2026-06-17days on market $234,500 Active 33 DOM
-
2026-06-16days on market $234,500 Active 32 DOM
-
2026-06-15days on market $234,500 Active 31 DOM
-
2026-06-13days on market $234,500 Active 29 DOM
-
2026-06-13days on market $234,500 Active 28 DOM
-
2026-06-10days on market $234,500 Active 26 DOM
-
2026-06-09days on market $234,500 Active 25 DOM
-
2026-06-08days on market $234,500 Active 24 DOM
-
2026-06-07days on market $234,500 Active 23 DOM
-
2026-06-05days on market $234,500 Active 20 DOM
-
2026-06-03days on market $234,500 Active 19 DOM
-
2026-06-02days on market $234,500 Active 18 DOM
-
2026-06-01days on market $234,500 Active 17 DOM
-
2026-05-31days on market $234,500 Active 16 DOM
-
2026-05-15$234,500 Active
-
2026-05-15historical
-
2026-03-16$249,999 Active
-
2025-08-20historical
-
2025-06-10$320,000 Active
-
2020-09-23historical
-
2020-08-04price $183,900
-
2020-06-16$184,900 Active
-
2018-02-01soldstatus $165,900 Closed Sale or Rented
-
2017-10-12historical
-
2017-10-12$169,900
-
2015-12-30soldstatus $53,425 Closed Sale or Rented
-
2015-12-30soldstatus $53,425
-
2015-07-17status Pending Sale
-
2015-06-29$73,900 Active
-
2008-08-20soldstatus $37,100
-
2005-06-07soldstatus $50,000
ⓘ Source: listings_history table (triggers on properties + properties_extension) + one-shot
backfill from property_details.listing_events for pre-trigger history.
Tax reassessment forecast NY · Partial reset (capped growth)
- Current annual tax
- $3,452 · $288/mo
- Projected year-2 tax
- $3,708 · $309/mo
- Expected delta
- +$255/yr (+$21/mo · 7.4%)
ⓘ Screening estimate from a state-policy table — verify with the county assessor before closing.
Climate risk First Street
- Flood 1/10 Low FEMA zone X · 0% chance over 30 yrs
- Wildfire 1/10 Low
- Heat 2/10 Low
- Air quality 2/10 Low 1 unhealthy d/yr today · 2 by 30 yrs out
Nearby sold comps map
Loading sold comps map…
Walkable amenities ~0.75 mi
Loading nearby amenities…
Taxation est. · year 1
- Rental income
- $61,524
- − Mortgage interest
- −$13,136
- − Property taxes
- −$3,452
- − Insurance
- −$1,172
- − Repairs & maintenance
- −$4,922
- − Management
- −$4,922
- − Depreciation
- −$6,822
- Taxable income
- $27,098
- Est. tax owed @ 24.0%
- −$6,504
- After-tax cash flow
- $22,719/yr
For passive investors: Depreciation is non-cash, so a rental often shows a tax loss while cash-flowing — sheltering income. Rental losses are passive: they offset passive income freely, and up to $25,000/yr can offset ordinary (W-2) income if you actively participate and your MAGI is under $100k (phasing out to $0 by $150k); unused losses carry forward. On sale, claimed depreciation is recaptured at up to 25%, and gains may owe capital-gains tax (a 1031 exchange can defer both). Figures are a year-1 estimate at your 24.0% rate — not tax advice; consult a CPA.
Schools (NCES district)
- District
- Lockport City School District
- NCES district ID
- 3617670
- Math proficiency
- 44% ▼ -7.00%
- Reading proficiency
- 49% ▲ 3.00%
- Median HH income
- $43,793
- Composite
- 39.28/100
- National rank
- #3997
- State rank
- #452 of 590 in NY
Livability — Lockport
- Score
- 76/100
- State rank
- #232
- US rank
- #3669
Category grades
Schools grade is shown separately in the Schools card above.
Census & demographics
- Census place
- Lockport, NY
- County
- Niagara County · 157,377 people
- City population
- 50,153
- Metro
- Buffalo-Cheektowaga, NY
- Population (ZIP)
- 50,153
- Household income
- $75,427
- Rent vs Own
- Severe rent burden
- 1112.0
Population outlook (Niagara County) Hauer SSP2
- Today (2025)
- 204,149 people
- By 2030
- 197,900 · -3.1%
- By 2040
- 182,239 · -10.7%
- By 2050
- 165,198 · -19.1%
- By 2075
- 129,416 · -36.6%
- By 2100
- 96,222 · -52.9%
Race, ethnicity, and origin ACS 2023
- Neighborhood character
- Predominantly White (84%)
- Race & ethnicity
- White 84% Two or more races 6% Black 6% Hispanic / Latino 3%
- Common ancestry
- Romanian 9% Slovak 2% Lithuanian 2%
- Foreign-born
- 3% · Canada
- Languages at home
- 96% English-only · Spanish 1% Russian/Polish/Slavic 1% Other Indo-European 1%
Political lean MEDSL · Niagara
- 2024 margin
- R (+14.9) · D 42.5% · R 57.5%
- 2008→2024 swing
- -15.9pp toward R · 2008: 1.0pp · 2024: -14.9pp
- All cycles
- 2024: R+14.9 2020: R+9.7 2016: R+19.0 2012: D+0.6 2008: D+1.0
Not yet ingested
- Civics
- —
Market trends
- HPI YoY
- ▼ -262.57%
- Current HPI
- 303.6109
- Rent YoY
- ▲ 3.67%
- Metro
- Buffalo-Cheektowaga, NY
- State GDP YoY
- ▲ 2.60%
- F500 in state
- 92
Industry mix (Fortune 500 HQ in NY)
| Industry | F500 HQs | Revenue |
|---|---|---|
| Financial Services | 10 | $950B |
|
||
| Consumer Goods | 9 | $162B |
|
||
| Insurance | 4 | $225B |
|
||
| Telecommunications | 2 | $144B |
|
||
| Pharmaceuticals | 2 | $112B |
|
||
| Media / Entertainment | 2 | $69B |
|
||
Price history
+369.0% since first listed17 events — show timeline
- 2026-05-15 Listing Removed — WNYREIS
- 2026-05-15 Listed $234,500 WNYREIS
- 2026-03-16 Listed $249,999 WNYREIS
- 2025-08-20 Listing Removed — WNYREIS
- 2025-06-10 Listed $320,000 WNYREIS
- 2020-09-23 Listing Removed — WNYREIS
- 2020-08-04 Price Changed $183,900 WNYREIS
- 2020-06-16 Listed $184,900 WNYREIS
- 2018-02-01 Sold (MLS) $165,900 WNYREIS
- 2017-10-12 Listed $169,900 WNYREIS
- 2017-10-12 Listing Removed — WNYREIS
- 2015-12-30 Sold (Public Records) $53,425 Public Records
- 2015-12-30 Sold (MLS) $53,425 WNYREIS
- 2015-07-17 Pending — WNYREIS
- 2015-06-29 Listed $73,900 WNYREIS
- 2008-08-20 Sold (Public Records) $37,100 Public Records
- 2005-06-07 Sold (Public Records) $50,000 Public Records
Property tax history
+4.7%/yrLatest (2025): $3,452 · -2.3% YoY. Source: county tax records.
Cash-flow waterfall
monthlySold comps — $/sqft
last 12 mo · ≤1 miLoading sold comps…