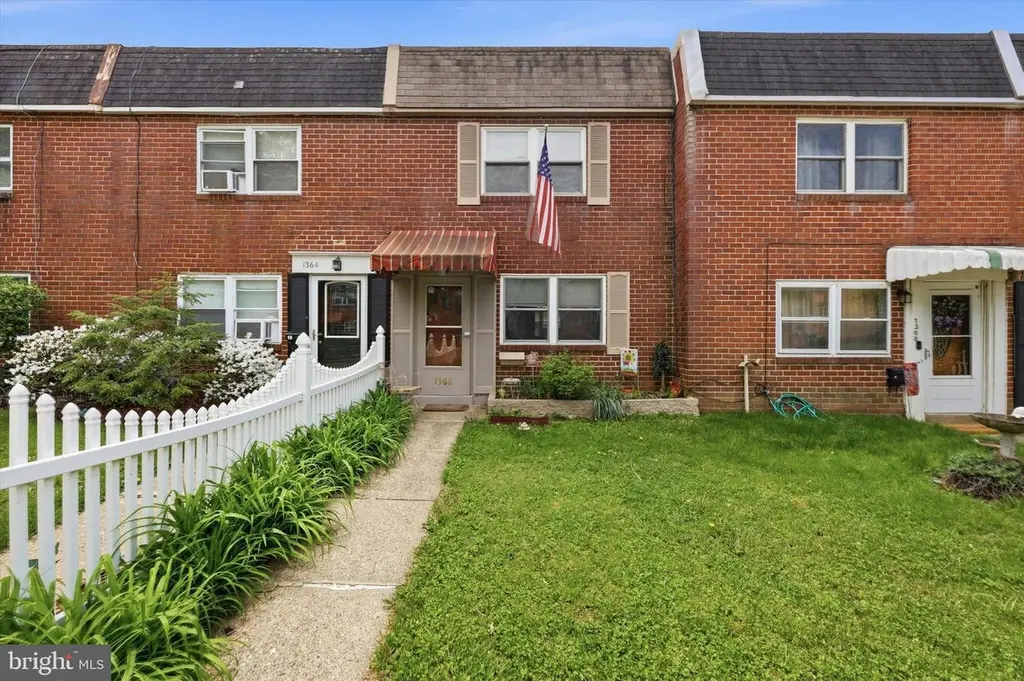
1366 Maple Ave · Elsmere, DE
Flood risk 6/10 · Moderate
- FEMA flood zone
- X (shaded)
- Chance of flooding over 30 yrs
- 0.73%
- Est. flood insurance / yr
- $507 – $1,088
Fire risk 1/10 · Minimal
- Est. fire insurance / yr
- $476 – $884
Heat risk 7/10 · Major
- Hot days now (above 103°F)
- 7 days/yr
- Hot days in 30 yrs
- 15 days/yr
Wind risk 6/10 · Moderate
- Chance of severe wind over 30 yrs
- 27.0%
Air-quality risk 3/10 · Minor
- Unhealthy air days now
- 3 days/yr
- Unhealthy air days in 30 yrs
- 4 days/yr
Risk factors via First Street. Map © Google.
Why this score? — see what drove the C- grade
The composite is a weighted blend of 9 inputs, each scored 0–100. Each bar is that input's sub-score; the figure is the points it added to the 100-point composite (weight × sub-score).
- Cash flow +16.5/30.0
- ARV discount +10.7/15.0
- DSCR +5.1/10.0
- 1% rule +4.5/10.0
- Rent growth +4.1/5.0
- Livability +3.8/5.0
- Schools +3.1/10.0
- Condition / age +2.5/5.0
- Appreciation +0.0/10.0
$185,000
🖨 Deal sheet (PDF) 📄 Offer letter ✓ Due diligence
Listing remarks
Welcome to 1366 Maple Avenue in the heart of Elsmere! This 3-bedroom, 1-bath home offers a fantastic opportunity for buyers looking to build equity and make a home their own. Priced accordingly, this property is perfect for investors, first-time buyers, or anyone ready to roll up their sleeves and add their personal touch. The home features a traditional layout with a generously sized living room, eat-in kitchen, and three comfortable bedrooms. While it does need updating, the potential here is undeniable—whether you're envisioning a full renovation or simply refreshing over time. Situated on a convenient street with easy access to shopping, dining, and major routes, this location mak
Key facts
- Eat-in kitchen
- 2 parking spots
- Built 1958
Tags
Property features AI
Exterior
- Parking: Paved driveway with 2 parking spaces (total 2 garage/parking spaces)
- Utilities: Public water; Public sewer; Municipal trash service
- Home design: Interior townhouse/rowhouse; Fee simple ownership
- Construction: Brick construction; Concrete perimeter foundation
- Exterior features: Patio; Sidewalks; Street lights; Shed
Interior
- Kitchen: Built-in range; Built-in microwave; Refrigerator
- Bedrooms: Three bedrooms on the upper level
- Flooring: Vinyl; Hardwood; Carpet
- Bathrooms: One full bathroom
- Heating & cooling: Forced air heating; Window air conditioning units
- Interior features: Tub/shower; Ceiling fans; Combination kitchen/dining; Traditional floor plan; Eat-in kitchen; Wood floors; Drywall walls and ceilings
- Laundry & utility: Washer and dryer on the main floor; Electric hot water
Neighborhood map
What this means for you Summary
Snapshot
- This is a 3-bed/1.0-bath townhouse listed at $185k.
Deal economics
- At list price, monthly cash flow is $108 ($1k/yr) — positive.
- The deal already cash-flows at list — no discount required.
- To meet the 1% rule (rent ≥ 1% of price), the offer needs to be $176k (5.1% below list).
- Recommended offer: $176k (5.1% below list) — sets the bar for 1% rule.
- Cap rate 7.0% vs local median 4.7% in Elsmere — top-decile yield for the area; either an underpriced asset or a hidden risk that comps aren't pricing in. Stress-test before assuming the spread holds.
Location & tenants
- Location reads 76/100 on livability (#5 in DE, #3,599 nationally) — a middle-class / working-renter tenant base. Strengths: cost of living A+, housing A+, employment B+; Watch: amenities F, commute F.
- Red Clay Consolidated School District (suburban): math 27% / reading 42% proficiency, ranked #12 of 26 in DE (top 46%) — families likely to look elsewhere, expect single-tenant / working-renter base with shorter leases.
- Zoned schools: Baltz (Austin D.) Elementary School (math 14% / reading 24%, grade F, #83 of 105 statewide, top 79%, 528 students, 0% FRL); Dupont (Alexis I.) Middle School (math 7% / reading 24%, grade F, #33 of 36 statewide, top 91%, 492 students, 0% FRL); Mckean (Thomas) High School (math 2% / reading 17%, grade F, #38 of 40 statewide, top 100%, 927 students, 0% FRL) — zoned schools average 0% FRL vs 44% district-wide (44 pts lower); this property's tenant base skews higher-income than the district average.
- Zoned-school proficiency averages 15% at this address vs 34% district-wide (-20 pts) — the specific schools serving this property underperform the Red Clay Consolidated School District average; the district grade overstates school quality for this exact location.
- Market conditions: Rents rising fast (+6.3%/yr); 168 active listings in the ZIP; 17 comparable units currently listed for rent nearby; rentals at typical pace (median 24d on market — plan ~3-4 weeks tenant-placement turnaround); 1,367 units permitted in New Castle County in 2024 (201 in 5+ unit buildings).
- This rent runs 35% of the median local income ($60k/yr) — at the standard rent-burdened threshold; future hikes will face affordability resistance.
Forward outlook
- Local home prices are declining (-3.0%/yr); year-one equity from $1k of loan paydown is wiped out by about $6k of value loss. Plan a longer hold.
- New Castle County population projected at +9% by 2050 — modest demand growth; plan on rents tracking national, not racing it.
Negotiation context
- Only 4 days on market — expect competitive offers; lowballing is unlikely to land.
Risks & watch-outs
- Watch-outs: built in 1958 — expect roof / HVAC / electrical / plumbing capex.
- Climate carrying-cost: major flood risk; major wind risk, 27% chance of damaging wind over 30y; extreme-heat days projected 7→15/yr by 2055 (HVAC capex compounding) — expect insurance premiums to compound above CPI over the hold.
Questions for the listing agent
- Built in 1958 — when were the roof, HVAC, electrical panel, plumbing, and water heater last replaced?
- Is there a deadline driving the sale (1031 exchange, divorce, estate, relocation)? That informs how much negotiation room exists.
- Schools are D-rated, which usually means shorter tenancies and higher turnover. Who's the typical renter profile here, and what's been the actual vacancy rate?
- What's the average days-on-market for RENTAL listings here right now (not sales)? A rising rental-DOM trend means longer vacancies and softer asking-rent achievability than the comps imply.
- What's the recent tenant-quality profile in this submarket — average credit score on applications, eviction rate, late-payment / NSF rate, and stable-employment percentage? A property-management company in the area should have these aggregated.
- How much new for-sale + rental construction is in the pipeline within 1–3 miles? Heavy new supply typically softens prices + rents 12–24 months out; constrained supply supports both.
Investment metrics
- 1% rule
- 0.95% ✗
- Cap rate
- 7.00%
- Cash-on-cash
- 2.51%
- DSCR
- 1.11
- GRM
- 8.8
CMA / ARV
- ARV (median comp)
- $199,149
- List price
- $185,000
- Delta
- -7.10%
- Verdict
- FAIR
- Comps
- 20 within 1.0 mi
Show comp detail 12 sales within ~0.75 mi
| Address | Dist | Beds/Ba | Sqft | Sold | Price | $/sf | Match |
|---|---|---|---|---|---|---|---|
| 1366 Maple Ave | 0.00mi | 3/1.0 | 1,025 (0%) | 0mo | $180,000 | $176 | 100 |
| 1315 Maple Ave | 0.06mi | 3/1.0 | 1,025 (0%) | 9mo | $215,000 | $210 | 90 |
| 1336 Cypress Ave | 0.11mi | 3/1.0 | 1,040 (+2%) | 10mo | $250,000 | $240 | 84 |
| 127 Bungalow Ave | 0.19mi | 3/1.0 | 1,000 (-2%) | 8mo | $185,000 | $185 | 81 |
| 1230 Sycamore Ave | 0.15mi | 3/1.0 | 1,150 (+12%) | 7mo | $224,900 | $196 | 67 |
| 1015 Baltimore Ave | 0.41mi | 2/1.0 (-1) | 960 (-6%) | 1mo | $210,900 | $220 | 65 |
| 1300 Cypress Ave | 0.13mi | 3/1.0 | 875 (-15%) | 6mo | $215,000 | $246 | 64 |
| 1021 Dover Ave | 0.37mi | 2/1.0 (-1) | 950 (-7%) | 5mo | $189,000 | $199 | 62 |
| 132 Birch Ave | 0.47mi | 2/1.0 (-1) | 960 (-6%) | 2mo | $200,000 | $208 | 61 |
| 288 Filbert Ave | 0.48mi | 2/1.0 (-1) | 950 (-7%) | 1mo | $205,000 | $216 | 60 |
| 126 Birch Ave | 0.48mi | 2/1.0 (-1) | 950 (-7%) | 1mo | $165,000 | $174 | 60 |
| 256 Birch Ave | 0.42mi | 2/1.0 (-1) | 1,160 (+13%) | 1mo | $190,000 | $164 | 53 |
Match score weights: distance 35% · size 25% · config 20% · recency 20%. Top-matched comps best support the ARV.
Projected returns pro-forma
-3.0% appreciation · 6.35% rent growth · sell at horizon
- IRR
- -8.6%
- Equity multiple
- 0.67×
- Total profit
- $-16,930
- Equity at exit
- $27,584
- IRR
- 4.8%
- Equity multiple
- 1.41×
- Total profit
- $21,145
- Equity at exit
- $15,995
Cash invested: $51,800 (down + closing). Projections, not guarantees.
Landlord ↔ Tenant lean methodology
- Overall (STATE)
- 70 Landlord-Friendly
- State Delaware
- 70 Landlord-Friendly · D+7
- County
- — inherits STATE
- City
- — inherits STATE
ZIP-level market 19805
- Rents YoY
- 6.3%
- Active inventory
- 168
- Price-to-rent
- 8.8×
Monthly cashflow live
- Estimated rent
- $1,756 high interval (Pro) →
- Mortgage (P&I)
- −$970
- Tax est. 1.5%
- −$231 /mo · $2,775/yr
- Insurance
- −$77
- HOA
- −$0
- Vacancy / Maint / Mgmt
- −$369
- Net cashflow
- $108
Break-even live
Sensitivity live
| Price | -10% $236 | -5% $172 | +0% $108 | +5% $44 | +10% $-19 |
|---|---|---|---|---|---|
| Rent | -10% $-30 | -5% $39 | +0% $108 | +5% $178 | +10% $247 |
| Rate | -1.0pp $202 | -0.5pp $155 | base $108 | +0.5pp $60 | +1.0pp $12 |
UW: 25.0% down · 7.5% · 30yr · 1.5% tax · 5.0% vac · 8.0% maint · 8.0% mgmt
Financing live
Cash to close
- Down payment
- $46,250
- Closing costs
- $5,550
- Reserves months
- —
- Total cash needed
- —
Loan-product check · same deal, 3 products live
Conventional
25% down · 7.5% · 30yr
- Down + closing
- —
- Monthly P&I
- —
- Monthly cashflow
- —
- DSCR
- —
- Eligible?
- —
Personal DTI + credit; lowest rate.
DSCR
20% down · 8.5% · 30yr
- Down + closing
- —
- Monthly P&I
- —
- Monthly cashflow
- —
- DSCR
- —
- Eligible?
- —
No personal income docs; deal must DSCR.
Hard money
10% down · 12.0% · 12mo
- Down + closing
- —
- Monthly P&I
- —
- Monthly cashflow
- —
- DSCR
- —
- Eligible?
- —
Short-term bridge; refi at stabilization.
Rent comps 17 comps
| Address | Beds | Baths | Sqft | Rent | $/sqft | DOM | Units | Dist |
|---|---|---|---|---|---|---|---|---|
| 1355 Maple Ave Elsmere, DE | 2.0 | 1.0 | 900 | $1,475 | $1.64 | 45d | 1 | 0.01mi |
| 1333 Sycamore Ave Wilmington, DE | 3.0 | 1.0 | 1175 | $1,650 | $1.40 | 26d | 1 | 0.07mi |
| 1230 Sycamore Ave Wilmington, DE | 3.0 | 1.0 | 1150 | $1,750 | $1.52 | 26d | 1 | 0.17mi |
| 275 Filbert Ave Wilmington, DE | 3.0 | 1.0 | 1225 | $1,495 | $1.22 | 4d | 1 | 0.48mi |
| 5 Ruth Rd Elsmere, DE | 1.0–2.0 | 1.0 | 650 | $1,450 | $2.23 | 14d | 1 | 0.51mi |
| 205 Western Ave Wilmington, DE | 4.0 | 2.5 | 1225 | $2,300 | $1.88 | 45d | 1 | 0.68mi |
| 27 Vilone Rd Wilmington, DE | 3.0 | 1.0 | 1225 | $2,000 | $1.63 | 6d | 1 | 0.73mi |
| 1109 Montgomery Rd Wilmington, DE | 4.0 | 2.0 | 1275 | $1,850 | $1.45 | 20d | 1 | 0.78mi |
| 13 Lowry Dr Wilmington, DE | 2.0 | 1.0 | 700 | $1,647 | $2.35 | 23d | 1 | 0.91mi |
| 131 Scarborough Park Dr Wilmington, DE | 1.0–2.0 | 1.0–1.5 | 837 | $1,700 | $2.03 | 45d | 1 | 0.95mi |
| 2700 Boulevard Rd Wilmington, DE | 1.0–2.0 | 1.0 | 743 | $1,525 | $2.05 | 1d | 7 | 1.01mi |
| 37 E Champlain Ave Wilmington, DE | 2.0 | 1.0 | 975 | $1,612 | $1.65 | 0d | 1 | 1.03mi |
| 405 Hillside Ave Wilmington, DE | 4.0 | 2.0 | 1400 | $2,400 | $1.71 | 23d | 1 | 1.06mi |
| 405 Hillside Ave Unit NA Wilmington, DE | 4.0 | 2.0 | 1400 | $2,400 | $1.71 | 45d | 1 | 1.06mi |
| 201 New Rd Wilmington, DE | 2.0 | 1.0 | 800 | $1,350 | $1.69 | 4d | 1 | 1.16mi |
| 1936 Lakeview Rd Wilmington, DE | 3.0 | 1.0 | 1350 | $1,850 | $1.37 | 16d | 1 | 1.23mi |
| 1122 Coyne Pl Wilmington, DE | 3.0 | 1.0 | 1350 | $1,950 | $1.44 | 45d | 1 | 1.47mi |
Listing history 4 events
-
2026-05-05historical Active Under Contract 949-char remark
-
2026-05-01$185,000 Active 949-char remark
-
1989-08-01soldstatus $66,900
-
1985-08-01soldstatus $44,900
ⓘ Source: listings_history table (triggers on properties + properties_extension) + one-shot
backfill from property_details.listing_events for pre-trigger history.
Climate risk First Street
- Flood 6/10 Major FEMA zone X (shaded) · 73% chance over 30 yrs
- Wildfire 1/10 Low
- Heat 7/10 Severe 7 d/yr ≥103°F today · 15 d/yr by 30 yrs out
- Wind 6/10 Major 27% chance of damaging wind over 30 yrs
- Air quality 3/10 Moderate 3 unhealthy d/yr today · 4 by 30 yrs out
Nearby sold comps map
Loading sold comps map…
Walkable amenities ~0.75 mi
Loading nearby amenities…
Taxation est. · year 1
- Rental income
- $21,067
- − Mortgage interest
- −$10,363
- − Property taxes
- −$2,775
- − Insurance
- −$925
- − Repairs & maintenance
- −$1,685
- − Management
- −$1,685
- − Depreciation
- −$5,382
- Taxable loss
- −$1,748
- Est. tax savings @ 24.0%
- +$420
- After-tax cash flow
- $1,721/yr
For passive investors: Depreciation is non-cash, so a rental often shows a tax loss while cash-flowing — sheltering income. Rental losses are passive: they offset passive income freely, and up to $25,000/yr can offset ordinary (W-2) income if you actively participate and your MAGI is under $100k (phasing out to $0 by $150k); unused losses carry forward. On sale, claimed depreciation is recaptured at up to 25%, and gains may owe capital-gains tax (a 1031 exchange can defer both). Figures are a year-1 estimate at your 24.0% rate — not tax advice; consult a CPA.
Schools (NCES district)
- District
- Red Clay Consolidated School District
- NCES district ID
- 1001300
- Math proficiency
- 27% ▼ -11.00%
- Reading proficiency
- 42% ▼ -7.00%
- Median HH income
- $64,298
- Composite
- 31.25/100
- National rank
- #6027
- State rank
- #12 of 26 in DE
Livability — Elsmere
- Score
- 76/100
- State rank
- #5
- US rank
- #3599
Category grades
Schools grade is shown separately in the Schools card above.
Census & demographics
- Census place
- Elsmere, DE
- County
- New Castle County · 483,412 people
- Metro
- Philadelphia-Camden-Wilmington, PA-NJ-DE-MD
- Population (ZIP)
- 41,402
- Household income
- $60,221
- Rent vs Own
- Severe rent burden
- 1730.0
Population outlook (New Castle County) Hauer SSP2
- Today (2025)
- 594,686 people
- By 2030
- 609,164 · +2.4%
- By 2040
- 632,154 · +6.3%
- By 2050
- 649,068 · +9.1%
- By 2075
- 687,771 · +15.7%
- By 2100
- 694,961 · +16.9%
Race, ethnicity, and origin ACS 2023
- Neighborhood character
- Diverse neighborhood (Simpson 0.70)
- Race & ethnicity
- White 37% Black 32% Hispanic / Latino 25% Two or more races 10%
- Hispanic origin (detail)
- Mexican 10% Puerto Rican 10% Dominican 2%
- Common ancestry
- Romanian 4% Slovak 1% Italian 1%
- Foreign-born
- 9% · Canada
- Languages at home
- 79% English-only · Spanish 18% French/Haitian/Cajun 1% Arabic 1%
Political lean MEDSL · New Castle
- 2024 margin
- Solid D (+32.6) · D 65.5% · R 32.9% · Other 1.6%
- 2008→2024 swing
- -8.1pp toward R · 2008: 40.6pp · 2024: 32.6pp
- All cycles
- 2024: D+32.6 2020: D+37.1 2016: D+29.6 2012: D+34.1 2008: D+40.6
Not yet ingested
- Civics
- —
Market trends
- HPI YoY
- ▼ -291.16%
- Current HPI
- 259.1455
- Rent YoY
- ▲ 6.35%
- Metro
- Philadelphia-Camden-Wilmington, PA-NJ-DE-MD
- State GDP YoY
- —
- F500 in state
- 0
Price history
+300.9% since first listed6 events — show timeline
- 2026-06-16 Sold (MLS) $180,000 BRIGHT MLS
- 2026-05-28 Pending — BRIGHT MLS
- 2026-05-05 Contingent — BRIGHT MLS
- 2026-05-01 Listed $185,000 BRIGHT MLS
- 1989-08-01 Sold (Public Records) $66,900 Public Records
- 1985-08-01 Sold (Public Records) $44,900 Public Records
Property tax history
+3.6%/yrLatest (2024): $144 · +14.8% YoY. Source: county tax records.
Cash-flow waterfall
monthlySold comps — $/sqft
last 12 mo · ≤1 miLoading sold comps…