 Multi-family
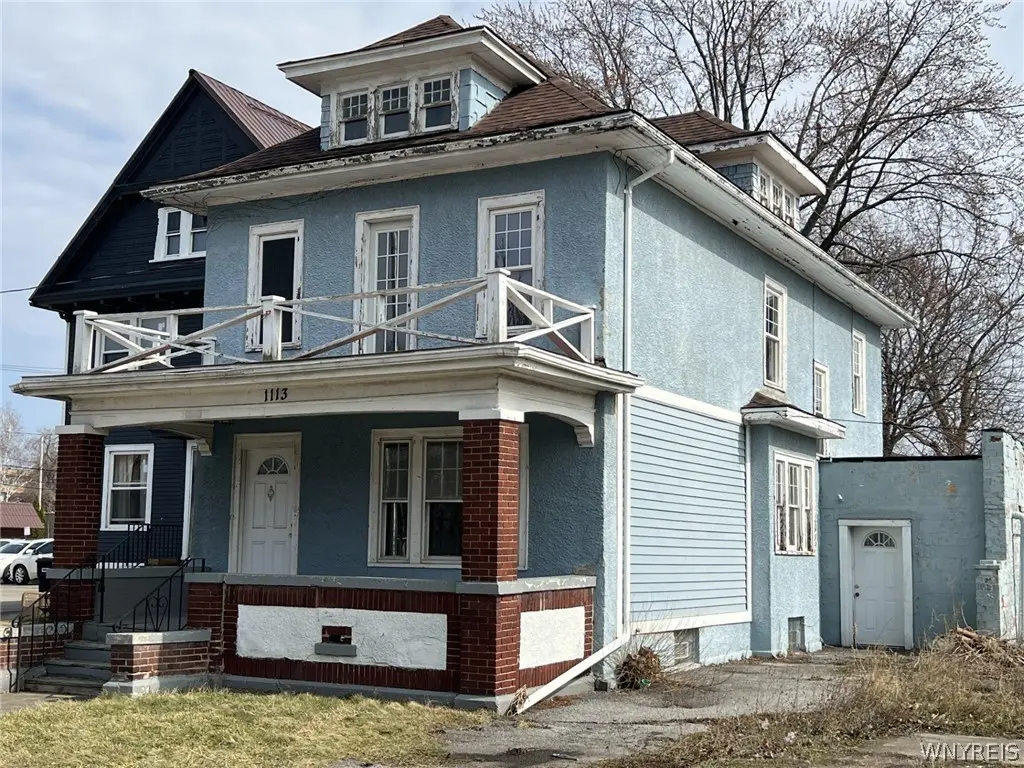
1113 Main St · Niagara Falls, NY
Flood risk 1/10 · Minimal
- FEMA flood zone
- X (unshaded)
- Chance of flooding over 30 yrs
- 0.0%
- Est. flood insurance / yr
- $473 – $860
Fire risk 3/10 · Minor
- Est. fire insurance / yr
- $691 – $1,283
Heat risk 2/10 · Minimal
- Hot days now (above 94°F)
- 7 days/yr
- Hot days in 30 yrs
- 15 days/yr
Wind risk 1/10 · Minimal
- Chance of severe wind over 30 yrs
- —
Air-quality risk 2/10 · Minimal
- Unhealthy air days now
- 1 days/yr
- Unhealthy air days in 30 yrs
- 2 days/yr
Risk factors via First Street. Map © Google.
Why this score? — see what drove the A grade
The composite is a weighted blend of 9 inputs, each scored 0–100. Each bar is that input's sub-score; the figure is the points it added to the 100-point composite (weight × sub-score).
- Cash flow +29.2/30.0
- ARV discount +15.0/15.0
- DSCR +10.0/10.0
- Appreciation +10.0/10.0
- 1% rule +9.3/10.0
- Rent growth +4.7/5.0
- Livability +3.0/5.0
- Schools +2.5/10.0
- Condition / age +2.5/5.0
$109,900
🖨 Deal sheet 📄 Offer letter ✓ Due diligence
Multi-family units
County records classify this as Multi-Family (2-4 Unit). Listing-text estimate: 1 unit. estimate disagrees with records
Listing remarks MLS
Positioned on one of Niagara Falls' most visible & heavily traveled corridors, 1113 Main Street presents an exciting opportunity for the savvy investor, entrepreneur, or redevelopment-minded buyer looking to capitalize on location, zoning, & upside potential. This approximately 2,290 square feet vinyl & stucco-sided property is currently configured as a two-family residence, offering two bedrooms in each unit, plus an additional room off the rear of the property that opens the door to even more possibilities. Whether you're looking to renovate and hold as an income-producing asset, create a hybrid use property, or reimagine the layout to maximize returns, this property offers the kind of flexibility that today's investors are searching for Prime Main Street Spot. Location is everything, & this property delivers. Situated right on Main Street, this building enjoys excellent visibility, strong accessibility, & proximity to one of the most visited destinations in the world. Being located just minutes from the world-famous Water Falls & borders Canada. Breath taking views of the mighty gorge minutes away priceless. Buyers looking toward the future, one of the biggest advantages here is the property's location within the short-term rental/AirBnB-allowed zone, creating a compelling opportunity to explore alternate income strategies, subject to local rules, licensing, & approvals. Destination market like Niagara Falls, the ability to own property in an area where short-term lodging potential exists can be a major long-term value driver. This is not a "turnkey" property-and that's exactly where the opportunity lies. The property does need work, but it is being offered at a price point that allows room for a buyer to make improvements, add value, & unlock greater profitability over time. The C2-A zoning designation is another key feature that adds to this property's appeal. Great investments are often bought in "as is" condition & improved over time. The bones, the square footage, the location, the layout, & the zoning all combine to create a compelling value-added opportunity. Most recognizable destination in the world. People from around the globe know Niagara Falls.
Key facts
- Two-family residence
- Main street location
- Bonus room
Tags
Neighborhood map
What this means for you Summary
Snapshot
- This is a 4-bed/2.0-bath multifamily listed at $110k.
Deal economics
- At list price, monthly cash flow is $385 ($5k/yr) — positive.
- The deal already cash-flows at list — no discount required.
- Meets the 1% rule at list price ($2k rent vs $110k).
- Recommended offer: $103k (6.0% below list) — sets the bar for market timing.
- Cap rate 10.5% vs local median 7.7% in Niagara Falls — top-decile yield for the area; either an underpriced asset or a hidden risk that comps aren't pricing in. Stress-test before assuming the spread holds.
Location & tenants
- Location reads 60/100 on livability (#956 in NY) — a middle-class / working-renter tenant base. Strengths: cost of living A+, housing A+; Watch: schools F, crime F, amenities F.
- Niagara Falls City School District (urban): math 26% / reading 34% proficiency, ranked #578 of 590 in NY (top 98%) — families likely to look elsewhere, expect single-tenant / working-renter base with shorter leases; 66% free/reduced lunch — lower-income household profile, screen leases tightly.
- Market conditions: Rents rising fast (+8.8%/yr); 164 active listings in the ZIP; 3 comparable units currently listed for rent nearby; rentals at typical pace (median 17d on market — plan ~3-4 weeks tenant-placement turnaround); lower-income renter base — watch delinquency; 167 units permitted in Niagara County in 2024 (0 in 5+ unit buildings).
- At $1,570/mo this rent would consume 55% of the median local household income ($35k/yr) (locally 954% of renters already pay >50% of income on rent) — very limited rent-growth headroom before tenants either downsize or default.
Forward outlook
- In year one you build about $12k of equity ($760 loan paydown + $11k appreciation (10.0% local appreciation)).
- Niagara County population projected at -19% by 2050 — secular population decline; favor cash flow + early exit over multi-decade hold.
- At projected returns (10.0% appreciation + 8.0% rent growth), your $31k cash investment doubles in ~2 years — after that, you're playing with house money.
- By year 4, paydown + projected appreciation supports a ~$42k cash-out refi (75% LTV) — recoverable capital for the next deal without selling this one.
Negotiation context
- It's been on market 84 days — a 6% lower offer ($103k) is reasonable based on typical stale-listing flexibility.
- 2 sale attempts since 12y ago; this cycle's ask has dropped $10k (8%) from the opening price — seller is motivated, your offer sets the floor, not the list.
- Current owner paid $55k; list at $110k implies a 100% gain — meaningful room to come down on a strong offer.
Risks & watch-outs
- Watch-outs: property tax is 2.6% of price; built in 1930 — expect roof / HVAC / electrical / plumbing capex.
Questions for the listing agent
- It's been on market 84 days. Have you received any prior offers? Is the seller open to a 6% concession, seller financing, or rate buy-down credit?
- Built in 1930 — when were the roof, HVAC, electrical panel, plumbing, and water heater last replaced?
- Property tax is high relative to price — has the assessment been appealed recently, and will the sale trigger a re-assessment?
- Why hasn't it sold? Are there any deal-killer items the seller is aware of (foundation, flood, title, zoning, code violations)?
- Is there a deadline driving the sale (1031 exchange, divorce, estate, relocation)? That informs how much negotiation room exists.
- Schools are F-rated, which usually means shorter tenancies and higher turnover. Who's the typical renter profile here, and what's been the actual vacancy rate?
- Crime grade is F in this area — have there been break-ins, vandalism, or insurance claims at this property in the last 3 years? What carrier currently insures it and at what premium?
- What's the average days-on-market for RENTAL listings here right now (not sales)? A rising rental-DOM trend means longer vacancies and softer asking-rent achievability than the comps imply.
- What's the recent tenant-quality profile in this submarket — average credit score on applications, eviction rate, late-payment / NSF rate, and stable-employment percentage? A property-management company in the area should have these aggregated.
- How much new apartment / multifamily construction is in the pipeline within 1–3 miles? Heavy new supply (>2% of stock underway) typically softens rents 12–24 months out; light construction supports rent growth.
Investment metrics
- 1% rule
- 1.43% ✓
- Cap rate
- 10.49%
- Cash-on-cash
- 15.00%
- DSCR
- 1.67
- GRM
- 5.8
CMA / ARV
- ARV (median comp)
- $195,422
- List price
- $109,900
- Delta
- -43.76%
- Verdict
- UNDERPRICED
- Comps
- 20 within 1.0 mi
Show comp detail 12 sales within ~0.75 mi
| Address | Dist | Beds/Ba | Sqft | Sold | Price | $/sf | Match |
|---|---|---|---|---|---|---|---|
| 609 Elmwood Ave | 0.19mi | 4/2.0 | 2,221 (-3%) | 0mo | $190,800 | $86 | 86 |
| 423 Elmwood Ave | 0.27mi | 4/2.0 | 2,232 (-2%) | 3mo | $117,000 | $52 | 81 |
| 814 Willow Ave | 0.23mi | 5/2.0 (+1) | 2,072 (-10%) | 2mo | $140,000 | $68 | 67 |
| 1023 15th St | 0.47mi | 5/4.0 (+1) | 2,304 (+1%) | 5mo | $190,000 | $82 | 60 |
| 1110 Willow Ave | 0.32mi | 4/3.0 | 2,430 (+6%) | 15mo | $115,000 | $47 | 58 |
| 463 Elmwood Ave | 0.21mi | 4/2.0 | 1,992 (-13%) | 13mo | $73,000 | $37 | 58 |
| 1010 Ontario Ave | 0.65mi | 4/2.0 | 2,242 (-2%) | 14mo | $129,000 | $58 | 55 |
| 1335 Linwood Ave | 0.47mi | 5/2.0 (+1) | 2,212 (-3%) | 15mo | $90,000 | $41 | 55 |
| 1635 South Ave | 0.74mi | 5/2.0 (+1) | 2,208 (-4%) | 2mo | $85,000 | $38 | 53 |
| 1623 Linwood Ave | 0.64mi | 4/2.0 | 1,994 (-13%) | 3mo | $100,000 | $50 | 46 |
| 519 Tronolone Pl | 0.67mi | 4/3.0 | 2,000 (-13%) | 11mo | $142,500 | $71 | 35 |
| 1312 Ontario Ave | 0.74mi | 3/2.0 (-1) | 1,956 (-15%) | 5mo | $138,000 | $71 | 32 |
Match score weights: distance 35% · size 25% · config 20% · recency 20%. Top-matched comps best support the ARV.
Projected returns pro-forma
10.0% appreciation · 8.0% rent growth · sell at horizon
- IRR
- 38.1%
- Equity multiple
- 4.01×
- Total profit
- $92,725
- Equity at exit
- $99,007
- IRR
- 34.8%
- Equity multiple
- 9.92×
- Total profit
- $274,520
- Equity at exit
- $213,512
Cash invested: $30,772 (down + closing). Projections, not guarantees.
Landlord ↔ Tenant lean methodology
- Overall (STATE)
- 15 Strongly Tenant-Friendly
- State New York
- 15 Strongly Tenant-Friendly · D+10
- County
- — inherits STATE
- City
- — inherits STATE
ZIP-level market 14301
- Home prices YoY
- 6.2%
- Rents YoY
- 8.8%
- Active inventory
- 164
- Price-to-rent
- 5.8×
Monthly cashflow live
- Estimated rent
- $1,570 medium interval (Pro) →
- Mortgage (P&I)
- −$576
- Tax from tax record
- −$234 /mo · $2,803/yr
- Insurance
- −$46
- HOA
- −$0
- Vacancy / Maint / Mgmt
- −$330
- Net cashflow
- $385
Break-even live
UW: 25.0% down · 7.5% · 30yr · 1.5% tax · 5.0% vac · 8.0% maint · 8.0% mgmt
Financing live
Cash to close
- Down payment
- $27,475
- Closing costs
- $3,297
- Reserves months
- —
- Total cash needed
- —
Loan-product check · same deal, 3 products live
Conventional
25% down · 7.5% · 30yr
- Down + closing
- —
- Monthly P&I
- —
- Monthly cashflow
- —
- DSCR
- —
- Eligible?
- —
Personal DTI + credit; lowest rate.
DSCR
20% down · 8.5% · 30yr
- Down + closing
- —
- Monthly P&I
- —
- Monthly cashflow
- —
- DSCR
- —
- Eligible?
- —
No personal income docs; deal must DSCR.
Hard money
10% down · 12.0% · 12mo
- Down + closing
- —
- Monthly P&I
- —
- Monthly cashflow
- —
- DSCR
- —
- Eligible?
- —
Short-term bridge; refi at stabilization.
Rent comps 3 comps
| Address | Beds | Baths | Sqft | Rent | $/sqft | DOM | Units | Dist |
|---|---|---|---|---|---|---|---|---|
| 2020 Forest Ave Niagara Falls, NY | 4.0 | 2.0 | 1600 | $1,500 | $0.94 | 17d | 1 | 0.83mi |
| 1935 Niagara St Unit Upper Niagara Falls, NY | 3.0 | 1.0 | 2685 | $1,200 | $0.45 | 14d | 1 | 1.12mi |
| 3025 Macklem Ave Niagara Falls, NY | 4.0 | 1.5 | 1750 | $2,200 | $1.26 | 43d | 1 | 1.31mi |
Listing history 20 events
-
2026-06-18days on market $109,900 Active 84 DOM
-
2026-06-17days on market $109,900 Active 83 DOM
-
2026-06-16days on market $109,900 Active 82 DOM
-
2026-06-15days on market $109,900 Active 81 DOM
-
2026-06-13days on market $109,900 Active 79 DOM
-
2026-06-13days on market $109,900 Active 78 DOM
-
2026-06-10days on market $109,900 Active 76 DOM
-
2026-06-09days on market $109,900 Active 75 DOM
-
2026-06-08days on market $109,900 Active 74 DOM
-
2026-06-07days on market $109,900 Active 73 DOM
-
2026-06-03days on market $109,900 Active 69 DOM
-
2026-06-02days on market $109,900 Active 68 DOM
-
2026-06-01days on market $109,900 Active 67 DOM
-
2026-05-31days on market $109,900 Active 66 DOM
-
2026-05-08price $109,900 2272-char remark
Show marketing remark (2272 chars)
Positioned on one of Niagara Falls' most visible & heavily traveled corridors, 1113 Main Street presents an exciting opportunity for the savvy investor, entrepreneur, or redevelopment-minded buyer looking to capitalize on location, zoning, & upside potential. This approximately 2,290 square feet vinyl & stucco-sided property is currently configured as a two-family residence, offering two bedrooms in each unit, plus an additional room off the rear of the property that opens the door to even more possibilities. Whether you're looking to renovate and hold as an income-producing asset, create a hybrid use property, or reimagine the layout to maximize returns, this property offers the kind of flexibility that today's investors are searching for Prime Main Street Spot. Location is everything, & this property delivers. Situated right on Main Street, this building enjoys excellent visibility, strong accessibility, & proximity to one of the most visited destinations in the world. Being located just minutes from the world-famous Water Falls & borders Canada. Breath taking views of the mighty gorge minutes away priceless. Buyers looking toward the future, one of the biggest advantages here is the property's location within the short-term rental/AirBnB-allowed zone, creating a compelling opportunity to explore alternate income strategies, subject to local rules, licensing, & approvals. Destination market like Niagara Falls, the ability to own property in an area where short-term lodging potential exists can be a major long-term value driver. This is not a "turnkey" property-and that's exactly where the opportunity lies. The property does need work, but it is being offered at a price point that allows room for a buyer to make improvements, add value, & unlock greater profitability over time. The C2-A zoning designation is another key feature that adds to this property's appeal. Great investments are often bought in "as is" condition & improved over time. The bones, the square footage, the location, the layout, & the zoning all combine to create a compelling value-added opportunity. Most recognizable destination in the world. People from around the globe know Niagara Falls.
-
2026-03-26$119,900 Active 2272-char remark
Show marketing remark (2272 chars)
Positioned on one of Niagara Falls' most visible & heavily traveled corridors, 1113 Main Street presents an exciting opportunity for the savvy investor, entrepreneur, or redevelopment-minded buyer looking to capitalize on location, zoning, & upside potential. This approximately 2,290 square feet vinyl & stucco-sided property is currently configured as a two-family residence, offering two bedrooms in each unit, plus an additional room off the rear of the property that opens the door to even more possibilities. Whether you're looking to renovate and hold as an income-producing asset, create a hybrid use property, or reimagine the layout to maximize returns, this property offers the kind of flexibility that today's investors are searching for Prime Main Street Spot. Location is everything, & this property delivers. Situated right on Main Street, this building enjoys excellent visibility, strong accessibility, & proximity to one of the most visited destinations in the world. Being located just minutes from the world-famous Water Falls & borders Canada. Breath taking views of the mighty gorge minutes away priceless. Buyers looking toward the future, one of the biggest advantages here is the property's location within the short-term rental/AirBnB-allowed zone, creating a compelling opportunity to explore alternate income strategies, subject to local rules, licensing, & approvals. Destination market like Niagara Falls, the ability to own property in an area where short-term lodging potential exists can be a major long-term value driver. This is not a "turnkey" property-and that's exactly where the opportunity lies. The property does need work, but it is being offered at a price point that allows room for a buyer to make improvements, add value, & unlock greater profitability over time. The C2-A zoning designation is another key feature that adds to this property's appeal. Great investments are often bought in "as is" condition & improved over time. The bones, the square footage, the location, the layout, & the zoning all combine to create a compelling value-added opportunity. Most recognizable destination in the world. People from around the globe know Niagara Falls.
-
2024-04-16soldstatus $55,000
-
2020-03-09soldstatus $50,000
-
2014-10-13soldstatus $22,000 233-char remark
Show marketing remark (233 chars)
Main St location of this 2 unit will open many avenues for the fertile imagination!! Could be a new office, an affordable 1st investment purchase, or close enough to NU to buy & rent out to incoming students. Check it out NOW!!
-
2014-07-08$34,900 233-char remark
Show marketing remark (233 chars)
Main St location of this 2 unit will open many avenues for the fertile imagination!! Could be a new office, an affordable 1st investment purchase, or close enough to NU to buy & rent out to incoming students. Check it out NOW!!
ⓘ Source: listings_history table (triggers on properties + properties_extension) + one-shot
backfill from property_details.listing_events for pre-trigger history.
Tax reassessment forecast NY · Partial reset (capped growth)
- Current annual tax
- $2,803 · $234/mo
- Projected year-2 tax
- $2,803 · $234/mo
- Expected delta
- $0/yr ($0/mo · 0.0%)
ⓘ Screening estimate from a state-policy table — verify with the county assessor before closing.
Climate risk First Street
- Flood 1/10 Low FEMA zone X (unshaded) · 0% chance over 30 yrs
- Wildfire 3/10 Moderate
- Heat 2/10 Low 7 d/yr ≥94°F today · 15 d/yr by 30 yrs out
- Wind 1/10 Low
- Air quality 2/10 Low 1 unhealthy d/yr today · 2 by 30 yrs out
Nearby sold comps map
Loading sold comps map…
Walkable amenities ~0.75 mi
Loading nearby amenities…
Taxation est. · year 1
- Rental income
- $18,840
- − Mortgage interest
- −$6,156
- − Property taxes
- −$2,803
- − Insurance
- −$550
- − Repairs & maintenance
- −$1,507
- − Management
- −$1,507
- − Depreciation
- −$3,197
- Taxable income
- $3,119
- Est. tax owed @ 24.0%
- −$749
- After-tax cash flow
- $3,866/yr
For passive investors: Depreciation is non-cash, so a rental often shows a tax loss while cash-flowing — sheltering income. Rental losses are passive: they offset passive income freely, and up to $25,000/yr can offset ordinary (W-2) income if you actively participate and your MAGI is under $100k (phasing out to $0 by $150k); unused losses carry forward. On sale, claimed depreciation is recaptured at up to 25%, and gains may owe capital-gains tax (a 1031 exchange can defer both). Figures are a year-1 estimate at your 24.0% rate — not tax advice; consult a CPA.
Schools (NCES district)
- District
- Niagara Falls City School District
- NCES district ID
- 3620820
- Math proficiency
- 26% ▼ -10.00%
- Reading proficiency
- 34% ▲ 3.00%
- Median HH income
- $32,488
- Composite
- 24.5/100
- National rank
- #7655
- State rank
- #578 of 590 in NY
Livability — Niagara Falls
- Score
- 60/100
- State rank
- #956
- US rank
- #18749
Category grades
Schools grade is shown separately in the Schools card above.
Census & demographics
- Census place
- Niagara Falls, NY
- County
- Niagara County · 157,377 people
- City population
- 62,983
- Metro
- Buffalo-Cheektowaga, NY
- Population (ZIP)
- 10,923
- Household income
- $34,549
- Rent vs Own
- Severe rent burden
- 954.0
Population outlook (Niagara County) Hauer SSP2
- Today (2025)
- 204,149 people
- By 2030
- 197,900 · -3.1%
- By 2040
- 182,239 · -10.7%
- By 2050
- 165,198 · -19.1%
- By 2075
- 129,416 · -36.6%
- By 2100
- 96,222 · -52.9%
Race, ethnicity, and origin ACS 2023
- Neighborhood character
- Diverse neighborhood (Simpson 0.58)
- Race & ethnicity
- White 59% Black 25% Two or more races 8% Hispanic / Latino 8% Asian 2%
- Hispanic origin (detail)
- Puerto Rican 3% Cuban 2%
- Common ancestry
- Romanian 6% Slovak 2% Lithuanian 1%
- Foreign-born
- 5% · Canada, China, Dominican Republic
- Languages at home
- 90% English-only · Spanish 6% Other Indo-European 3% Chinese 1%
Political lean MEDSL · Niagara
- 2024 margin
- R (+14.9) · D 42.5% · R 57.5%
- 2008→2024 swing
- -15.9pp toward R · 2008: 1.0pp · 2024: -14.9pp
- All cycles
- 2024: R+14.9 2020: R+9.7 2016: R+19.0 2012: D+0.6 2008: D+1.0
Not yet ingested
- Civics
- —
Market trends
- HPI YoY
- ▲ 15.41%
- Current HPI
- 266.1457
- Rent YoY
- ▲ 8.79%
- Metro
- Buffalo-Cheektowaga, NY
- State GDP YoY
- ▲ 2.60%
- F500 in state
- 92
Industry mix (Fortune 500 HQ in NY)
| Industry | F500 HQs | Revenue |
|---|---|---|
| Financial Services | 10 | $950B |
|
||
| Consumer Goods | 9 | $162B |
|
||
| Insurance | 4 | $225B |
|
||
| Telecommunications | 2 | $144B |
|
||
| Pharmaceuticals | 2 | $112B |
|
||
| Media / Entertainment | 2 | $69B |
|
||
Price history
+214.9% since first listed6 events — show timeline
- 2026-05-08 Price Changed $109,900 WNYREIS
- 2026-03-26 Listed $119,900 WNYREIS
- 2024-04-16 Sold (Public Records) $55,000 Public Records
- 2020-03-09 Sold (Public Records) $50,000 Public Records
- 2014-10-13 Sold (MLS) $22,000 WNYREIS
- 2014-07-08 Listed $34,900 WNYREIS
Property tax history
+7.2%/yrLatest (2025): $2,803 · +16.3% YoY. Source: county tax records.
Cash-flow waterfall
monthlySold comps — $/sqft
last 12 mo · ≤1 miLoading sold comps…