412 S Sierra Madre · Palm Desert, CA
Flood risk 1/10 · Minimal
- FEMA flood zone
- X (unshaded)
- Chance of flooding over 30 yrs
- 0.0%
- Est. flood insurance / yr
- $507 – $1,088
Fire risk 1/10 · Minimal
- Est. fire insurance / yr
- $659 – $1,223
Heat risk 9/10 · Severe
- Hot days now (above 114°F)
- 7 days/yr
- Hot days in 30 yrs
- 18 days/yr
Wind risk 1/10 · Minimal
- Chance of severe wind over 30 yrs
- —
Air-quality risk 4/10 · Minor
- Unhealthy air days now
- 5 days/yr
- Unhealthy air days in 30 yrs
- 6 days/yr
Risk factors via First Street. Map © Google.
Why this score? — see what drove the D grade
The composite is a weighted blend of 9 inputs, each scored 0–100. Each bar is that input's sub-score; the figure is the points it added to the 100-point composite (weight × sub-score).
- Cash flow +10.9/30.0
- ARV discount +9.6/15.0
- 1% rule +5.6/10.0
- Schools +3.8/10.0
- DSCR +3.2/10.0
- Rent growth +2.9/5.0
- Livability +2.6/5.0
- Condition / age +2.5/5.0
- Appreciation +0.0/10.0
$459,000
🖨 Deal sheet 📄 Offer letter ✓ Due diligence
Listing remarks MLS
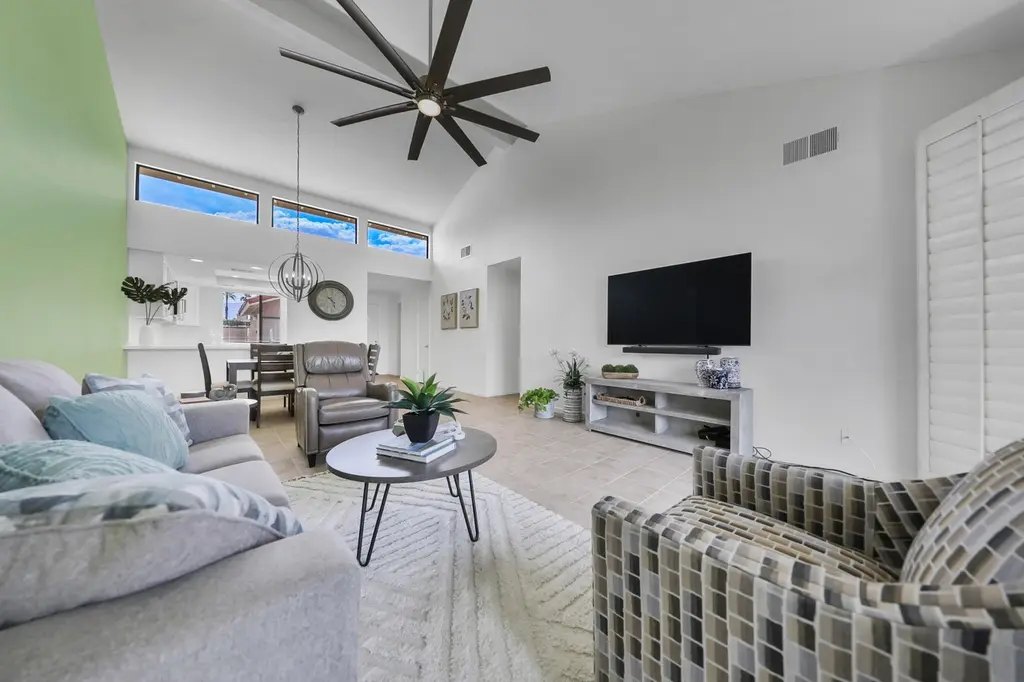
Nestled within the esteemed Monterey Country Club, this sought-after 2-bedroom, 2-bathroom condo with a 2-car garage redefines luxury living. With a symphony of contemporary upgrades including a remodeled kitchen boasting state-of-the-art appliances and a remodeled primary bathroom exuding pristine elegance, the residence exudes modern opulence. Freshness pervades the space, as new interior paint and meticulously curated landscaping harmoniously create a captivating atmosphere. Updated carpet, ceiling fans, and the added convenience of an updated washer and dryer further enhance comfort. Exceptionally maintained, the home offers the luxury of seclusion in the sun-kissed courtyard, while panoramic Fairway and Mountain Views await on the patio, mere steps away from the inviting pool. Whether seeking a seasonal haven, a year-round residence, or a savvy investment, this property effortlessly adapts to fulfill your desires. The Monterey CC community presents an array of amenities including 27 holes of Championship Golf, an impressive 20 Pickleball courts, tennis facilities, and a Fitness Center for your wellness journey. Just a stone's throw away, El Paseo invites you to enjoy fine dining and upscale boutique shopping, adding the final flourish to this masterpiece of modern living. Embrace the exceptional opportunity to immerse yourself in luxury, leisure, and convenience in this extraordinary offering.
Key facts
- Sun-kissed courtyard
- Remodeled kitchen
- 20 pickleball courts
Tags
Neighborhood map
What this means for you Summary
Snapshot
- This is a 2-bed/2.0-bath condo listed at $459k.
Deal economics
- At list price, monthly cash flow is $-200 ($-2k/yr) — negative.
- To cash-flow at today's rent, offer at most $424k (7.7% below list).
- Meets the 1% rule at list price ($5k rent vs $459k).
- Recommended offer: $424k (7.7% below list) — sets the bar for cash-flow.
- Cap rate 5.8% vs local median 3.5% in Palm Desert — top-decile yield for the area; either an underpriced asset or a hidden risk that comps aren't pricing in. Stress-test before assuming the spread holds.
Location & tenants
- Location reads 51/100 on livability (#1,050 in CA) — a working-class tenant base; expect higher turnover. Strengths: schools A-, employment B+, housing B; Watch: crime D, amenities F, commute F.
- Desert Sands Unified (suburban): math 31% / reading 56% proficiency, ranked #199 of 517 in CA (top 38%) — families likely to look elsewhere, expect single-tenant / working-renter base with shorter leases.
- Market conditions: Rents rising (+1.6%/yr); 545 active listings in the ZIP; 40 comparable units currently listed for rent nearby; rentals lingering (median 44d on market — plan ~5-8 weeks vacancy on turnover, expect pricing pressure); 85% of comp listings sitting > 30 days — soft ceiling on asking rent; 9,195 units permitted in Riverside County in 2024 (1,512 in 5+ unit buildings).
- At $4,883/mo this rent would consume 84% of the median local household income ($70k/yr) (locally 1734% of renters already pay >50% of income on rent) — very limited rent-growth headroom before tenants either downsize or default.
Forward outlook
- Local home prices are declining (-3.0%/yr); year-one equity from $3k of loan paydown is wiped out by about $14k of value loss. Plan a longer hold.
- Riverside County population projected at +22% by 2050 — long-run rental-demand tailwind backs the buy-and-hold thesis.
Negotiation context
- It's been on market 70 days — a 6% lower offer ($431k) is reasonable based on typical stale-listing flexibility.
- 11 sale attempts since 21y ago with the ask held roughly flat each time — persistent listings suggest the price (not the market) is what's stuck; bring a comps-based counter.
Risks & watch-outs
- Climate carrying-cost: extreme-heat days projected 7→18/yr by 2055 (HVAC capex compounding) — expect insurance premiums to compound above CPI over the hold.
Questions for the listing agent
- What do current leases actually rent for vs. the listed asking? Can we see a recent rent roll and the last 12 months of T-12 income?
- It's been on market 70 days. Have you received any prior offers? Is the seller open to a 8% concession, seller financing, or rate buy-down credit?
- Built in 1979 — when were the roof, HVAC, electrical panel, plumbing, and water heater last replaced?
- What does the HOA fee cover, when was the last increase, and are there any pending special assessments or reserve-fund shortfalls?
- Any open or pending special assessments — roof, HVAC, plumbing, elevator, façade? What's the per-unit balance and payoff schedule, and is the seller paying it off at close or rolling it to the buyer?
- Why hasn't it sold? Are there any deal-killer items the seller is aware of (foundation, flood, title, zoning, code violations)?
- Is there a deadline driving the sale (1031 exchange, divorce, estate, relocation)? That informs how much negotiation room exists.
- Schools are A-rated — typically a magnet for longer-tenancy family renters. What's the average tenant stay here, and is there a school-zone premium baked into asking?
- Crime grade is D in this area — have there been break-ins, vandalism, or insurance claims at this property in the last 3 years? What carrier currently insures it and at what premium?
- The area grade is low — what's the realistic commute time and amenity access for the typical tenant pool here? Any planned neighborhood developments (good or bad) we should know about?
- What's the average days-on-market for RENTAL listings here right now (not sales)? A rising rental-DOM trend means longer vacancies and softer asking-rent achievability than the comps imply.
- What's the recent tenant-quality profile in this submarket — average credit score on applications, eviction rate, late-payment / NSF rate, and stable-employment percentage? A property-management company in the area should have these aggregated.
- How much new apartment / multifamily construction is in the pipeline within 1–3 miles? Heavy new supply (>2% of stock underway) typically softens rents 12–24 months out; light construction supports rent growth.
Investment metrics
- 1% rule
- 1.06% ✓
- Cap rate
- 5.77%
- Cash-on-cash
- -1.87%
- DSCR
- 0.92
- GRM
- 7.8
CMA / ARV
- ARV (median comp)
- $481,615
- List price
- $459,000
- Delta
- -4.70%
- Verdict
- FAIR
- Comps
- 20 within 1.0 mi
Projected returns pro-forma
-3.0% appreciation · 1.6% rent growth · sell at horizon
- IRR
- -21.3%
- Equity multiple
- 0.27×
- Total profit
- $-93,301
- Equity at exit
- $68,438
- IRR
- -19.2%
- Equity multiple
- 0.05×
- Total profit
- $-122,226
- Equity at exit
- $39,686
Cash invested: $128,520 (down + closing). Projections, not guarantees.
Landlord ↔ Tenant lean methodology
- Overall (STATE)
- 18 Strongly Tenant-Friendly
- State California
- 18 Strongly Tenant-Friendly · D+13
- County
- — inherits STATE
- City
- — inherits STATE
ZIP-level market 92260
- Rents YoY
- 1.6%
- Active inventory
- 545
- Price-to-rent
- 7.8×
Monthly cashflow live
- Estimated rent
- $4,883 high interval (Pro) →
- Mortgage (P&I)
- −$2,407
- Tax from tax record
- −$517 /mo · $6,209/yr
- Insurance
- −$191
- HOA
- −$942
- Vacancy / Maint / Mgmt
- −$1,025
- Net cashflow
- $-200
Break-even live
UW: 25.0% down · 7.5% · 30yr · 1.5% tax · 5.0% vac · 8.0% maint · 8.0% mgmt
Financing live
Cash to close
- Down payment
- $114,750
- Closing costs
- $13,770
- Reserves months
- —
- Total cash needed
- —
Loan-product check · same deal, 3 products live
Conventional
25% down · 7.5% · 30yr
- Down + closing
- —
- Monthly P&I
- —
- Monthly cashflow
- —
- DSCR
- —
- Eligible?
- —
Personal DTI + credit; lowest rate.
DSCR
20% down · 8.5% · 30yr
- Down + closing
- —
- Monthly P&I
- —
- Monthly cashflow
- —
- DSCR
- —
- Eligible?
- —
No personal income docs; deal must DSCR.
Hard money
10% down · 12.0% · 12mo
- Down + closing
- —
- Monthly P&I
- —
- Monthly cashflow
- —
- DSCR
- —
- Eligible?
- —
Short-term bridge; refi at stabilization.
Rent comps 40 comps
| Address | Beds | Baths | Sqft | Rent | $/sqft | DOM | Units | Dist |
|---|---|---|---|---|---|---|---|---|
| 430 S Sierra Madre Palm Desert, CA | 2.0 | 2.0 | 1303 | $5,500 | $4.22 | 43d | 1 | 0.06mi |
| 432 S Sierra Madre Palm Desert, CA | 2.0 | 2.0 | 1584 | $5,300 | $3.35 | 43d | 1 | 0.06mi |
| 352 S Sierra Madre Palm Desert, CA | 2.0 | 2.0 | 1584 | $5,800 | $3.66 | 43d | 1 | 0.08mi |
| 39 Camino Arroyo Pl Palm Desert, CA | 2.0 | 2.0 | 1533 | $6,000 | $3.91 | 43d | 1 | 0.10mi |
| 365 San Remo St Palm Desert, CA | 2.0 | 2.0 | 1303 | $5,500 | $4.22 | 43d | 1 | 0.16mi |
| 363 San Remo St Palm Desert, CA | 2.0 | 2.0 | 1656 | $7,500 | $4.53 | 43d | 1 | 0.16mi |
| 316 S Sierra Madre Palm Desert, CA | 2.0 | 2.0 | 1656 | $5,700 | $3.44 | 43d | 1 | 0.20mi |
| 206 Lakecrest Ln Palm Desert, CA | 2.0 | 2.0 | 1138 | $2,300 | $2.02 | 11d | 1 | 0.20mi |
| 337 Villena Way Palm Desert, CA | 2.0 | 2.0 | 1303 | $5,000 | $3.84 | 43d | 1 | 0.22mi |
| 150 Willow Lake Dr Palm Desert, CA | 2.0 | 2.0 | 1138 | $2,500 | $2.20 | 43d | 1 | 0.23mi |
| 336 Villena Way Palm Desert, CA | 2.0 | 2.0 | 1303 | $5,500 | $4.22 | 43d | 1 | 0.24mi |
| 305 Durango Palm Desert, CA | 2.0 | 2.0 | 1670 | $6,300 | $3.77 | 43d | 1 | 0.25mi |
| 323 San Remo St Palm Desert, CA | 2.0 | 2.0 | 1556 | $8,500 | $5.46 | 43d | 1 | 0.26mi |
| 311 Villena Way Palm Desert, CA | 2.0 | 2.0 | 1653 | $7,000 | $4.23 | 24d | 1 | 0.27mi |
| 295 Cordoba Way Palm Desert, CA | 2.0 | 2.0 | 1800 | $6,000 | $3.33 | 43d | 1 | 0.30mi |
| 92 Presidio Pl Palm Desert, CA | 3.0 | 2.0 | 1821 | $5,500 | $3.02 | 43d | 1 | 0.33mi |
| 82 Presidio Pl Palm Desert, CA | 3.0 | 2.0 | 1851 | $5,500 | $2.97 | 43d | 1 | 0.34mi |
| 166 Wimbledon Ct Palm Desert, CA | 2.0 | 2.0 | 1250 | $3,200 | $2.56 | 43d | 1 | 0.34mi |
| 314 Gran Via Ct Palm Desert, CA | 2.0 | 1.5 | 1303 | $4,700 | $3.61 | 43d | 1 | 0.36mi |
| 345 Gran Via Palm Desert, CA | 2.0 | 2.0 | 1584 | $5,500 | $3.47 | 43d | 1 | 0.38mi |
| 347 Gran Via Palm Desert, CA | 2.0 | 2.0 | 1303 | $5,500 | $4.22 | 43d | 1 | 0.38mi |
| 191 Winterhaven Cir Palm Desert, CA | 2.0 | 1.5 | 1250 | $2,800 | $2.24 | 43d | 1 | 0.38mi |
| 255 San Remo St Palm Desert, CA | 2.0 | 2.0 | 1656 | $6,600 | $3.99 | 43d | 1 | 0.41mi |
| 82 Conejo Cir Palm Desert, CA | 3.0 | 2.0 | 1759 | $6,500 | $3.70 | 43d | 1 | 0.45mi |
| 389 Gran Via Palm Desert, CA | 3.0 | 2.0 | 1670 | $3,750 | $2.25 | 24d | 1 | 0.46mi |
| 181 Camino Arroyo S Palm Desert, CA | 3.0 | 2.0 | 1821 | $6,300 | $3.46 | 43d | 1 | 0.46mi |
| 320 Paseo Primavera Palm Desert, CA | 2.0 | 2.0 | 1303 | $3,000 | $2.30 | 43d | 1 | 0.46mi |
| 73750 Calle Bisque Palm Desert, CA | 3.0 | 2.0 | 1537 | $6,500 | $4.23 | 43d | 1 | 0.49mi |
| 41517 Armanac Ct Palm Desert, CA | 3.0 | 2.0 | 1537 | $3,400 | $2.21 | 2d | 1 | 0.50mi |
| 264 Avenida del Sol Palm Desert, CA | 2.0 | 2.0 | 1800 | $6,000 | $3.33 | 43d | 1 | 0.51mi |
| 280 Tolosa Cir Palm Desert, CA | 2.0 | 2.0 | 1347 | $6,000 | $4.45 | 43d | 1 | 0.52mi |
| 280 Tolosa Cir Palm Desert, CA | 2.0 | 2.0 | 1347 | $6,000 | $4.45 | 24d | 1 | 0.52mi |
| 217 Las Lomas Palm Desert, CA | 2.0 | 2.0 | 1656 | $6,300 | $3.80 | 43d | 1 | 0.53mi |
| 240 Santa Barbara Cir Palm Desert, CA | 2.0 | 2.0 | 1457 | $6,000 | $4.12 | 24d | 1 | 0.54mi |
| 246 Santa Barbara Cir Palm Desert, CA | 2.0 | 2.0 | 1656 | $9,000 | $5.43 | 43d | 1 | 0.55mi |
| 281 Tolosa Cir Palm Desert, CA | 2.0 | 2.0 | 1303 | $5,500 | $4.22 | 43d | 1 | 0.55mi |
| 254 Santa Barbara Cir Palm Desert, CA | 2.0 | 2.0 | 1656 | $8,000 | $4.83 | 43d | 1 | 0.56mi |
| 205 Las Lomas Palm Desert, CA | 2.0 | 2.0 | 1457 | $6,000 | $4.12 | 43d | 1 | 0.57mi |
| 235 Santa Barbara Cir Palm Desert, CA | 3.0 | 3.0 | 1800 | $7,500 | $4.17 | 43d | 1 | 0.57mi |
| 278 San Vicente Cir Palm Desert, CA | 2.0 | 2.0 | 1656 | $5,200 | $3.14 | 43d | 1 | 0.58mi |
HOA detail condo
- Monthly dues
- $942 · $11,304/yr
- Likely covers
- landscapingpoolgym
- Assessments
- None detected in remarks — confirm with the listing agent.
Listing history 43 events
-
2026-06-18days on market $459,000 Active 70 DOM
-
2026-06-17pricedays on market $459,000 Active 69 DOM
-
2026-06-16days on market $465,000 Active 68 DOM
-
2026-06-15days on market $465,000 Active 67 DOM
-
2026-06-13days on market $465,000 Active 65 DOM
-
2026-06-09days on market $465,000 Active 61 DOM
-
2026-06-08days on market $465,000 Active 60 DOM
-
2026-06-07days on market $465,000 Active 59 DOM
-
2026-06-04days on market $465,000 Active 56 DOM
-
2026-06-03days on market $465,000 Active 55 DOM
-
2026-06-02days on market $465,000 Active 54 DOM
-
2026-06-01days on market $465,000 Active 53 DOM
-
2026-05-31days on market $465,000 Active 52 DOM
-
2026-04-09$475,000 Active 1421-char remark
Show marketing remark (1421 chars)
Nestled within the esteemed Monterey Country Club, this sought-after 2-bedroom, 2-bathroom condo with a 2-car garage redefines luxury living. With a symphony of contemporary upgrades including a remodeled kitchen boasting state-of-the-art appliances and a remodeled primary bathroom exuding pristine elegance, the residence exudes modern opulence. Freshness pervades the space, as new interior paint and meticulously curated landscaping harmoniously create a captivating atmosphere. Updated carpet, ceiling fans, and the added convenience of an updated washer and dryer further enhance comfort. Exceptionally maintained, the home offers the luxury of seclusion in the sun-kissed courtyard, while panoramic Fairway and Mountain Views await on the patio, mere steps away from the inviting pool. Whether seeking a seasonal haven, a year-round residence, or a savvy investment, this property effortlessly adapts to fulfill your desires. The Monterey CC community presents an array of amenities including 27 holes of Championship Golf, an impressive 20 Pickleball courts, tennis facilities, and a Fitness Center for your wellness journey. Just a stone's throw away, El Paseo invites you to enjoy fine dining and upscale boutique shopping, adding the final flourish to this masterpiece of modern living. Embrace the exceptional opportunity to immerse yourself in luxury, leisure, and convenience in this extraordinary offering.
-
2026-04-08historical
-
2026-04-06status Active
-
2025-09-18$499,000 Active
-
2025-04-11price $5,200
-
2024-05-31$5,100
-
2023-11-20soldstatus $459,000 Closed
-
2023-11-20soldstatus $459,000
-
2023-11-09status Pending
-
2023-10-29historical Active Under Contract
-
2023-10-12price $479,000
-
2023-09-12price $499,000
-
2023-08-29$525,000 Active
-
2023-06-06soldstatus $400,000 Closed
-
2023-06-06soldstatus $400,000
-
2023-04-24status Pending
-
2023-04-11$425,000 Active
-
2017-11-02status Pending
-
2017-11-02$245,000 Active
-
2017-11-01soldstatus $245,000 Sold
-
2017-11-01soldstatus $245,000
-
2017-06-30historical
-
2017-04-05$249,000 Active
-
2017-01-31historical
-
2016-12-30status Active
-
2016-12-28historical Hold
-
2016-12-02$249,000 Active
-
2005-07-08soldstatus $365,000
-
2005-06-02historical
-
2005-05-30$369,000
ⓘ Source: listings_history table (triggers on properties + properties_extension) + one-shot
backfill from property_details.listing_events for pre-trigger history.
Tax reassessment forecast CA · Resets to sale price
- Current annual tax
- $6,209 · $517/mo
- Projected year-2 tax
- $6,209 · $517/mo
- Expected delta
- $0/yr ($0/mo · 0.0%)
ⓘ Screening estimate from a state-policy table — verify with the county assessor before closing.
Climate risk First Street
- Flood 1/10 Low FEMA zone X (unshaded) · 0% chance over 30 yrs
- Wildfire 1/10 Low
- Heat 9/10 Extreme 7 d/yr ≥114°F today · 18 d/yr by 30 yrs out
- Wind 1/10 Low
- Air quality 4/10 Moderate 5 unhealthy d/yr today · 6 by 30 yrs out
Nearby sold comps map
Loading sold comps map…
Walkable amenities ~0.75 mi
Loading nearby amenities…
Taxation est. · year 1
- Rental income
- $58,594
- − Mortgage interest
- −$25,711
- − Property taxes
- −$6,209
- − Insurance
- −$2,295
- − Repairs & maintenance
- −$4,687
- − Management
- −$4,687
- − HOA
- −$11,304
- − Depreciation
- −$13,353
- Taxable loss
- −$9,653
- Est. tax savings @ 24.0%
- +$2,317
- After-tax cash flow
- $-87/yr
For passive investors: Depreciation is non-cash, so a rental often shows a tax loss while cash-flowing — sheltering income. Rental losses are passive: they offset passive income freely, and up to $25,000/yr can offset ordinary (W-2) income if you actively participate and your MAGI is under $100k (phasing out to $0 by $150k); unused losses carry forward. On sale, claimed depreciation is recaptured at up to 25%, and gains may owe capital-gains tax (a 1031 exchange can defer both). Figures are a year-1 estimate at your 24.0% rate — not tax advice; consult a CPA.
Schools (NCES district)
- District
- Desert Sands Unified
- NCES district ID
- 0611110
- Math proficiency
- 31% ▼ -4.00%
- Reading proficiency
- 56% ▲ 7.00%
- Median HH income
- $54,957
- Composite
- 37.77/100
- National rank
- #4346
- State rank
- #199 of 517 in CA
Livability — Palm Desert
- Score
- 51/100
- State rank
- #1050
- US rank
- #25164
Category grades
Schools grade is shown separately in the Schools card above.
Census & demographics
- Census place
- Palm Desert, CA
- County
- Riverside County · 2,287,001 people
- City population
- 58,615
- Metro
- Riverside-San Bernardino-Ontario, CA
- Population (ZIP)
- 30,523
- Household income
- $70,091
- Rent vs Own
- Severe rent burden
- 1734.0
Population outlook (Riverside County) Hauer SSP2
- Today (2025)
- 2,664,475 people
- By 2030
- 2,802,692 · +5.2%
- By 2040
- 3,050,904 · +14.5%
- By 2050
- 3,256,783 · +22.2%
- By 2075
- 3,655,058 · +37.2%
- By 2100
- 3,766,594 · +41.4%
Race, ethnicity, and origin ACS 2023
- Neighborhood character
- Majority White (61%)
- Race & ethnicity
- White 61% Hispanic / Latino 31% Two or more races 20% Asian 4% Black 2%
- Hispanic origin (detail)
- Mexican 25%
- Common ancestry
- Italian 4% Lithuanian 3% Slovak 2%
- Foreign-born
- 18% · Canada, South Korea, Vietnam
- Languages at home
- 73% English-only · Spanish 22% French/Haitian/Cajun 1% Other Indo-European 1%
Political lean MEDSL · Riverside
- 2024 margin
- Toss-up / Even · D 48.0% · R 49.3% · Other 2.6%
- 2008→2024 swing
- -3.6pp toward R · 2008: 2.3pp · 2024: -1.3pp
- All cycles
- 2024: R+1.3 2020: D+8.0 2016: D+4.3 2012: R+0.4 2008: D+2.3
Not yet ingested
- Civics
- —
Market trends
- HPI YoY
- ▼ -364.94%
- Current HPI
- 294.9425
- Rent YoY
- ▲ 1.60%
- Metro
- Riverside-San Bernardino-Ontario, CA
- State GDP YoY
- ▲ 3.21%
- F500 in state
- 116
Industry mix (Fortune 500 HQ in CA)
| Industry | F500 HQs | Revenue |
|---|---|---|
| Technology | 27 | $1,492B |
|
||
| Financial Services | 3 | $174B |
|
||
| Retail | 3 | $44B |
|
||
| Insurance | 3 | $26B |
|
||
| Media / Entertainment | 2 | $115B |
|
||
| Pharmaceuticals / Biotech | 2 | $62B |
|
||
Price history
+28.7% since first listed30 events — show timeline
- 2026-04-09 Listed $475,000 GPSMLS
- 2026-04-08 Listing Removed — GPSMLS
- 2026-04-06 Relisted — GPSMLS
- 2025-09-18 Listed $499,000 GPSMLS
- 2025-04-11 Price Changed $5,200 CRMLS
- 2024-05-31 Listed for Rent $5,100 CRMLS
- 2023-11-20 Sold (Public Records) $459,000 Public Records
- 2023-11-20 Sold (MLS) $459,000 GPSMLS
- 2023-11-09 Pending — GPSMLS
- 2023-10-29 Contingent — GPSMLS
- 2023-10-12 Price Changed $479,000 GPSMLS
- 2023-09-12 Price Changed $499,000 GPSMLS
- 2023-08-29 Listed $525,000 GPSMLS
- 2023-06-06 Sold (Public Records) $400,000 Public Records
- 2023-06-06 Sold (MLS) $400,000 GPSMLS
- 2023-04-24 Pending — GPSMLS
- 2023-04-11 Listed $425,000 GPSMLS
- 2017-11-02 Pending — GPSMLS
- 2017-11-02 Listed $245,000 GPSMLS
- 2017-11-01 Sold (Public Records) $245,000 Public Records
- 2017-11-01 Sold (MLS) $245,000 GPSMLS
- 2017-06-30 Listing Removed — GPSMLS
- 2017-04-05 Listed $249,000 GPSMLS
- 2017-01-31 Listing Removed — GPSMLS
- 2016-12-30 Relisted — GPSMLS
- 2016-12-28 Delisted — GPSMLS
- 2016-12-02 Listed $249,000 GPSMLS
- 2005-07-08 Sold (Public Records) $365,000 Public Records
- 2005-06-02 Listing Removed — GPSMLS
- 2005-05-30 Listed $369,000 GPSMLS
Property tax history
+2.3%/yrLatest (2025): $6,209 · +2.4% YoY. Source: county tax records.
Cash-flow waterfall
monthlySold comps — $/sqft
last 12 mo · ≤1 miLoading sold comps…