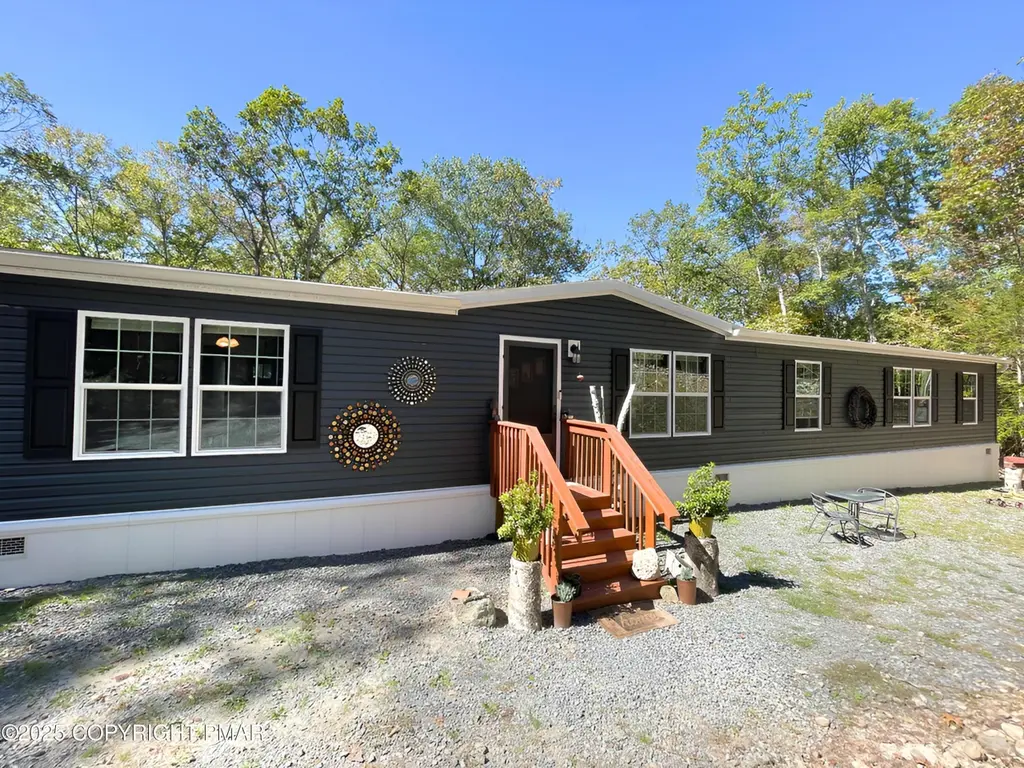
3177 Stony Run Ln · Mountainhome, PA
Flood risk No data
- FEMA flood zone
- —
- Chance of flooding over 30 yrs
- —
- Est. flood insurance / yr
- —
Fire risk No data
- Est. fire insurance / yr
- —
Heat risk No data
- Hot days now (above threshold)
- —
- Hot days in 30 yrs
- —
Wind risk No data
- Chance of severe wind over 30 yrs
- —
Air-quality risk No data
- Unhealthy air days now
- —
- Unhealthy air days in 30 yrs
- —
Risk factors via First Street. Map © Google.
Why this score? — see what drove the D- grade
The composite is a weighted blend of 9 inputs, each scored 0–100. Each bar is that input's sub-score; the figure is the points it added to the 100-point composite (weight × sub-score).
- Appreciation +10.0/10.0
- ARV discount +8.2/15.0
- Cash flow +6.3/30.0
- Livability +3.7/5.0
- Schools +3.0/10.0
- Rent growth +2.5/5.0
- Condition / age +2.5/5.0
- 1% rule +1.6/10.0
- DSCR +0.6/10.0
$329,900
🖨 Deal sheet (PDF) 📄 Offer letter ✓ Due diligence
Listing remarks MLS
Built in 2024, this new 4 bed, 2 bath sustainably built home offers over 2,100 sq ft of modern living space on 1.36 private acres -- with no HOA! Pride of ownership shines throughout, with thoughtful design and quality finishes that make this home truly stand out. Whether you're looking for a primary residence, vacation getaway, or short-term rental investment, it's located in an STR-friendly township, offering both lifestyle flexibility and income potential.
Key facts
- Private acres
- Thoughtful design
- Quality finishes
Tags
Neighborhood map
What this means for you Summary
Snapshot
- This is a 4-bed/2.5-bath manufactured listed at $330k.
Deal economics
- At list price, monthly cash flow is $-580 ($-7k/yr) — negative.
- To cash-flow at today's rent, offer at most $227k (31.1% below list).
- To meet the 1% rule (rent ≥ 1% of price), the offer needs to be $218k (34.0% below list).
- Recommended offer: $218k (34.0% below list) — sets the bar for 1% rule.
- Cap rate 4.2% vs local median 3.0% in Mountainhome — top-decile yield for the area; either an underpriced asset or a hidden risk that comps aren't pricing in. Stress-test before assuming the spread holds.
Location & tenants
- Location reads 73/100 on livability (#582 in PA) — a middle-class / working-renter tenant base. Strengths: cost of living A+, housing A+, health & safety A+; Watch: schools D, amenities F, commute F.
- East Stroudsburg Area SD (rural): math 25% / reading 43% proficiency, ranked #413 of 539 in PA (top 77%) — families likely to look elsewhere, expect single-tenant / working-renter base with shorter leases.
- Market conditions: 62 active listings in the ZIP; 278 units permitted in Monroe County in 2024 (52 in 5+ unit buildings).
Forward outlook
- In year one you build about $35k of equity ($2k loan paydown + $33k appreciation (10.0% local appreciation)).
- Monroe County population projected at -11% by 2050 — secular population decline; favor cash flow + early exit over multi-decade hold.
- By year 2, paydown + projected appreciation supports a ~$57k cash-out refi (75% LTV) — recoverable capital for the next deal without selling this one.
Negotiation context
- It's been on market 268 days — a 12% lower offer ($290k) is reasonable based on typical stale-listing flexibility.
- 2 sale attempts since 17y ago; this cycle's ask has dropped $19k (5%) from the opening price — seller is motivated, your offer sets the floor, not the list.
- Current owner paid $20k; list at $330k implies a 1550% gain — meaningful room to come down on a strong offer.
Questions for the listing agent
- What do current leases actually rent for vs. the listed asking? Can we see a recent rent roll and the last 12 months of T-12 income?
- It's been on market 268 days. Have you received any prior offers? Is the seller open to a 34% concession, seller financing, or rate buy-down credit?
- Why hasn't it sold? Are there any deal-killer items the seller is aware of (foundation, flood, title, zoning, code violations)?
- Is there a deadline driving the sale (1031 exchange, divorce, estate, relocation)? That informs how much negotiation room exists.
- Schools are D-rated, which usually means shorter tenancies and higher turnover. Who's the typical renter profile here, and what's been the actual vacancy rate?
- The area grade is low — what's the realistic commute time and amenity access for the typical tenant pool here? Any planned neighborhood developments (good or bad) we should know about?
- What's the average days-on-market for RENTAL listings here right now (not sales)? A rising rental-DOM trend means longer vacancies and softer asking-rent achievability than the comps imply.
- What's the recent tenant-quality profile in this submarket — average credit score on applications, eviction rate, late-payment / NSF rate, and stable-employment percentage? A property-management company in the area should have these aggregated.
- How much new for-sale + rental construction is in the pipeline within 1–3 miles? Heavy new supply typically softens prices + rents 12–24 months out; constrained supply supports both.
Investment metrics
- 1% rule
- 0.66% ✗
- Cap rate
- 4.18%
- Cash-on-cash
- -7.54%
- DSCR
- 0.66
- GRM
- 12.6
CMA / ARV
- ARV (median comp)
- $335,117
- List price
- $329,900
- Delta
- -1.56%
- Verdict
- FAIR
- Comps
- 20 within 1.0 mi
Projected returns pro-forma
10.0% appreciation · 3.0% rent growth · sell at horizon
- IRR
- 19.0%
- Equity multiple
- 2.55×
- Total profit
- $142,775
- Equity at exit
- $297,200
- IRR
- 17.5%
- Equity multiple
- 5.87×
- Total profit
- $449,588
- Equity at exit
- $640,923
Cash invested: $92,372 (down + closing). Projections, not guarantees.
Landlord ↔ Tenant lean methodology
- Overall (STATE)
- 62 Landlord-Friendly
- State Pennsylvania
- 62 Landlord-Friendly · EVEN
- County
- — inherits STATE
- City
- — inherits STATE
ZIP-level market 18326
- Home prices YoY
- 7.6%
- Active inventory
- 62
- Price-to-rent
- 12.6×
Monthly cashflow live
- Estimated rent
- $2,176 medium interval (Pro) →
- Mortgage (P&I)
- −$1,730
- Tax from tax record
- −$432 /mo · $5,182/yr
- Insurance
- −$137
- HOA
- −$0
- Vacancy / Maint / Mgmt
- −$457
- Net cashflow
- $-580
Break-even live
Sensitivity live
| Price | -10% $-393 | -5% $-487 | +0% $-580 | +5% $-673 | +10% $-767 |
|---|---|---|---|---|---|
| Rent | -10% $-752 | -5% $-666 | +0% $-580 | +5% $-494 | +10% $-408 |
| Rate | -1.0pp $-414 | -0.5pp $-496 | base $-580 | +0.5pp $-666 | +1.0pp $-752 |
UW: 25.0% down · 7.5% · 30yr · 1.5% tax · 5.0% vac · 8.0% maint · 8.0% mgmt
Financing live
Cash to close
- Down payment
- $82,475
- Closing costs
- $9,897
- Reserves months
- —
- Total cash needed
- —
Loan-product check · same deal, 3 products live
Conventional
25% down · 7.5% · 30yr
- Down + closing
- —
- Monthly P&I
- —
- Monthly cashflow
- —
- DSCR
- —
- Eligible?
- —
Personal DTI + credit; lowest rate.
DSCR
20% down · 8.5% · 30yr
- Down + closing
- —
- Monthly P&I
- —
- Monthly cashflow
- —
- DSCR
- —
- Eligible?
- —
No personal income docs; deal must DSCR.
Hard money
10% down · 12.0% · 12mo
- Down + closing
- —
- Monthly P&I
- —
- Monthly cashflow
- —
- DSCR
- —
- Eligible?
- —
Short-term bridge; refi at stabilization.
Listing history 22 events
-
2026-06-19days on market $329,900 Active 268 DOM
-
2026-06-18days on market $329,900 Active 267 DOM
-
2026-06-17days on market $329,900 Active 266 DOM
-
2026-06-16days on market $329,900 Active 265 DOM
-
2026-06-15days on market $329,900 Active 264 DOM
-
2026-06-14days on market $329,900 Active 262 DOM
-
2026-06-13days on market $329,900 Active 261 DOM
-
2026-06-10days on market $329,900 Active 259 DOM
-
2026-06-09days on market $329,900 Active 258 DOM
-
2026-06-08days on market $329,900 Active 257 DOM
-
2026-06-07days on market $329,900 Active 256 DOM
-
2026-06-05days on market $329,900 Active 253 DOM
-
2026-06-02days on market $329,900 Active 251 DOM
-
2026-06-01days on market $329,900 Active 250 DOM
-
2026-05-31days on market $329,900 Active 249 DOM
-
2026-05-30days on market $329,900 Active 248 DOM
-
2026-04-30price $329,900 464-char remark
Show marketing remark (464 chars)
Built in 2024, this new 4 bed, 2 bath sustainably built home offers over 2,100 sq ft of modern living space on 1.36 private acres -- with no HOA! Pride of ownership shines throughout, with thoughtful design and quality finishes that make this home truly stand out. Whether you're looking for a primary residence, vacation getaway, or short-term rental investment, it's located in an STR-friendly township, offering both lifestyle flexibility and income potential.
-
2025-11-05price $340,000 464-char remark
Show marketing remark (464 chars)
Built in 2024, this new 4 bed, 2 bath sustainably built home offers over 2,100 sq ft of modern living space on 1.36 private acres -- with no HOA! Pride of ownership shines throughout, with thoughtful design and quality finishes that make this home truly stand out. Whether you're looking for a primary residence, vacation getaway, or short-term rental investment, it's located in an STR-friendly township, offering both lifestyle flexibility and income potential.
-
2025-09-24$349,000 Active 464-char remark
Show marketing remark (464 chars)
Built in 2024, this new 4 bed, 2 bath sustainably built home offers over 2,100 sq ft of modern living space on 1.36 private acres -- with no HOA! Pride of ownership shines throughout, with thoughtful design and quality finishes that make this home truly stand out. Whether you're looking for a primary residence, vacation getaway, or short-term rental investment, it's located in an STR-friendly township, offering both lifestyle flexibility and income potential.
-
2021-11-15soldstatus $20,000
-
2009-01-26$259,900
-
2006-03-22soldstatus $30,000
ⓘ Source: listings_history table (triggers on properties + properties_extension) + one-shot
backfill from property_details.listing_events for pre-trigger history.
Tax reassessment forecast PA · Partial reset (capped growth)
- Current annual tax
- $5,182 · $432/mo
- Projected year-2 tax
- $5,197 · $433/mo
- Expected delta
- +$15/yr (+$1/mo · 0.3%)
ⓘ Screening estimate from a state-policy table — verify with the county assessor before closing.
Nearby sold comps map
Loading sold comps map…
Walkable amenities ~0.75 mi
Loading nearby amenities…
Taxation est. · year 1
- Rental income
- $26,116
- − Mortgage interest
- −$18,480
- − Property taxes
- −$5,182
- − Insurance
- −$1,650
- − Repairs & maintenance
- −$2,089
- − Management
- −$2,089
- − Depreciation
- −$9,597
- Taxable loss
- −$12,971
- Est. tax savings @ 24.0%
- +$3,113
- After-tax cash flow
- $-3,847/yr
For passive investors: Depreciation is non-cash, so a rental often shows a tax loss while cash-flowing — sheltering income. Rental losses are passive: they offset passive income freely, and up to $25,000/yr can offset ordinary (W-2) income if you actively participate and your MAGI is under $100k (phasing out to $0 by $150k); unused losses carry forward. On sale, claimed depreciation is recaptured at up to 25%, and gains may owe capital-gains tax (a 1031 exchange can defer both). Figures are a year-1 estimate at your 24.0% rate — not tax advice; consult a CPA.
Schools (NCES district)
- District
- East Stroudsburg Area SD
- NCES district ID
- 4208670
- Math proficiency
- 25% ▼ -11.00%
- Reading proficiency
- 43% ▼ -18.00%
- Median HH income
- $57,142
- Composite
- 30.13/100
- National rank
- #6332
- State rank
- #413 of 539 in PA
Livability — Mountainhome
- Score
- 73/100
- State rank
- #582
- US rank
- #5598
Category grades
Schools grade is shown separately in the Schools card above.
Census & demographics
- Population (ZIP)
- 3,574
Population outlook (Monroe County) Hauer SSP2
- Today (2025)
- 164,099 people
- By 2030
- 161,412 · -1.6%
- By 2040
- 154,616 · -5.8%
- By 2050
- 146,710 · -10.6%
- By 2075
- 140,830 · -14.2%
- By 2100
- 138,472 · -15.6%
Race, ethnicity, and origin ACS 2023
- Neighborhood character
- Predominantly White (68%)
- Race & ethnicity
- White 68% Hispanic / Latino 12% Two or more races 10% Black 8% Asian 2% Native American 1%
- Hispanic origin (detail)
- Mexican 2% Puerto Rican 6% Dominican 1%
- Common ancestry
- Romanian 2% Slovak 1% Lithuanian 1%
- Foreign-born
- 6% · Canada, South Korea, Jamaica
- Languages at home
- 91% English-only · Spanish 4% Russian/Polish/Slavic 2% Other Indo-European 1%
Political lean MEDSL · Monroe
- 2024 margin
- Toss-up / Even · D 49.1% · R 49.9%
- 2008→2024 swing
- -17.1pp toward R · 2008: 16.3pp · 2024: -0.8pp
- All cycles
- 2024: R+0.8 2020: D+6.4 2016: D+0.3 2012: D+14.0 2008: D+16.3
Not yet ingested
- Civics
- —
Market trends
- HPI YoY
- ▲ 13.09%
- Current HPI
- 185.198
- Rent YoY
- —
- Metro
- —
- State GDP YoY
- ▲ 1.68%
- F500 in state
- 34
Industry mix (Fortune 500 HQ in PA)
| Industry | F500 HQs | Revenue |
|---|---|---|
| Healthcare | 2 | $309B |
|
||
| Insurance | 2 | $27B |
|
||
| Telecommunications / Media | 1 | $124B |
|
||
| Industrial Distribution | 1 | $22B |
|
||
| Financial Services | 1 | $20B |
|
||
| Chemicals / Materials | 1 | $18B |
|
||
Price history
+999.7% since first listed6 events — show timeline
- 2026-04-30 Price Changed $329,900 PMAR
- 2025-11-05 Price Changed $340,000 PMAR
- 2025-09-24 Listed $349,000 PMAR
- 2021-11-15 Sold (Public Records) $20,000 Public Records
- 2009-01-26 Listed $259,900 PMAR
- 2006-03-22 Sold (Public Records) $30,000 Public Records
Property tax history
+33.7%/yrLatest (2026): $5,182 · +1.7% YoY. Source: county tax records.
Cash-flow waterfall
monthlySold comps — $/sqft
last 12 mo · ≤1 miLoading sold comps…