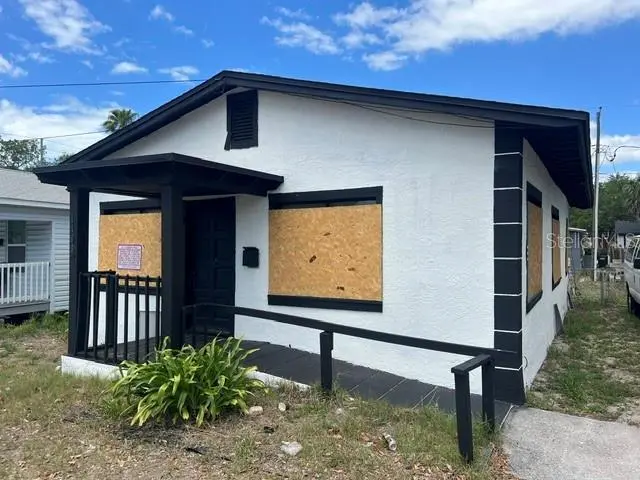
1106 Carlton St · Clearwater, FL
Flood risk 1/10 · Minimal
- FEMA flood zone
- X (unshaded)
- Chance of flooding over 30 yrs
- 0.0%
- Est. flood insurance / yr
- $507 – $1,088
Fire risk 1/10 · Minimal
- Est. fire insurance / yr
- $947 – $1,759
Heat risk 10/10 · Severe
- Hot days now (above 107°F)
- 7 days/yr
- Hot days in 30 yrs
- 27 days/yr
Wind risk 10/10 · Severe
- Chance of severe wind over 30 yrs
- 99.0%
Air-quality risk 3/10 · Minor
- Unhealthy air days now
- 2 days/yr
- Unhealthy air days in 30 yrs
- 3 days/yr
Risk factors via First Street. Map © Google.
Why this score? — see what drove the C+ grade
The composite is a weighted blend of 9 inputs, each scored 0–100. Each bar is that input's sub-score; the figure is the points it added to the 100-point composite (weight × sub-score).
- Cash flow +21.6/30.0
- ARV discount +15.0/15.0
- DSCR +6.9/10.0
- 1% rule +4.9/10.0
- Schools +4.3/10.0
- Livability +4.1/5.0
- Condition / age +2.5/5.0
- Rent growth +2.0/5.0
- Appreciation +0.0/10.0
$183,900
🖨 Deal sheet (PDF) 📄 Offer letter ✓ Due diligence
Listing remarks
Welcome to 1106 Carlton St, Clearwater, FL 33755, a great opportunity for investors, renovators, or buyers looking for value in the heart of Clearwater, Florida. This 3-bedroom, 1-bath single-family home offers strong potential for those willing to bring a little vision and finishing work to the property. The home was recently renovated, but unfortunately experienced vandalism after the improvements were completed, which has led the seller to make the decision to sell. While the property may currently show with boarded windows, don’t let that discourage you — much of the heavy lifting has already been completed and the home offers a solid foundation for the right buyer. Since pu
Key facts
- Renovated bathroom
- New flooring
- Updated countertops
Tags
Property features AI
Finance
- Financial info: No lease restrictions indicated
- HOA & community: No homeowners association indicated; Pets allowed
Exterior
- Parking: Paved road access
- Utilities: Public water; Public sewer; Cable available; Electricity available; Water available; Sewer available
- Home design: Single family residence; Residential property; One level; North-facing
- Construction: Stucco and frame construction; Shingle roof; Crawlspace foundation; Pillar/post/pier foundation; Completed condition; Built with approximately 925 sq ft living area
- Exterior features: Outdoor lighting; Private mailbox; Sidewalk
Interior
- Kitchen: Other appliances
- Bedrooms: 3 bedrooms
- Flooring: Laminate flooring; Tile flooring
- Bathrooms: 1 full bathroom
- Heating & cooling: Central heating (electric); Central air conditioning
- Interior features: Open floorplan; Thermostat
- Laundry & utility: Other laundry features
Neighborhood map
What this means for you Summary
Snapshot
- This is a 3-bed/1.0-bath single-family listed at $184k.
Deal economics
- At list price, monthly cash flow is $278 ($3k/yr) — positive.
- The deal already cash-flows at list — no discount required.
- To meet the 1% rule (rent ≥ 1% of price), the offer needs to be $182k (1.0% below list).
- Recommended offer: $173k (6.0% below list) — sets the bar for market timing.
- Cap rate 8.1% vs local median 3.0% in Clearwater — top-decile yield for the area; either an underpriced asset or a hidden risk that comps aren't pricing in. Stress-test before assuming the spread holds.
Location & tenants
- Location reads 82/100 on livability (#60 in FL, #988 nationally) — a professional / high-income tenant draw. Strengths: commute A+, housing A+, health & safety A+; Watch: employment C-.
- Pinellas (suburban): math 51% / reading 51% proficiency, ranked #31 of 73 in FL (top 42%) — acceptable for families but not a draw, mixed tenant base, ~2y average lease.
- Zoned schools: Sandy Lane Elementary School (math 32% / reading 22%, grade F, #1,969 of 2,144 statewide, top 94%, 304 students, 85% FRL); Clearwater High School (math 30% / reading 36%, grade F, #406 of 667 statewide, top 61%, 1,664 students, 59% FRL) — zoned schools average 72% FRL vs 48% district-wide (24 pts higher); higher-poverty schools than district average — tighter screening recommended.
- Zoned-school proficiency averages 30% at this address vs 51% district-wide (-21 pts) — the specific schools serving this property underperform the Pinellas average; the district grade overstates school quality for this exact location.
- Market conditions: Rents soft (-2.2%/yr); 265 active listings in the ZIP; 40 comparable units currently listed for rent nearby; rentals at typical pace (median 14d on market — plan ~3-4 weeks tenant-placement turnaround); 2,676 units permitted in Pinellas County in 2024 (1,422 in 5+ unit buildings).
Forward outlook
- Local home prices are declining (-3.0%/yr); year-one equity from $1k of loan paydown is wiped out by about $6k of value loss. Plan a longer hold.
- Pinellas County population projected at +14% by 2050 — modest demand growth; plan on rents tracking national, not racing it.
Negotiation context
- It's been on market 71 days — a 6% lower offer ($173k) is reasonable based on typical stale-listing flexibility.
- 3 sale attempts with the ask held roughly flat each time — persistent listings suggest the price (not the market) is what's stuck; bring a comps-based counter.
- Current owner paid $120k; list at $184k implies a 53% gain — meaningful room to come down on a strong offer.
Risks & watch-outs
- Watch-outs: built in 1925 — expect roof / HVAC / electrical / plumbing capex.
- Climate carrying-cost: severe wind risk, 99% chance of damaging wind over 30y; extreme-heat days projected 7→27/yr by 2055 (HVAC capex compounding) — expect insurance premiums to compound above CPI over the hold.
Questions for the listing agent
- It's been on market 71 days. Have you received any prior offers? Is the seller open to a 6% concession, seller financing, or rate buy-down credit?
- Built in 1925 — when were the roof, HVAC, electrical panel, plumbing, and water heater last replaced?
- Why hasn't it sold? Are there any deal-killer items the seller is aware of (foundation, flood, title, zoning, code violations)?
- Is there a deadline driving the sale (1031 exchange, divorce, estate, relocation)? That informs how much negotiation room exists.
- What's the average days-on-market for RENTAL listings here right now (not sales)? A rising rental-DOM trend means longer vacancies and softer asking-rent achievability than the comps imply.
- What's the recent tenant-quality profile in this submarket — average credit score on applications, eviction rate, late-payment / NSF rate, and stable-employment percentage? A property-management company in the area should have these aggregated.
- How much new for-sale + rental construction is in the pipeline within 1–3 miles? Heavy new supply typically softens prices + rents 12–24 months out; constrained supply supports both.
Investment metrics
- 1% rule
- 0.99% ✗
- Cap rate
- 8.11%
- Cash-on-cash
- 6.48%
- DSCR
- 1.29
- GRM
- 8.4
CMA / ARV
- ARV (on-the-fly)
- $256,225
- Comps found
- 12
Show comp detail 12 sales within ~0.75 mi
| Address | Dist | Beds/Ba | Sqft | Sold | Price | $/sf | Match |
|---|---|---|---|---|---|---|---|
| 1122 Tangerine St | 0.07mi | 3/1.0 | 976 (+6%) | 17mo | $270,000 | $277 | 73 |
| 925 Marshall St | 0.09mi | 2/1.0 (-1) | 852 (-8%) | 9mo | $140,000 | $164 | 70 |
| 1609 N Washington Ave | 0.13mi | 3/1.0 | 984 (+6%) | 18mo | $198,000 | $201 | 69 |
| 1145 Palm Bluff St | 0.24mi | 3/2.0 | 989 (+7%) | 8mo | $247,000 | $250 | 67 |
| 1777 Apache Trl | 0.42mi | 2/1.0 (-1) | 944 (+2%) | 14mo | $248,000 | $263 | 61 |
| 507 Engman ST St | 0.36mi | 3/2.0 | 910 (-2%) | 22mo | $315,000 | $346 | 59 |
| 1134 Fairmont St | 0.23mi | 2/1.0 (-1) | 996 (+8%) | 23mo | $300,000 | $301 | 52 |
| 308 Pennsylvania Ave | 0.71mi | 3/1.0 | 904 (-2%) | 17mo | $215,000 | $238 | 49 |
| 1838 Springtime Ave | 0.56mi | 2/1.0 (-1) | 845 (-9%) | 7mo | $385,000 | $456 | 48 |
| 1208 Claire Dr | 0.41mi | 4/1.0 (+1) | 1,023 (+11%) | 13mo | $240,000 | $235 | 48 |
| 1361 Springdale St | 0.69mi | 2/1.0 (-1) | 976 (+6%) | 10mo | $280,000 | $287 | 46 |
| 1851 N Washington Ave | 0.61mi | 2/1.0 (-1) | 1,032 (+12%) | 4mo | $340,000 | $329 | 44 |
Match score weights: distance 35% · size 25% · config 20% · recency 20%. Top-matched comps best support the ARV.
Projected returns pro-forma
-3.0% appreciation · 0.0% rent growth · sell at horizon
- IRR
- -9.5%
- Equity multiple
- 0.66×
- Total profit
- $-17,458
- Equity at exit
- $27,420
- IRR
- -4.4%
- Equity multiple
- 0.74×
- Total profit
- $-13,170
- Equity at exit
- $15,900
Cash invested: $51,492 (down + closing). Projections, not guarantees.
Landlord ↔ Tenant lean methodology
- Overall (STATE)
- 87 Strongly Landlord-Friendly
- State Florida
- 87 Strongly Landlord-Friendly · R+3
- County
- — inherits STATE
- City
- — inherits STATE
ZIP-level market 33755
- Rents YoY
- -2.2%
- Active inventory
- 265
- Price-to-rent
- 8.4×
Monthly cashflow live
- Estimated rent
- $1,820 high interval (Pro) →
- Mortgage (P&I)
- −$964
- Tax from tax record
- −$119 /mo · $1,427/yr
- Insurance
- −$77
- HOA
- −$0
- Vacancy / Maint / Mgmt
- −$382
- Net cashflow
- $278
Break-even live
Sensitivity live
| Price | -10% $382 | -5% $330 | +0% $278 | +5% $226 | +10% $174 |
|---|---|---|---|---|---|
| Rent | -10% $134 | -5% $206 | +0% $278 | +5% $350 | +10% $422 |
| Rate | -1.0pp $371 | -0.5pp $325 | base $278 | +0.5pp $231 | +1.0pp $182 |
UW: 25.0% down · 7.5% · 30yr · 1.5% tax · 5.0% vac · 8.0% maint · 8.0% mgmt
Financing live
Cash to close
- Down payment
- $45,975
- Closing costs
- $5,517
- Reserves months
- —
- Total cash needed
- —
Loan-product check · same deal, 3 products live
Conventional
25% down · 7.5% · 30yr
- Down + closing
- —
- Monthly P&I
- —
- Monthly cashflow
- —
- DSCR
- —
- Eligible?
- —
Personal DTI + credit; lowest rate.
DSCR
20% down · 8.5% · 30yr
- Down + closing
- —
- Monthly P&I
- —
- Monthly cashflow
- —
- DSCR
- —
- Eligible?
- —
No personal income docs; deal must DSCR.
Hard money
10% down · 12.0% · 12mo
- Down + closing
- —
- Monthly P&I
- —
- Monthly cashflow
- —
- DSCR
- —
- Eligible?
- —
Short-term bridge; refi at stabilization.
Rent comps 40 comps
| Address | Beds | Baths | Sqft | Rent | $/sqft | DOM | Units | Dist |
|---|---|---|---|---|---|---|---|---|
| 1109 Grant St Clearwater, FL | 2.0 | 1.0 | 550 | $1,295 | $2.35 | 5d | 1 | 0.01mi |
| 1109 1/2 Grant St Clearwater, FL | 2.0 | 1.0 | 550 | $1,295 | $2.35 | 21d | 1 | 0.01mi |
| 912 Engman St Clearwater, FL | 2.0 | 1.0 | 625 | $1,600 | $2.56 | 25d | 1 | 0.18mi |
| 1003 West Ave Clearwater, FL | 2.0 | 1.0 | 800 | $1,195 | $1.49 | 4d | 4 | 0.32mi |
| 1015 Vine Ave Clearwater, FL | 2.0 | 1.0 | 800 | $1,350 | $1.69 | 9d | 1 | 0.35mi |
| 1609 N Fort Harrison Ave Clearwater, FL | 2.0 | 2.0 | 1000 | $2,600 | $2.60 | 5d | 1 | 0.36mi |
| 1006 Vine Ave Unit 1015 Clearwater, FL | 2.0 | 1.0 | 800 | $1,350 | $1.69 | 9d | 1 | 0.37mi |
| 506 Engman St Clearwater, FL | 2.0 | 2.0 | 1060 | $2,500 | $2.36 | 25d | 1 | 0.38mi |
| 1731 Overbrook Ave Clearwater, FL | 2.0 | 1.0 | 702 | $1,245 | $1.77 | 25d | 1 | 0.44mi |
| 412 Pleasant St Clearwater, FL | 2.0 | 1.0 | 800 | $1,700 | $2.12 | 5d | 1 | 0.46mi |
| 409 Lebeau St Clearwater, FL | 3.0 | 1.0 | 1026 | $1,850 | $1.80 | 9d | 1 | 0.53mi |
| 1009 Pine Brook Dr Unit B Clearwater, FL | 2.0 | 2.0 | 1000 | $2,200 | $2.20 | 23d | 1 | 0.60mi |
| 912 Hart St Unit B Clearwater, FL | 3.0 | 1.0 | 840 | $1,545 | $1.84 | 23d | 1 | 0.70mi |
| 1142 Sunset Point Rd Clearwater, FL | 2.0 | 1.0 | 650 | $1,518 | $2.33 | 4d | 6 | 0.74mi |
| 1922 Springtime Ave Clearwater, FL | 2.0 | 1.0 | 800 | $1,575 | $1.97 | 25d | 1 | 0.77mi |
| 905 Jones St Clearwater, FL | 2.0 | 1.0 | 660 | $1,700 | $2.58 | 12d | 1 | 0.79mi |
| 905 Jones St Clearwater, FL | 3.0 | 2.0 | 1072 | $2,450 | $2.29 | 25d | 1 | 0.79mi |
| 500 N Osceola Ave #502 Clearwater, FL | 2.0 | 2.0 | 1060 | $2,450 | $2.31 | 9d | 1 | 0.86mi |
| 500 N Osceola Ave Clearwater, FL | 2.0 | 2.0 | 1075 | $2,275 | $2.12 | 19d | 2 | 0.88mi |
| 1221 Drew St Unit A21 Clearwater, FL | 2.0 | 1.0 | 705 | $1,300 | $1.84 | 4d | 1 | 0.90mi |
| 1257 Drew St #1 Clearwater, FL | 2.0 | 1.0 | 1055 | $1,750 | $1.66 | 25d | 1 | 0.92mi |
| 1280 Bertland Way Clearwater, FL | 3.0 | 1.0 | 922 | $1,900 | $2.06 | 5d | 1 | 0.95mi |
| 1100 Cleveland St Clearwater, FL | 1.0–2.0 | 1.0–2.5 | 1168 | $2,795 | $2.39 | 4d | 15 | 0.98mi |
| 1329 Drew St #6 Clearwater, FL | 2.0 | 1.0 | 850 | $1,495 | $1.76 | 5d | 1 | 1.01mi |
| 949 Cleveland St Clearwater, FL | 1.0–2.0 | 1.0–2.0 | 820 | $2,595 | $3.16 | 4d | 50 | 1.02mi |
| 1345 Drew St #16 Clearwater, FL | 2.0 | 1.0 | 925 | $1,500 | $1.62 | 25d | 1 | 1.03mi |
| 1262 Woodlawn Ter Clearwater, FL | 2.0 | 1.0 | 1076 | $2,000 | $1.86 | 25d | 1 | 1.05mi |
| 1365 Drew St #102 Clearwater, FL | 2.0 | 1.0 | 850 | $1,400 | $1.65 | 25d | 1 | 1.06mi |
| 1799 N Highland Ave #5 Clearwater, FL | 2.0 | 1.5 | 813 | $1,690 | $2.08 | 18d | 1 | 1.11mi |
| 1799 N Highland Ave #114 Clearwater, FL | 2.0 | 1.5 | 813 | $1,575 | $1.94 | 14d | 1 | 1.11mi |
| 100 Waverly Way #403 Clearwater, FL | 2.0 | 2.0 | 900 | $1,600 | $1.78 | 19d | 1 | 1.16mi |
| 106 S Fredrica Ave Clearwater, FL | 2.0 | 1.0 | 836 | $1,350 | $1.61 | 23d | 1 | 1.18mi |
| 27 N San Remo Ave Unit A Clearwater, FL | 2.0 | 1.0 | 625 | $1,297 | $2.08 | 4d | 1 | 1.24mi |
| 2035 Kings Hwy Clearwater, FL | 1.0–2.0 | 1.0–2.0 | 904 | $1,520 | $1.68 | 25d | 1 | 1.26mi |
| 2035 Alpine Rd Apt 3 Clearwater, FL | 2.0 | 1.0 | 825 | $1,400 | $1.70 | 9d | 1 | 1.30mi |
| 2035 Alpine Rd Apt 3 Clearwater, FL | 2.0 | 1.0 | 825 | $1,500 | $1.82 | 25d | 1 | 1.30mi |
| 2035 Alpine Rd Clearwater, FL | 2.0 | 1.0 | 825 | $1,400 | $1.70 | 4d | 1 | 1.30mi |
| 2035 Alpine Rd Clearwater, FL | 2.0 | 1.0 | 825 | $1,500 | $1.82 | 5d | 1 | 1.30mi |
| 2045 Alpine Rd Clearwater, FL | 2.0 | 1.0 | 983 | $1,675 | $1.70 | 5d | 1 | 1.32mi |
| 2045 Alpine Rd Apt 3 Clearwater, FL | 2.0 | 1.0 | 825 | $1,400 | $1.70 | 25d | 1 | 1.32mi |
Listing history 26 events
-
2026-06-22days on market $183,900 Active 71 DOM
-
2026-06-18days on market $183,900 Active 68 DOM
-
2026-06-17pricedays on market $183,900 Active 67 DOM
-
2026-06-16days on market $184,900 Active 66 DOM
-
2026-06-15days on market $184,900 Active 65 DOM
-
2026-06-13days on market $184,900 Active 63 DOM
-
2026-06-09days on market $184,900 Active 59 DOM
-
2026-06-08pricedays on market $184,900 Active 58 DOM
-
2026-06-07days on market $185,900 Active 57 DOM
-
2026-06-04days on market $185,900 Active 54 DOM
-
2026-06-03days on market $185,900 Active 53 DOM
-
2026-06-01pricedays on market $185,900 Active 51 DOM
-
2026-05-31days on market $186,900 Active 50 DOM
-
2026-05-18price $187,900
-
2026-05-07price $188,900
-
2026-04-11$189,900 Active
-
2025-06-03historical
-
2025-05-13price $219,000
-
2025-05-12price $228,000
-
2025-04-20price $229,900
-
2025-04-19price $220,000
-
2025-04-19status Active
-
2025-01-23soldstatus $120,000
-
2025-01-23price $169,000
-
2025-01-18$169,900 Active
-
1998-12-24soldstatus $10,500
ⓘ Source: listings_history table (triggers on properties + properties_extension) + one-shot
backfill from property_details.listing_events for pre-trigger history.
Tax reassessment forecast FL · Resets to sale price
- Current annual tax
- $1,427 · $119/mo
- Projected year-2 tax
- $1,526 · $127/mo
- Expected delta
- +$99/yr (+$8/mo · 7.0%)
ⓘ Screening estimate from a state-policy table — verify with the county assessor before closing.
Climate risk First Street
- Flood 1/10 Low FEMA zone X (unshaded) · 0% chance over 30 yrs
- Wildfire 1/10 Low
- Heat 10/10 Extreme 7 d/yr ≥107°F today · 27 d/yr by 30 yrs out
- Wind 10/10 Extreme 99% chance of damaging wind over 30 yrs
- Air quality 3/10 Moderate 2 unhealthy d/yr today · 3 by 30 yrs out
Nearby sold comps map
Loading sold comps map…
Walkable amenities ~0.75 mi
Loading nearby amenities…
Taxation est. · year 1
- Rental income
- $21,845
- − Mortgage interest
- −$10,301
- − Property taxes
- −$1,427
- − Insurance
- −$920
- − Repairs & maintenance
- −$1,748
- − Management
- −$1,748
- − Depreciation
- −$5,350
- Taxable income
- $352
- Est. tax owed @ 24.0%
- −$84
- After-tax cash flow
- $3,254/yr
For passive investors: Depreciation is non-cash, so a rental often shows a tax loss while cash-flowing — sheltering income. Rental losses are passive: they offset passive income freely, and up to $25,000/yr can offset ordinary (W-2) income if you actively participate and your MAGI is under $100k (phasing out to $0 by $150k); unused losses carry forward. On sale, claimed depreciation is recaptured at up to 25%, and gains may owe capital-gains tax (a 1031 exchange can defer both). Figures are a year-1 estimate at your 24.0% rate — not tax advice; consult a CPA.
Schools (NCES district)
- District
- Pinellas
- NCES district ID
- 1201560
- Math proficiency
- 51% ▼ -5.00%
- Reading proficiency
- 51% ▼ -3.00%
- Median HH income
- $46,270
- Composite
- 43.27/100
- National rank
- #3046
- State rank
- #31 of 73 in FL
Livability — Clearwater
- Score
- 82/100
- State rank
- #60
- US rank
- #988
Category grades
Schools grade is shown separately in the Schools card above.
Census & demographics
- Census place
- Clearwater, FL
- County
- Pinellas County · 939,478 people
- City population
- 170,933
- Metro
- Tampa-St. Petersburg-Clearwater, FL
- Population (ZIP)
- 27,476
- Household income
- $62,886
- Rent vs Own
- Severe rent burden
- 1511.0
Population outlook (Pinellas County) Hauer SSP2
- Today (2025)
- 1,027,532 people
- By 2030
- 1,063,586 · +3.5%
- By 2040
- 1,125,020 · +9.5%
- By 2050
- 1,168,637 · +13.7%
- By 2075
- 1,265,188 · +23.1%
- By 2100
- 1,260,357 · +22.7%
Race, ethnicity, and origin ACS 2023
- Neighborhood character
- Diverse neighborhood (Simpson 0.63)
- Race & ethnicity
- White 54% Black 22% Hispanic / Latino 17% Two or more races 10% Asian 3%
- Hispanic origin (detail)
- Mexican 6% Puerto Rican 5% Cuban 1%
- Common ancestry
- Romanian 2% Italian 2% Arab 1%
- Foreign-born
- 15% · Canada
- Languages at home
- 78% English-only · Spanish 13% Other Indo-European 3% Russian/Polish/Slavic 2%
Political lean MEDSL · Pinellas
- 2024 margin
- Lean R (+5.2) · D 46.9% · R 52.1%
- 2008→2024 swing
- -13.5pp toward R · 2008: 8.3pp · 2024: -5.2pp
- All cycles
- 2024: R+5.2 2020: D+0.2 2016: R+1.1 2012: D+5.6 2008: D+8.3
Not yet ingested
- Civics
- —
Market trends
- HPI YoY
- ▼ -472.62%
- Current HPI
- 351.4973
- Rent YoY
- ▼ -2.20%
- Metro
- Tampa-St. Petersburg-Clearwater, FL
- State GDP YoY
- ▲ 3.28%
- F500 in state
- 36
Industry mix (Fortune 500 HQ in FL)
| Industry | F500 HQs | Revenue |
|---|---|---|
| Industrial Technology | 2 | $29B |
|
||
| Insurance | 2 | $17B |
|
||
| Retail | 1 | $60B |
|
||
| Technology Distribution | 1 | $58B |
|
||
| Homebuilding | 1 | $35B |
|
||
| Technology Manufacturing | 1 | $35B |
|
||
Price history
+1689.5% since first listed13 events — show timeline
- 2026-05-18 Price Changed $187,900 Stellar MLS as Distributed by MLS Grid
- 2026-05-07 Price Changed $188,900 Stellar MLS as Distributed by MLS Grid
- 2026-04-11 Listed $189,900 Stellar MLS as Distributed by MLS Grid
- 2025-06-03 Listing Removed — Stellar MLS as Distributed by MLS Grid
- 2025-05-13 Price Changed $219,000 Stellar MLS as Distributed by MLS Grid
- 2025-05-12 Price Changed $228,000 Stellar MLS as Distributed by MLS Grid
- 2025-04-20 Price Changed $229,900 Stellar MLS as Distributed by MLS Grid
- 2025-04-19 Price Changed $220,000 Stellar MLS as Distributed by MLS Grid
- 2025-04-19 Relisted — Stellar MLS as Distributed by MLS Grid
- 2025-01-23 Sold (Public Records) $120,000 Public Records
- 2025-01-23 Price Changed $169,000 Stellar MLS as Distributed by MLS Grid
- 2025-01-18 Listed $169,900 Stellar MLS as Distributed by MLS Grid
- 1998-12-24 Sold (Public Records) $10,500 Public Records
Property tax history
+7.2%/yrLatest (2025): $1,427 · +25.9% YoY. Source: county tax records.
Cash-flow waterfall
monthlySold comps — $/sqft
last 12 mo · ≤1 miLoading sold comps…