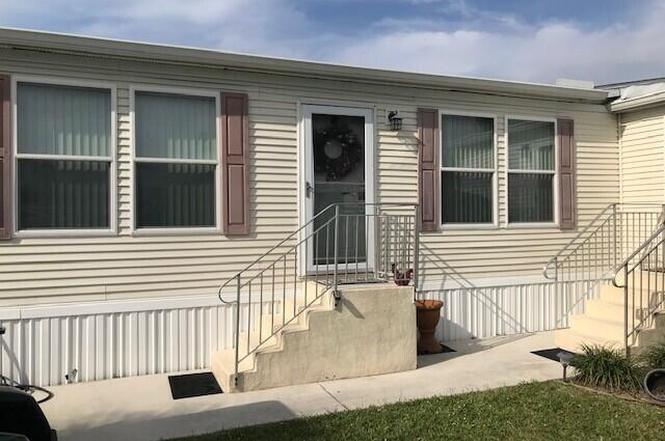
20 Madrid Ln · Port St. Lucie, FL
Flood risk 1/10 · Minimal
- FEMA flood zone
- X (unshaded)
- Chance of flooding over 30 yrs
- 0.0%
- Est. flood insurance / yr
- $507 – $1,088
Fire risk 4/10 · Minor
- Est. fire insurance / yr
- $947 – $1,759
Heat risk 10/10 · Severe
- Hot days now (above 106°F)
- 6 days/yr
- Hot days in 30 yrs
- 20 days/yr
Wind risk 10/10 · Severe
- Chance of severe wind over 30 yrs
- 99.0%
Air-quality risk 2/10 · Minimal
- Unhealthy air days now
- 1 days/yr
- Unhealthy air days in 30 yrs
- 1 days/yr
Risk factors via First Street. Map © Google.
Why this score? — see what drove the B+ grade
The composite is a weighted blend of 9 inputs, each scored 0–100. Each bar is that input's sub-score; the figure is the points it added to the 100-point composite (weight × sub-score).
- Cash flow +30.0/30.0
- ARV discount +15.0/15.0
- 1% rule +10.0/10.0
- DSCR +10.0/10.0
- Schools +3.7/10.0
- Rent growth +3.0/5.0
- Livability +2.5/5.0
- Condition / age +2.5/5.0
- Appreciation +0.0/10.0
$118,900
🖨 Deal sheet (PDF) 📄 Offer letter ✓ Due diligence
Listing remarks
Beautiful well maintained 3 bedroom 2 bath manufactured home in Spanish Lakes Community with lake views. Custom Palm Harbor Model built in 2005 located at the end of a cul-de-sac. Home is 1,853 sqft of living with a den that could be a fourth bedroom with a separate entrance. Home features include drywall finish with extra insulation between walls and floor. Wood laminate floors in the family room, dining room and den. Title in kitchen and bathrooms. Island in kitchen with corian sink. Master suite has separate shower and jacuzzi tub. Family room has a wood burning fireplace. All stainless steel appliances and upgraded Cherry cabinets. Laundry room inside with large pantry. Brand new water
Key facts
- 2 parking spots
- Community pool
- Built 2005
Property features AI
Finance
- Other: Senior community; Pets allowed (breed restrictions and possible pet restrictions)
- Financial info: Association fees include grounds maintenance and trash
- HOA & community: Association with on-site manager; Community amenities include clubhouse, pool, fitness center, golf course, basketball and shuffleboard courts, billiard and game rooms, business center, courtesy bus
Exterior
- Parking: Attached carport; 2 carport spaces (covered)
- Utilities: Public water; Public sewer; Cable available; Water available; Sewer available
- Home design: Manufactured home (Palm Harbor model); Single-story; Faces southwest
- Construction: Modular construction; Composition/shingle roof; Mobile dimensions approximately 62' x 28'
- Exterior features: Corner lot; Waterfront
Interior
- Kitchen: Dishwasher; Electric range; Microwave; Refrigerator
- Bedrooms: 1 bedroom on main level
- Flooring: Carpet; Laminate
- Bathrooms: 2 full bathrooms
- Heating & cooling: Central heating (electric); Central air conditioning (electric)
- Interior features: Kitchen island; Walk-in closet(s); Split bedroom layout; French doors; Partially furnished; Fireplace; Skylight(s); Blinds; Double-hung metal windows
- Laundry & utility: Laundry closet inside; Electric water heater
Neighborhood map
What this means for you Summary
Snapshot
- This is a 3-bed/2.0-bath manufactured listed at $119k.
Deal economics
- At list price, monthly cash flow is $973 ($12k/yr) — positive.
- The deal already cash-flows at list — no discount required.
- Meets the 1% rule at list price ($2k rent vs $119k).
- Recommended offer: $105k (12.0% below list) — sets the bar for market timing.
- Cap rate 16.1% vs local median 3.9% in Port St. Lucie — top-decile yield for the area; either an underpriced asset or a hidden risk that comps aren't pricing in. Stress-test before assuming the spread holds.
Location & tenants
- Location reads: area grade B — affects rentability + tenant quality, not the cash-flow math above.
- St. Lucie (urban): math 40% / reading 48% proficiency, ranked #51 of 73 in FL (top 70%) — families likely to look elsewhere, expect single-tenant / working-renter base with shorter leases.
- Zoned schools: Savanna Ridge Elementary School (math 40% / reading 45%, grade F, #1,383 of 2,144 statewide, top 65%, 452 students, 75% FRL); Southern Oaks Middle School (math 39% / reading 43%, grade F, #353 of 571 statewide, top 63%, 894 students, 76% FRL); Port St. Lucie High School (math 21% / reading 43%, grade F, #415 of 667 statewide, top 63%, 1,748 students, 67% FRL).
- Market conditions: Rents rising (+1.9%/yr); 645 active listings in the ZIP; 2 comparable units currently listed for rent nearby; 4,868 units permitted in St. Lucie County in 2024 (268 in 5+ unit buildings).
- This rent runs 44% of the median local income ($62k/yr) — at the standard rent-burdened threshold; future hikes will face affordability resistance.
Forward outlook
- Local home prices are declining (-3.0%/yr); year-one equity from $822 of loan paydown is wiped out by about $4k of value loss. Plan a longer hold.
- St. Lucie County population projected at +20% by 2050 — long-run rental-demand tailwind backs the buy-and-hold thesis.
- At projected returns (-3.0% appreciation + 1.9% rent growth), your $33k cash investment doubles in ~4 years — after that, you're playing with house money.
Negotiation context
- It's been on market 818 days — a 12% lower offer ($105k) is reasonable based on typical stale-listing flexibility.
- 3 sale attempts since 2y ago; this cycle's ask has dropped $30k (20%) from the opening price — seller is motivated, your offer sets the floor, not the list.
Risks & watch-outs
- Climate carrying-cost: severe wind risk, 99% chance of damaging wind over 30y; extreme-heat days projected 6→20/yr by 2055 (HVAC capex compounding) — expect insurance premiums to compound above CPI over the hold.
Questions for the listing agent
- It's been on market 818 days. Have you received any prior offers? Is the seller open to a 12% concession, seller financing, or rate buy-down credit?
- Why hasn't it sold? Are there any deal-killer items the seller is aware of (foundation, flood, title, zoning, code violations)?
- Is there a deadline driving the sale (1031 exchange, divorce, estate, relocation)? That informs how much negotiation room exists.
- What's the average days-on-market for RENTAL listings here right now (not sales)? A rising rental-DOM trend means longer vacancies and softer asking-rent achievability than the comps imply.
- What's the recent tenant-quality profile in this submarket — average credit score on applications, eviction rate, late-payment / NSF rate, and stable-employment percentage? A property-management company in the area should have these aggregated.
- How much new for-sale + rental construction is in the pipeline within 1–3 miles? Heavy new supply typically softens prices + rents 12–24 months out; constrained supply supports both.
Investment metrics
- 1% rule
- 1.91% ✓
- Cap rate
- 16.11%
- Cash-on-cash
- 35.06%
- DSCR
- 2.56
- GRM
- 4.4
CMA / ARV
- ARV (on-the-fly)
- $207,536
- Comps found
- 8
Show comp detail 8 sales within ~0.75 mi
| Address | Dist | Beds/Ba | Sqft | Sold | Price | $/sf | Match |
|---|---|---|---|---|---|---|---|
| 2968 Eagles Nest Way | 0.42mi | 3/2.0 | 1,786 (-4%) | 8mo | $199,999 | $112 | 67 |
| 7808 Horned Lark Cir | 0.42mi | 2/2.0 (-1) | 1,904 (+3%) | 7mo | $244,900 | $129 | 65 |
| 2948 Eagles Nest Way | 0.42mi | 3/2.0 | 1,786 (-4%) | 15mo | $125,000 | $70 | 62 |
| 7917 Horned Lark Cir | 0.43mi | 3/2.0 | 1,915 (+3%) | 22mo | $250,000 | $131 | 56 |
| 2847 Eagles Nest Way | 0.51mi | 3/2.0 | 1,808 (-2%) | 24mo | $279,000 | $154 | 53 |
| 7822 White Ibis Ln | 0.52mi | 3/2.0 | 1,612 (-13%) | 2mo | $115,000 | $71 | 52 |
| 8112 Long Dr | 0.60mi | 3/2.0 | 1,786 (-4%) | 19mo | $122,000 | $68 | 50 |
| 2852 Eagles Nest Way | 0.54mi | 2/2.0 (-1) | 1,724 (-7%) | 22mo | $165,000 | $96 | 40 |
Match score weights: distance 35% · size 25% · config 20% · recency 20%. Top-matched comps best support the ARV.
Projected returns pro-forma
-3.0% appreciation · 1.92% rent growth · sell at horizon
- IRR
- 29.4%
- Equity multiple
- 2.21×
- Total profit
- $40,273
- Equity at exit
- $17,728
- IRR
- 36.1%
- Equity multiple
- 4.16×
- Total profit
- $105,171
- Equity at exit
- $10,280
Cash invested: $33,292 (down + closing). Projections, not guarantees.
Landlord ↔ Tenant lean methodology
- Overall (STATE)
- 87 Strongly Landlord-Friendly
- State Florida
- 87 Strongly Landlord-Friendly · R+3
- County
- — inherits STATE
- City
- — inherits STATE
ZIP-level market 34952
- Home prices YoY
- -29.6%
- Rents YoY
- 1.9%
- Active inventory
- 645
- Price-to-rent
- 4.4×
Monthly cashflow live
- Estimated rent
- $2,271 medium interval (Pro) →
- Mortgage (P&I)
- −$624
- Tax est. 1.5%
- −$149 /mo · $1,784/yr
- Insurance
- −$50
- HOA
- −$0
- Vacancy / Maint / Mgmt
- −$477
- Net cashflow
- $973
Break-even live
Sensitivity live
| Price | -10% $1,055 | -5% $1,014 | +0% $973 | +5% $932 | +10% $890 |
|---|---|---|---|---|---|
| Rent | -10% $793 | -5% $883 | +0% $973 | +5% $1,062 | +10% $1,152 |
| Rate | -1.0pp $1,033 | -0.5pp $1,003 | base $973 | +0.5pp $942 | +1.0pp $910 |
UW: 25.0% down · 7.5% · 30yr · 1.5% tax · 5.0% vac · 8.0% maint · 8.0% mgmt
Financing live
Cash to close
- Down payment
- $29,725
- Closing costs
- $3,567
- Reserves months
- —
- Total cash needed
- —
Loan-product check · same deal, 3 products live
Conventional
25% down · 7.5% · 30yr
- Down + closing
- —
- Monthly P&I
- —
- Monthly cashflow
- —
- DSCR
- —
- Eligible?
- —
Personal DTI + credit; lowest rate.
DSCR
20% down · 8.5% · 30yr
- Down + closing
- —
- Monthly P&I
- —
- Monthly cashflow
- —
- DSCR
- —
- Eligible?
- —
No personal income docs; deal must DSCR.
Hard money
10% down · 12.0% · 12mo
- Down + closing
- —
- Monthly P&I
- —
- Monthly cashflow
- —
- DSCR
- —
- Eligible?
- —
Short-term bridge; refi at stabilization.
Rent comps 2 comps
| Address | Beds | Baths | Sqft | Rent | $/sqft | DOM | Units | Dist |
|---|---|---|---|---|---|---|---|---|
| 7700 Pine Lakes Blvd Port Saint Lucie, FL | 1.0–3.0 | 1.0–2.0 | 1022 | $2,212 | $2.16 | 15d | 16 | 1.18mi |
| 71 W Caribbean Port St. Lucie, FL | 2.0 | 2.0 | 1417 | $1,700 | $1.20 | 25d | 1 | 1.30mi |
Listing history 26 events
-
2026-06-21days on market $118,900 Active 818 DOM
-
2026-06-18days on market $118,900 Active 815 DOM
-
2026-06-17days on market $118,900 Active 814 DOM
-
2026-06-16days on market $118,900 Active 813 DOM
-
2026-06-15days on market $118,900 Active 812 DOM
-
2026-06-14days on market $118,900 Active 810 DOM
-
2026-06-13days on market $118,900 Active 809 DOM
-
2026-06-10days on market $118,900 Active 807 DOM
-
2026-06-09days on market $118,900 Active 806 DOM
-
2026-06-08days on market $118,900 Active 805 DOM
-
2026-06-07days on market $118,900 Active 804 DOM
-
2026-06-05days on market $118,900 Active 801 DOM
-
2026-06-03days on market $118,900 Active 800 DOM
-
2026-06-02days on market $118,900 Active 799 DOM
-
2026-06-01days on market $118,900 Active 798 DOM
-
2026-05-31days on market $118,900 Active 797 DOM
-
2026-05-30days on market $118,900 Active 796 DOM
-
2026-02-20price $118,900
-
2025-11-18status Active
-
2025-11-18historical
-
2025-06-30price $128,900
-
2024-11-27status Active
-
2024-11-18historical
-
2024-07-10price $134,000
-
2024-05-28price $139,000
-
2024-03-17$149,000 Active
ⓘ Source: listings_history table (triggers on properties + properties_extension) + one-shot
backfill from property_details.listing_events for pre-trigger history.
Climate risk First Street
- Flood 1/10 Low FEMA zone X (unshaded) · 0% chance over 30 yrs
- Wildfire 4/10 Moderate
- Heat 10/10 Extreme 6 d/yr ≥106°F today · 20 d/yr by 30 yrs out
- Wind 10/10 Extreme 99% chance of damaging wind over 30 yrs
- Air quality 2/10 Low 1 unhealthy d/yr today · 1 by 30 yrs out
Nearby sold comps map
Loading sold comps map…
Walkable amenities ~0.75 mi
Loading nearby amenities…
Taxation est. · year 1
- Rental income
- $27,256
- − Mortgage interest
- −$6,660
- − Property taxes
- −$1,784
- − Insurance
- −$594
- − Repairs & maintenance
- −$2,180
- − Management
- −$2,180
- − Depreciation
- −$3,459
- Taxable income
- $10,398
- Est. tax owed @ 24.0%
- −$2,495
- After-tax cash flow
- $9,176/yr
For passive investors: Depreciation is non-cash, so a rental often shows a tax loss while cash-flowing — sheltering income. Rental losses are passive: they offset passive income freely, and up to $25,000/yr can offset ordinary (W-2) income if you actively participate and your MAGI is under $100k (phasing out to $0 by $150k); unused losses carry forward. On sale, claimed depreciation is recaptured at up to 25%, and gains may owe capital-gains tax (a 1031 exchange can defer both). Figures are a year-1 estimate at your 24.0% rate — not tax advice; consult a CPA.
Schools (NCES district)
- District
- St. Lucie
- NCES district ID
- 1201770
- Math proficiency
- 40% ▼ -11.00%
- Reading proficiency
- 48% ▼ -4.00%
- Median HH income
- $44,737
- Composite
- 37.28/100
- National rank
- #4449
- State rank
- #51 of 73 in FL
Livability — Port St. Lucie
No livability data for this city. (Only ~50 U.S. cities are tracked.)
Census & demographics
- County
- Saint Lucie County · 337,150 people
- City population
- 221,051
- Metro
- Port St. Lucie, FL
- Population (ZIP)
- 42,655
- Household income
- $61,628
- Rent vs Own
- Severe rent burden
- 1759.0
Population outlook (St. Lucie County) Hauer SSP2
- Today (2025)
- 338,016 people
- By 2030
- 355,687 · +5.2%
- By 2040
- 385,521 · +14.1%
- By 2050
- 406,106 · +20.1%
- By 2075
- 441,054 · +30.5%
- By 2100
- 436,885 · +29.2%
Race, ethnicity, and origin ACS 2023
- Neighborhood character
- Diverse neighborhood (Simpson 0.57)
- Race & ethnicity
- White 62% Hispanic / Latino 19% Two or more races 14% Black 10% Asian 3%
- Hispanic origin (detail)
- Mexican 4% Puerto Rican 4% Cuban 2% Dominican 2%
- Common ancestry
- Romanian 3% Lithuanian 2% Hispanic 1%
- Foreign-born
- 18% · Canada, Jamaica, China
- Languages at home
- 76% English-only · Spanish 16% French/Haitian/Cajun 3% Tagalog/Filipino 2%
Political lean MEDSL · St. Lucie
- 2024 margin
- Lean R (+9.1) · D 45.1% · R 54.2%
- 2008→2024 swing
- -21.2pp toward R · 2008: 12.1pp · 2024: -9.1pp
- All cycles
- 2024: R+9.1 2020: R+1.6 2016: R+2.5 2012: D+7.9 2008: D+12.1
Not yet ingested
- Civics
- —
Market trends
- HPI YoY
- ▼ -155.80%
- Current HPI
- 371.0573
- Rent YoY
- ▲ 1.92%
- Metro
- Port St. Lucie, FL
- State GDP YoY
- ▲ 3.28%
- F500 in state
- 36
Industry mix (Fortune 500 HQ in FL)
| Industry | F500 HQs | Revenue |
|---|---|---|
| Industrial Technology | 2 | $29B |
|
||
| Insurance | 2 | $17B |
|
||
| Retail | 1 | $60B |
|
||
| Technology Distribution | 1 | $58B |
|
||
| Homebuilding | 1 | $35B |
|
||
| Technology Manufacturing | 1 | $35B |
|
||
Price history
-20.2% since first listed9 events — show timeline
- 2026-02-20 Price Changed $118,900 Beaches MLS
- 2025-11-18 Relisted — Beaches MLS
- 2025-11-18 Listing Removed — Beaches MLS
- 2025-06-30 Price Changed $128,900 Beaches MLS
- 2024-11-27 Relisted — Beaches MLS
- 2024-11-18 Listing Removed — Beaches MLS
- 2024-07-10 Price Changed $134,000 Beaches MLS
- 2024-05-28 Price Changed $139,000 Beaches MLS
- 2024-03-17 Listed $149,000 Beaches MLS
Cash-flow waterfall
monthlySold comps — $/sqft
last 12 mo · ≤1 miLoading sold comps…