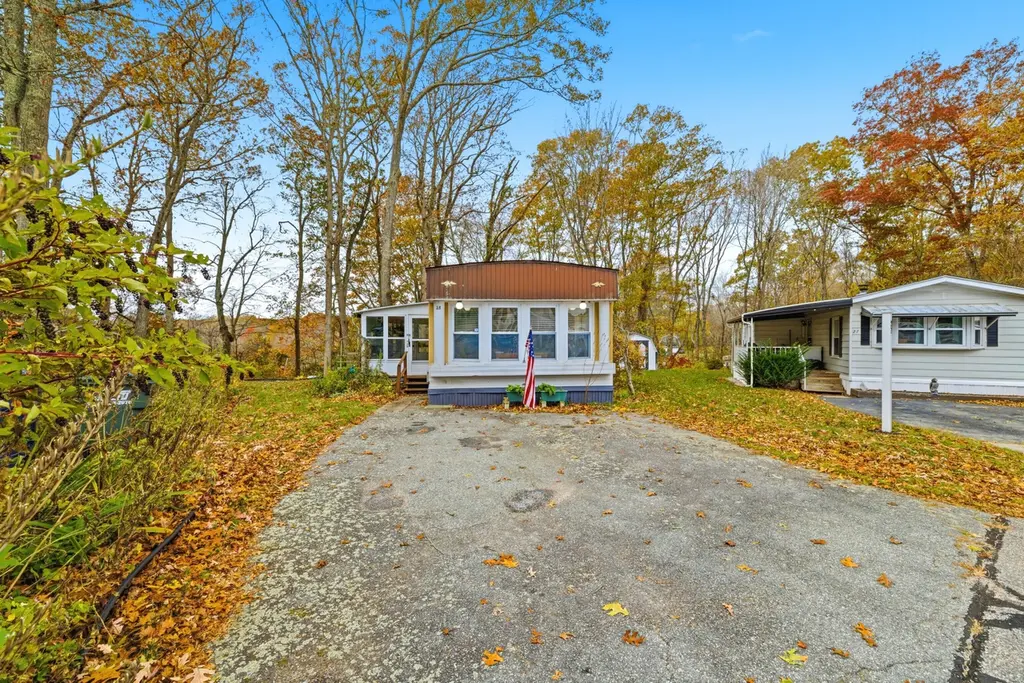
28 Golden Spur · Stonington, CT
Flood risk No data
- FEMA flood zone
- —
- Chance of flooding over 30 yrs
- —
- Est. flood insurance / yr
- —
Fire risk No data
- Est. fire insurance / yr
- —
Heat risk No data
- Hot days now (above threshold)
- —
- Hot days in 30 yrs
- —
Wind risk No data
- Chance of severe wind over 30 yrs
- —
Air-quality risk No data
- Unhealthy air days now
- —
- Unhealthy air days in 30 yrs
- —
Risk factors via First Street. Map © Google.
Why this score? — see what drove the B grade
The composite is a weighted blend of 9 inputs, each scored 0–100. Each bar is that input's sub-score; the figure is the points it added to the 100-point composite (weight × sub-score).
- Cash flow +30.0/30.0
- 1% rule +10.0/10.0
- DSCR +10.0/10.0
- ARV discount +7.5/15.0
- Schools +5.5/10.0
- Livability +3.3/5.0
- Rent growth +2.5/5.0
- Condition / age +2.5/5.0
- Appreciation +0.0/10.0
$99,500
🖨 Deal sheet 📄 Offer letter ✓ Due diligence
Listing remarks MLS
Welcome home! Possibly the best lot in desirable Arlington Acres. A well maintained home with 2 bedrooms and 1 bath that sits on the end of a cul-de-sac. Upgrades include newer flooring, paint, gas stove and water heater. Extra storage space with large shed. Enjoy the peaceful yard and enclosed porch with the warmer weather to come.
Key facts
- Spacious kitchen
- Natural light
- Enclosed porch
Tags
Property features AI
Finance
- Financial info: Property managed professionally off-site
- HOA & community: Homeowners association with monthly fee; HOA fee includes grounds and road maintenance
Exterior
- Parking: Driveway; 2 total parking spaces; Private paved driveway
- Utilities: Public water connected; Septic (shared septic); Above-ground fuel tank
- Home design: Single family home for sale; On leased land; Located on a cul-de-sac; Level and sloping lot
- Construction: Prefab construction; Flat roof; Metal siding; No basement / no foundation listed
- Exterior features: Screened porch; Enclosed porch; Covered deck; Shed; Porch
Interior
- Kitchen: Gas range; Oven/Range; Microwave; Refrigerator
- Bedrooms: 2 bedrooms
- Bathrooms: 1 full bathroom
- Heating & cooling: Hot air heating (propane fuel); Window unit cooling; Electric hot water
- Interior features: Cable available and pre-wired; Security system
- Laundry & utility: Washer; Dryer; Laundry on main level
Neighborhood map
What this means for you Summary
Snapshot
- This is a 2-bed/1.0-bath manufactured listed at $100k.
Deal economics
- At list price, monthly cash flow is $1k ($12k/yr) — positive.
- The deal already cash-flows at list — no discount required.
- Meets the 1% rule at list price ($3k rent vs $100k).
- Recommended offer: $97k (3.0% below list) — sets the bar for market timing.
Location & tenants
- Location reads 66/100 on livability (#118 in CT) — a middle-class / working-renter tenant base. Strengths: crime A+, employment A+; Watch: amenities F, commute F, cost of living F.
- Stonington School District (suburban): math 54% / reading 70% proficiency, ranked #43 of 153 in CT (top 28%) — acceptable for families but not a draw, mixed tenant base, ~2y average lease; only 14% free/reduced lunch — higher-income household profile.
- Zoned schools: Deans Mill School (math 72% / reading 74%, grade A, #58 of 553 statewide, top 11%, 451 students, 12% FRL); Stonington High School (math 47% / reading 77%, grade B-, #40 of 194 statewide, top 21%, 585 students, 21% FRL) — zoned schools at 16% FRL track the district average.
- Market conditions: 68 active listings in the ZIP; high-income renter base; 487 units permitted in Southeastern Connecticut Planning Region in 2024 (244 in 5+ unit buildings).
Forward outlook
- Local home prices are declining (-3.0%/yr); year-one equity from $688 of loan paydown is wiped out by about $3k of value loss. Plan a longer hold.
- At projected returns (-3.0% appreciation + 3.0% rent growth), your $28k cash investment doubles in ~3 years — after that, you're playing with house money.
Negotiation context
- It's been on market 35 days — a 3% lower offer ($97k) is reasonable based on typical stale-listing flexibility.
- 5 sale attempts since 8y ago with the ask held roughly flat each time — persistent listings suggest the price (not the market) is what's stuck; bring a comps-based counter.
- Current owner paid $34k; list at $100k implies a 193% gain — meaningful room to come down on a strong offer.
Risks & watch-outs
- Watch-outs: HOA is 20% of rent.
Questions for the listing agent
- It's been on market 35 days. Have you received any prior offers? Is the seller open to a 3% concession, seller financing, or rate buy-down credit?
- What does the HOA fee cover, when was the last increase, and are there any pending special assessments or reserve-fund shortfalls?
- Is there a deadline driving the sale (1031 exchange, divorce, estate, relocation)? That informs how much negotiation room exists.
- Schools are A-rated — typically a magnet for longer-tenancy family renters. What's the average tenant stay here, and is there a school-zone premium baked into asking?
- What's the average days-on-market for RENTAL listings here right now (not sales)? A rising rental-DOM trend means longer vacancies and softer asking-rent achievability than the comps imply.
- What's the recent tenant-quality profile in this submarket — average credit score on applications, eviction rate, late-payment / NSF rate, and stable-employment percentage? A property-management company in the area should have these aggregated.
- How much new for-sale + rental construction is in the pipeline within 1–3 miles? Heavy new supply typically softens prices + rents 12–24 months out; constrained supply supports both.
Investment metrics
- 1% rule
- 2.77% ✓
- Cap rate
- 18.43%
- Cash-on-cash
- 43.35%
- DSCR
- 2.93
- GRM
- 3.0
CMA / ARV
- ARV (median comp)
- $61,598
- List price
- $99,500
- Delta
- 61.53%
- Verdict
- OVERPRICED
- Comps
- 1 within 2.0 mi
Projected returns pro-forma
-3.0% appreciation · 3.0% rent growth · sell at horizon
- IRR
- 40.4%
- Equity multiple
- 2.73×
- Total profit
- $48,311
- Equity at exit
- $14,836
- IRR
- 46.7%
- Equity multiple
- 5.52×
- Total profit
- $125,976
- Equity at exit
- $8,603
Cash invested: $27,860 (down + closing). Projections, not guarantees.
Landlord ↔ Tenant lean methodology
- Overall (STATE)
- 27 Tenant-Leaning
- State Connecticut
- 27 Tenant-Leaning · D+7
- County
- — inherits STATE
- City
- — inherits STATE
ZIP-level market 06378
- Home prices YoY
- -17.0%
- Active inventory
- 68
- Price-to-rent
- 3.0×
Monthly cashflow live
- Estimated rent
- $2,755 medium interval (Pro) →
- Mortgage (P&I)
- −$522
- Tax from tax record
- −$47 /mo · $559/yr
- Insurance
- −$41
- HOA
- −$560
- Vacancy / Maint / Mgmt
- −$578
- Net cashflow
- $1,006
Break-even live
UW: 25.0% down · 7.5% · 30yr · 1.5% tax · 5.0% vac · 8.0% maint · 8.0% mgmt
Financing live
Cash to close
- Down payment
- $24,875
- Closing costs
- $2,985
- Reserves months
- —
- Total cash needed
- —
Loan-product check · same deal, 3 products live
Conventional
25% down · 7.5% · 30yr
- Down + closing
- —
- Monthly P&I
- —
- Monthly cashflow
- —
- DSCR
- —
- Eligible?
- —
Personal DTI + credit; lowest rate.
DSCR
20% down · 8.5% · 30yr
- Down + closing
- —
- Monthly P&I
- —
- Monthly cashflow
- —
- DSCR
- —
- Eligible?
- —
No personal income docs; deal must DSCR.
Hard money
10% down · 12.0% · 12mo
- Down + closing
- —
- Monthly P&I
- —
- Monthly cashflow
- —
- DSCR
- —
- Eligible?
- —
Short-term bridge; refi at stabilization.
HOA detail
- Monthly dues
- $560 · $6,720/yr
- Likely covers
- watergas
Listing history 27 events
-
2026-06-18days on market $99,500 Active 35 DOM
-
2026-06-17days on market $99,500 Active 34 DOM
-
2026-06-16days on market $99,500 Active 33 DOM
-
2026-06-15days on market $99,500 Active 32 DOM
-
2026-06-13days on market $99,500 Active 30 DOM
-
2026-06-09days on market $99,500 Active 26 DOM
-
2026-06-08days on market $99,500 Active 25 DOM
-
2026-06-07days on market $99,500 Active 24 DOM
-
2026-06-05days on market $99,500 Active 21 DOM
-
2026-06-03days on market $99,500 Active 20 DOM
-
2026-06-02days on market $99,500 Active 19 DOM
-
2026-06-01days on market $99,500 Active 18 DOM
-
2026-05-31days on market $99,500 Active 17 DOM
-
2026-05-14historical
-
2026-05-14$99,500 Active 910-char remark
-
2026-04-03status Under Contract
-
2026-03-30price $99,500
-
2026-02-26status Active
-
2026-02-11status Under Contract
-
2026-01-06price $108,400
-
2025-11-06$118,400 Active
-
2020-03-26soldstatus $34,000 Closed
Show marketing remark (334 chars)
Welcome home! Possibly the best lot in desirable Arlington Acres. A well maintained home with 2 bedrooms and 1 bath that sits on the end of a cul-de-sac. Upgrades include newer flooring, paint, gas stove and water heater. Extra storage space with large shed. Enjoy the peaceful yard and enclosed porch with the warmer weather to come.
-
2020-03-03status Under Contract
Show marketing remark (334 chars)
Welcome home! Possibly the best lot in desirable Arlington Acres. A well maintained home with 2 bedrooms and 1 bath that sits on the end of a cul-de-sac. Upgrades include newer flooring, paint, gas stove and water heater. Extra storage space with large shed. Enjoy the peaceful yard and enclosed porch with the warmer weather to come.
-
2020-02-10$36,000 Active
Show marketing remark (334 chars)
Welcome home! Possibly the best lot in desirable Arlington Acres. A well maintained home with 2 bedrooms and 1 bath that sits on the end of a cul-de-sac. Upgrades include newer flooring, paint, gas stove and water heater. Extra storage space with large shed. Enjoy the peaceful yard and enclosed porch with the warmer weather to come.
-
2018-10-01soldstatus $16,000 Closed
-
2018-09-20historical
-
2018-09-14$16,000 Active
ⓘ Source: listings_history table (triggers on properties + properties_extension) + one-shot
backfill from property_details.listing_events for pre-trigger history.
Tax reassessment forecast CT · Partial reset (capped growth)
- Current annual tax
- $559 · $47/mo
- Projected year-2 tax
- $1,344 · $112/mo
- Expected delta
- +$785/yr (+$65/mo · 140.5%)
ⓘ Screening estimate from a state-policy table — verify with the county assessor before closing.
Nearby sold comps map
Loading sold comps map…
Walkable amenities ~0.75 mi
Loading nearby amenities…
Taxation est. · year 1
- Rental income
- $33,056
- − Mortgage interest
- −$5,574
- − Property taxes
- −$559
- − Insurance
- −$498
- − Repairs & maintenance
- −$2,645
- − Management
- −$2,645
- − HOA
- −$6,720
- − Depreciation
- −$2,895
- Taxable income
- $11,523
- Est. tax owed @ 24.0%
- −$2,765
- After-tax cash flow
- $9,311/yr
For passive investors: Depreciation is non-cash, so a rental often shows a tax loss while cash-flowing — sheltering income. Rental losses are passive: they offset passive income freely, and up to $25,000/yr can offset ordinary (W-2) income if you actively participate and your MAGI is under $100k (phasing out to $0 by $150k); unused losses carry forward. On sale, claimed depreciation is recaptured at up to 25%, and gains may owe capital-gains tax (a 1031 exchange can defer both). Figures are a year-1 estimate at your 24.0% rate — not tax advice; consult a CPA.
Schools (NCES district)
- District
- Stonington School District
- NCES district ID
- 0904380
- Math proficiency
- 54% ▼ -10.00%
- Reading proficiency
- 70% ▼ -7.00%
- Median HH income
- $75,939
- Composite
- 55.15/100
- National rank
- #1280
- State rank
- #43 of 153 in CT
Livability — Stonington
- Score
- 66/100
- State rank
- #118
- US rank
- #11509
Category grades
Schools grade is shown separately in the Schools card above.
Census & demographics
- County
- New London County · 147,197 people
- City population
- 5,555
- Metro
- Norwich-New London, CT
- Population (ZIP)
- 5,555
- Household income
- $135,714
- Rent vs Own
- Severe rent burden
- 98.0
Population outlook (Southeastern Connecticut County) Hauer SSP2
- By 2040
- 293,442
Race, ethnicity, and origin ACS 2023
- Neighborhood character
- Predominantly White (93%)
- Race & ethnicity
- White 93% Hispanic / Latino 4% Two or more races 3% Black 2%
- Common ancestry
- Lithuanian 8% Romanian 8% Slovak 3%
- Foreign-born
- 4% · Canada
- Languages at home
- 95% English-only · Spanish 2% French/Haitian/Cajun 1%
Political lean MEDSL · Southeastern Connecticut
- 2024 margin
- D (+13.0) · D 55.6% · R 42.6% · Other 1.8%
- All cycles
- 2024: D+13.0
Not yet ingested
- Civics
- —
Market trends
- HPI YoY
- ▼ -39.67%
- Current HPI
- 193.423
- Rent YoY
- —
- Metro
- Norwich-New London, CT
- State GDP YoY
- ▲ 1.06%
- F500 in state
- 38
Industry mix (Fortune 500 HQ in CT)
| Industry | F500 HQs | Revenue |
|---|---|---|
| Industrial Machinery | 4 | $38B |
|
||
| Insurance | 3 | $71B |
|
||
| Financial Services | 2 | $25B |
|
||
| Transportation / Logistics | 2 | $18B |
|
||
| Healthcare | 1 | $247B |
|
||
| Telecommunications | 1 | $55B |
|
||
Price history
+521.9% since first listed14 events — show timeline
- 2026-05-14 Listed $99,500 Smart MLS
- 2026-05-14 Listing Removed — Smart MLS
- 2026-04-03 Pending — Smart MLS
- 2026-03-30 Price Changed $99,500 Smart MLS
- 2026-02-26 Relisted — Smart MLS
- 2026-02-11 Pending — Smart MLS
- 2026-01-06 Price Changed $108,400 Smart MLS
- 2025-11-06 Listed $118,400 Smart MLS
- 2020-03-26 Sold (MLS) $34,000 Smart MLS
- 2020-03-03 Pending — Smart MLS
- 2020-02-10 Listed $36,000 Smart MLS
- 2018-10-01 Sold (MLS) $16,000 Smart MLS
- 2018-09-20 Listing Removed — Smart MLS
- 2018-09-14 Listed $16,000 Smart MLS
Property tax history
+2.3%/yrLatest (2022): $559 · -1.4% YoY. Source: county tax records.
Cash-flow waterfall
monthlySold comps — $/sqft
last 12 mo · ≤1 miLoading sold comps…