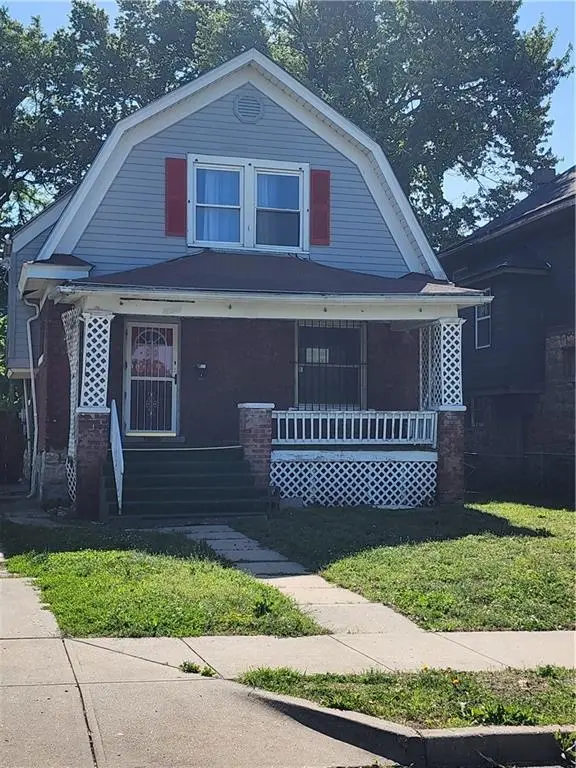
3345 Montgall Ave · Kansas City, MO
Flood risk 1/10 · Minimal
- FEMA flood zone
- X (unshaded)
- Chance of flooding over 30 yrs
- 0.0%
- Est. flood insurance / yr
- $473 – $860
Fire risk 1/10 · Minimal
- Est. fire insurance / yr
- $1,054 – $1,958
Heat risk 4/10 · Minor
- Hot days now (above 107°F)
- 7 days/yr
- Hot days in 30 yrs
- 17 days/yr
Wind risk 2/10 · Minimal
- Chance of severe wind over 30 yrs
- —
Air-quality risk 3/10 · Minor
- Unhealthy air days now
- 2 days/yr
- Unhealthy air days in 30 yrs
- 3 days/yr
Risk factors via First Street. Map © Google.
Why this score? — see what drove the A grade
The composite is a weighted blend of 9 inputs, each scored 0–100. Each bar is that input's sub-score; the figure is the points it added to the 100-point composite (weight × sub-score).
- Cash flow +30.0/30.0
- ARV discount +15.0/15.0
- 1% rule +10.0/10.0
- DSCR +10.0/10.0
- Appreciation +10.0/10.0
- Livability +3.9/5.0
- Rent growth +3.7/5.0
- Condition / age +2.5/5.0
- Schools +1.5/10.0
$85,000
🖨 Deal sheet 📄 Offer letter ✓ Due diligence
Listing remarks MLS
Seller requires $1,000 minimum for earnest deposit, and preapproval or proof of funds letter before offer will be submitted to seller. PLEASE FAX OFFERS TO 816.875.4834. THANK YOU
Key facts
- 4,855 sq ft lot
- Built 1905
- Listed 35 days
Property features AI
Finance
- Other: Located inside city limits
- HOA & community: No association fees
Exterior
- Parking: Off-street parking
- Utilities: City/public water (verify); Public sewer; Cable available
- Home design: Single-family residence (Bungalow); Faces west; Living area approximately 1,454 above grade
- Construction: Stone and frame construction; Composition roof; Has unfinished stone/rock basement
- Exterior features: Fixer-up condition; Metal fencing; City lot (36 x 135)
Interior
- Kitchen: Kitchen with laminate counters
- Bedrooms: 2 bedrooms (one on the main/first level)
- Flooring: Wood flooring
- Bathrooms: 1 full bathroom; 1 half bathroom; Full bathroom includes shower over tub
- Heating & cooling: Natural gas heating; No central air
- Interior features: Living room with gas fireplace; Living/Dining combo
- Laundry & utility: Laundry in lower level/basement
Neighborhood map
What this means for you Summary
Snapshot
- This is a 4-bed/1.0-bath single-family listed at $85k.
Deal economics
- At list price, monthly cash flow is $655 ($8k/yr) — positive.
- The deal already cash-flows at list — no discount required.
- Meets the 1% rule at list price ($1k rent vs $85k).
- Recommended offer: $82k (3.0% below list) — sets the bar for market timing.
- Cap rate 15.5% vs local median 3.9% in Kansas City — top-decile yield for the area; either an underpriced asset or a hidden risk that comps aren't pricing in. Stress-test before assuming the spread holds.
Location & tenants
- Location reads 78/100 on livability (#28 in MO, #2,671 nationally) — a middle-class / working-renter tenant base. Strengths: amenities A+, commute A+, cost of living A+; Watch: schools C-, crime F.
- Kansas City 33 (urban): math 12% / reading 24% proficiency, ranked #308 of 324 in MO (top 95%) — low school quality limits family demand, transient renter base, plan for 1-2y turnover; 75% free/reduced lunch — lower-income household profile, screen leases tightly.
- Market conditions: Rents rising fast (+4.7%/yr); 86 active listings in the ZIP; 40 comparable units currently listed for rent nearby; rentals at typical pace (median 24d on market — plan ~3-4 weeks tenant-placement turnaround); lower-income renter base — watch delinquency; 4,002 units permitted in Jackson County in 2024 (2,271 in 5+ unit buildings).
- At $1,488/mo this rent would consume 49% of the median local household income ($36k/yr) (locally 946% of renters already pay >50% of income on rent) — very limited rent-growth headroom before tenants either downsize or default.
Forward outlook
- In year one you build about $9k of equity ($588 loan paydown + $8k appreciation (10.0% local appreciation)).
- Jackson County population projected at +4% by 2050 — modest demand growth; plan on rents tracking national, not racing it.
- At projected returns (10.0% appreciation + 4.7% rent growth), your $24k cash investment doubles in ~2 years — after that, you're playing with house money.
- By year 4, paydown + projected appreciation supports a ~$32k cash-out refi (75% LTV) — recoverable capital for the next deal without selling this one.
Negotiation context
- It's been on market 35 days — a 3% lower offer ($82k) is reasonable based on typical stale-listing flexibility.
- 5 sale attempts since 22y ago; this cycle's ask has dropped $14k (15%) from the opening price — seller is motivated, your offer sets the floor, not the list.
Risks & watch-outs
- Watch-outs: built in 1905 — expect roof / HVAC / electrical / plumbing capex.
Questions for the listing agent
- It's been on market 35 days. Have you received any prior offers? Is the seller open to a 3% concession, seller financing, or rate buy-down credit?
- Built in 1905 — when were the roof, HVAC, electrical panel, plumbing, and water heater last replaced?
- Is there a deadline driving the sale (1031 exchange, divorce, estate, relocation)? That informs how much negotiation room exists.
- Crime grade is F in this area — have there been break-ins, vandalism, or insurance claims at this property in the last 3 years? What carrier currently insures it and at what premium?
- What's the average days-on-market for RENTAL listings here right now (not sales)? A rising rental-DOM trend means longer vacancies and softer asking-rent achievability than the comps imply.
- What's the recent tenant-quality profile in this submarket — average credit score on applications, eviction rate, late-payment / NSF rate, and stable-employment percentage? A property-management company in the area should have these aggregated.
- How much new for-sale + rental construction is in the pipeline within 1–3 miles? Heavy new supply typically softens prices + rents 12–24 months out; constrained supply supports both.
Investment metrics
- 1% rule
- 1.75% ✓
- Cap rate
- 15.55%
- Cash-on-cash
- 33.05%
- DSCR
- 2.47
- GRM
- 4.8
CMA / ARV
- ARV (median comp)
- $147,890
- List price
- $85,000
- Delta
- -42.52%
- Verdict
- UNDERPRICED
- Comps
- 20 within 1.0 mi
Show comp detail 12 sales within ~0.75 mi
| Address | Dist | Beds/Ba | Sqft | Sold | Price | $/sf | Match |
|---|---|---|---|---|---|---|---|
| 3431 Wabash Ave | 0.16mi | 3/1.5 (-1) | 1,533 (+5%) | 3mo | $214,900 | $140 | 74 |
| 3416 Park Ave | 0.28mi | 3/1.5 (-1) | 1,436 (-1%) | 5mo | $125,000 | $87 | 74 |
| 3509 Brooklyn Ave | 0.35mi | 4/2.0 | 1,418 (-2%) | 3mo | $130,000 | $92 | 73 |
| 3800 Chestnut Ave | 0.52mi | 3/1.0 (-1) | 1,470 (+1%) | 1mo | $79,900 | $54 | 68 |
| 2922 E 30th St | 0.52mi | 3/1.0 (-1) | 1,364 (-6%) | 3mo | $73,600 | $54 | 58 |
| 2112 E 36th St | 0.42mi | 3/2.0 (-1) | 1,343 (-8%) | 2mo | $150,000 | $112 | 57 |
| 3009 Garfield Ave | 0.59mi | 3/1.5 (-1) | 1,396 (-4%) | 3mo | $85,000 | $61 | 57 |
| 3910 Wabash Ave | 0.69mi | 4/2.0 | 1,366 (-6%) | 1mo | $10,000 | $7 | 53 |
| 2947 Garfield Ave | 0.72mi | 3/2.0 (-1) | 1,527 (+5%) | 0mo | $125,000 | $82 | 49 |
| 3717 Indiana Ave | 0.61mi | 4/1.5 | 1,644 (+13%) | 2mo | $129,000 | $78 | 46 |
| 3805 Bellefontaine Ave | 0.59mi | 3/1.5 (-1) | 1,624 (+12%) | 5mo | $169,900 | $105 | 42 |
| 3337 Flora Ave | 0.75mi | 3/2.0 (-1) | 1,600 (+10%) | 2mo | $178,900 | $112 | 38 |
Match score weights: distance 35% · size 25% · config 20% · recency 20%. Top-matched comps best support the ARV.
Projected returns pro-forma
10.0% appreciation · 4.65% rent growth · sell at horizon
- IRR
- 50.5%
- Equity multiple
- 4.80×
- Total profit
- $90,534
- Equity at exit
- $76,575
- IRR
- 44.8%
- Equity multiple
- 11.05×
- Total profit
- $239,185
- Equity at exit
- $165,136
Cash invested: $23,800 (down + closing). Projections, not guarantees.
Landlord ↔ Tenant lean methodology
- Overall (STATE)
- 81 Strongly Landlord-Friendly
- State Missouri
- 81 Strongly Landlord-Friendly · R+10
- County
- — inherits STATE
- City
- — inherits STATE
ZIP-level market 64128
- Home prices YoY
- 21.6%
- Rents YoY
- 4.7%
- Active inventory
- 86
- Price-to-rent
- 4.8×
Monthly cashflow live
- Estimated rent
- $1,488 high interval (Pro) →
- Mortgage (P&I)
- −$446
- Tax from tax record
- −$39 /mo · $464/yr
- Insurance
- −$35
- HOA
- −$0
- Vacancy / Maint / Mgmt
- −$312
- Net cashflow
- $655
Break-even live
UW: 25.0% down · 7.5% · 30yr · 1.5% tax · 5.0% vac · 8.0% maint · 8.0% mgmt
Financing live
Cash to close
- Down payment
- $21,250
- Closing costs
- $2,550
- Reserves months
- —
- Total cash needed
- —
Loan-product check · same deal, 3 products live
Conventional
25% down · 7.5% · 30yr
- Down + closing
- —
- Monthly P&I
- —
- Monthly cashflow
- —
- DSCR
- —
- Eligible?
- —
Personal DTI + credit; lowest rate.
DSCR
20% down · 8.5% · 30yr
- Down + closing
- —
- Monthly P&I
- —
- Monthly cashflow
- —
- DSCR
- —
- Eligible?
- —
No personal income docs; deal must DSCR.
Hard money
10% down · 12.0% · 12mo
- Down + closing
- —
- Monthly P&I
- —
- Monthly cashflow
- —
- DSCR
- —
- Eligible?
- —
Short-term bridge; refi at stabilization.
Rent comps 40 comps
| Address | Beds | Baths | Sqft | Rent | $/sqft | DOM | Units | Dist |
|---|---|---|---|---|---|---|---|---|
| 3330 Agnes Ave Kansas City, MO | 3.0 | 1.0 | 1000 | $1,410 | $1.41 | 43d | 1 | 0.17mi |
| 3346 Agnes Ave Kansas City, MO | 3.0 | 1.0 | 1400 | $1,200 | $0.86 | 7d | 1 | 0.17mi |
| 3304 Agnes Ave Unit Downstairs Kansas City, MO | 3.0 | 1.0 | 1150 | $1,095 | $0.95 | 43d | 1 | 0.19mi |
| 3524 Bellefontaine Ave Kansas City, MO | 3.0 | 1.0 | 1228 | $1,350 | $1.10 | 43d | 1 | 0.33mi |
| 3419 College Ave Kansas City, MO | 4.0 | 1.0 | 1608 | $1,300 | $0.81 | 2d | 1 | 0.40mi |
| 2120 Linwood Blvd Kansas City, MO | 3.0 | 1.0 | 1326 | $1,400 | $1.06 | 43d | 1 | 0.40mi |
| 2018 E 35th St Kansas City, MO | 3.0 | 2.0 | 1502 | $1,800 | $1.20 | 3d | 1 | 0.41mi |
| 3630 Agnes Ave Kansas City, MO | 3.0 | 2.0 | 1448 | $1,500 | $1.04 | 10d | 1 | 0.42mi |
| 2002 E 35th St Kansas City, MO | 3.0 | 2.0 | 1426 | $1,295 | $0.91 | 7d | 1 | 0.44mi |
| 3205 E 31st St Kansas City, MO | 4.0 | 1.0 | 1800 | $1,325 | $0.74 | 23d | 1 | 0.46mi |
| 3009 Garfield Ave Kansas City, MO | 3.0 | 1.5 | 1334 | $1,425 | $1.07 | 43d | 1 | 0.56mi |
| 3305 Askew Ave Kansas City, MO | 3.0 | 1.5 | 1428 | $1,450 | $1.02 | 23d | 1 | 0.58mi |
| 3817 S Benton Ave Kansas City, MO | 4.0 | 1.5 | 1380 | $1,650 | $1.20 | 23d | 1 | 0.60mi |
| 3525 Monroe Ave Kansas City, MO | 3.0 | 2.0 | 1569 | $1,500 | $0.96 | 43d | 1 | 0.68mi |
| 3840 Bellefontaine Ave Kansas City, MO | 3.0 | 1.0 | 1500 | $1,500 | $1.00 | 16d | 1 | 0.69mi |
| 3902 Wabash Ave Kansas City, MO | 4.0 | 2.0 | 1400 | $1,850 | $1.32 | 43d | 1 | 0.69mi |
| 3818 Indiana Ave Kansas City, MO | 3.0 | 1.5 | 1223 | $1,147 | $0.94 | 43d | 1 | 0.73mi |
| 3739 Bales Ave Kansas City, MO | 3.0 | 2.0 | 1400 | $1,575 | $1.12 | 23d | 1 | 0.73mi |
| 3609 Wayne Ave Kansas City, MO | 3.0 | 1.5 | 1118 | $1,900 | $1.70 | 23d | 1 | 0.74mi |
| 2708 Olive St Kansas City, MO | 4.0 | 2.0 | 1585 | $1,500 | $0.95 | 17d | 1 | 0.83mi |
| 3713 Cleveland Ave Kansas City, MO | 4.0 | 1.0 | 1256 | $1,250 | $1.00 | 16d | 1 | 0.83mi |
| 2724 Brooklyn Ave Kansas City, MO | 3.0 | 2.5 | 1398 | $1,440 | $1.03 | 23d | 1 | 0.84mi |
| 3332 Norton Ave Kansas City, MO | 3.0 | 1.0 | 1272 | $1,350 | $1.06 | 43d | 1 | 0.86mi |
| 4014 Park Ave Kansas City, MO | 3.0 | 2.0 | 1271 | $1,273 | $1.00 | 43d | 1 | 0.86mi |
| 4107 Olive St Kansas City, MO | 3.0 | 1.5 | 1271 | $1,578 | $1.24 | 7d | 1 | 0.94mi |
| 3314 Tracy Ave Unit B Kansas City, MO | 3.0 | 1.0 | 1100 | $947 | $0.86 | 21d | 1 | 0.95mi |
| 3314 Tracy Ave Kansas City, MO | 3.0 | 1.0 | 1100 | $947 | $0.86 | 7d | 1 | 0.95mi |
| 4119 S Benton Ave Kansas City, MO | 4.0 | 2.0 | 1700 | $1,800 | $1.06 | 43d | 1 | 0.98mi |
| 2846 Myrtle Ave Kansas City, MO | 3.0 | 2.0 | 1705 | $1,350 | $0.79 | 16d | 1 | 0.98mi |
| 4116 Bellefontaine Ave Kansas City, MO | 3.0 | 1.0 | 1234 | $1,000 | $0.81 | 23d | 1 | 0.98mi |
| 4112 Park Ave Kansas City, MO | 4.0 | 2.0 | 1700 | $1,800 | $1.06 | 14d | 1 | 0.98mi |
| 4144 College Ave Kansas City, MO | 3.0 | 1.0 | 1108 | $1,095 | $0.99 | 23d | 1 | 1.08mi |
| 2729 Grove St Kansas City, MO | 3.0 | 2.0 | 1510 | $1,375 | $0.91 | 43d | 1 | 1.09mi |
| 3414 Elmwood Ave Kansas City, MO | 4.0 | 1.0 | 1109 | $1,300 | $1.17 | 16d | 1 | 1.17mi |
| 4028 Myrtle Ave Kansas City, MO | 3.0 | 1.0 | 1100 | $1,490 | $1.35 | 43d | 1 | 1.18mi |
| 3736 Cypress Ave Kansas City, MO | 3.0 | 1.0 | 1100 | $1,200 | $1.09 | 7d | 1 | 1.22mi |
| 3032 Elmwood Ave Kansas City, MO | 3.0 | 1.0 | 1027 | $1,275 | $1.24 | 7d | 1 | 1.23mi |
| 4309 College Ave Kansas City, MO | 3.0 | 2.0 | 1040 | $1,550 | $1.49 | 16d | 1 | 1.25mi |
| 4219 Woodland Ave Kansas City, MO | 4.0 | 2.0 | 1566 | $1,900 | $1.21 | 2d | 1 | 1.25mi |
| 2419 Bales Ave Kansas City, MO | 3.0 | 1.5 | 1116 | $1,500 | $1.34 | 3d | 1 | 1.30mi |
Listing history 24 events
-
2026-06-18days on market $85,000 Active 35 DOM
-
2026-06-17days on market $85,000 Active 34 DOM
-
2026-06-16days on market $85,000 Active 33 DOM
-
2026-06-15pricedays on market $85,000 Active 32 DOM
-
2026-06-13days on market $99,500 Active 30 DOM
-
2026-06-09days on market $99,500 Active 26 DOM
-
2026-06-08days on market $99,500 Active 25 DOM
-
2026-06-07days on market $99,500 Active 24 DOM
-
2026-06-05days on market $99,500 Active 21 DOM
-
2026-06-03days on market $99,500 Active 20 DOM
-
2026-06-02days on market $99,500 Active 19 DOM
-
2026-06-01days on market $99,500 Active 18 DOM
-
2026-05-31days on market $99,500 Active 17 DOM
-
2026-05-14$99,500 Active 57-char remark
-
2026-05-08historical
-
2026-04-03$120,000 Active
-
2026-03-16historical
-
2008-02-06soldstatus
Show marketing remark (179 chars)
Seller requires $1,000 minimum for earnest deposit, and preapproval or proof of funds letter before offer will be submitted to seller. PLEASE FAX OFFERS TO 816.875.4834. THANK YOU
-
2008-02-04$38,000
Show marketing remark (179 chars)
Seller requires $1,000 minimum for earnest deposit, and preapproval or proof of funds letter before offer will be submitted to seller. PLEASE FAX OFFERS TO 816.875.4834. THANK YOU
-
2007-08-21$38,000
-
2006-07-06soldstatus
-
2004-09-23soldstatus
-
2004-07-24$26,500
-
1995-10-10soldstatus
ⓘ Source: listings_history table (triggers on properties + properties_extension) + one-shot
backfill from property_details.listing_events for pre-trigger history.
Tax reassessment forecast MO · Resets to sale price
- Current annual tax
- $464 · $39/mo
- Projected year-2 tax
- $824 · $69/mo
- Expected delta
- +$361/yr (+$30/mo · 77.8%)
ⓘ Screening estimate from a state-policy table — verify with the county assessor before closing.
Climate risk First Street
- Flood 1/10 Low FEMA zone X (unshaded) · 0% chance over 30 yrs
- Wildfire 1/10 Low
- Heat 4/10 Moderate 7 d/yr ≥107°F today · 17 d/yr by 30 yrs out
- Wind 2/10 Low
- Air quality 3/10 Moderate 2 unhealthy d/yr today · 3 by 30 yrs out
Nearby sold comps map
Loading sold comps map…
Walkable amenities ~0.75 mi
Loading nearby amenities…
Taxation est. · year 1
- Rental income
- $17,853
- − Mortgage interest
- −$4,761
- − Property taxes
- −$464
- − Insurance
- −$425
- − Repairs & maintenance
- −$1,428
- − Management
- −$1,428
- − Depreciation
- −$2,473
- Taxable income
- $6,874
- Est. tax owed @ 24.0%
- −$1,650
- After-tax cash flow
- $6,216/yr
For passive investors: Depreciation is non-cash, so a rental often shows a tax loss while cash-flowing — sheltering income. Rental losses are passive: they offset passive income freely, and up to $25,000/yr can offset ordinary (W-2) income if you actively participate and your MAGI is under $100k (phasing out to $0 by $150k); unused losses carry forward. On sale, claimed depreciation is recaptured at up to 25%, and gains may owe capital-gains tax (a 1031 exchange can defer both). Figures are a year-1 estimate at your 24.0% rate — not tax advice; consult a CPA.
Schools (NCES district)
- District
- Kansas City 33
- NCES district ID
- 2916400
- Math proficiency
- 12% ▼ -8.00%
- Reading proficiency
- 24% ▬ 0.00%
- Median HH income
- $35,227
- Composite
- 14.8/100
- National rank
- #9387
- State rank
- #308 of 324 in MO
Livability — Kansas City
- Score
- 78/100
- State rank
- #28
- US rank
- #2671
Category grades
Schools grade is shown separately in the Schools card above.
Census & demographics
- Census place
- Kansas City, MO
- County
- Jackson County · 687,798 people
- City population
- 439,467
- Metro
- Kansas City, MO-KS
- Population (ZIP)
- 11,912
- Household income
- $36,088
- Rent vs Own
- Severe rent burden
- 946.0
Population outlook (Jackson County) Hauer SSP2
- Today (2025)
- 719,589 people
- By 2030
- 731,456 · +1.6%
- By 2040
- 746,689 · +3.8%
- By 2050
- 749,289 · +4.1%
- By 2075
- 736,227 · +2.3%
- By 2100
- 668,210 · -7.1%
Race, ethnicity, and origin ACS 2023
- Neighborhood character
- Predominantly Black (79%)
- Race & ethnicity
- Black 79% Hispanic / Latino 9% White 8% Two or more races 7%
- Hispanic origin (detail)
- Mexican 6%
- Common ancestry
- Swedish 1% Hispanic 1%
- Foreign-born
- 7% · Canada
- Languages at home
- 88% English-only · Spanish 7% French/Haitian/Cajun 2%
Political lean MEDSL · Jackson
- 2024 margin
- D (+19.3) · D 58.9% · R 39.5% · Other 1.6%
- 2008→2024 swing
- -6.1pp toward R · 2008: 25.4pp · 2024: 19.3pp
- All cycles
- 2024: D+19.3 2020: D+22.0 2016: D+16.6 2012: D+19.0 2008: D+25.4
Not yet ingested
- Civics
- —
Market trends
- HPI YoY
- ▲ 73.41%
- Current HPI
- 412.6862
- Rent YoY
- ▲ 4.65%
- Metro
- Kansas City, MO-KS
- State GDP YoY
- ▲ 1.84%
- F500 in state
- 20
Industry mix (Fortune 500 HQ in MO)
| Industry | F500 HQs | Revenue |
|---|---|---|
| Healthcare | 1 | $163B |
|
||
| Insurance | 1 | $21B |
|
||
| Industrial Technology | 1 | $17B |
|
||
| Retail | 1 | $16B |
|
||
| Industrial Distribution | 1 | $10B |
|
||
| Utilities | 1 | $9B |
|
||
Price history
+220.8% since first listed12 events — show timeline
- 2026-06-15 Price Changed $85,000 Heartland MLS as Distributed by MLS Grid
- 2026-05-14 Listed $99,500 Heartland MLS as Distributed by MLS Grid
- 2026-05-08 Listing Removed — Heartland MLS as Distributed by MLS Grid
- 2026-04-03 Listed $120,000 Heartland MLS as Distributed by MLS Grid
- 2026-03-16 Coming Soon — Heartland MLS as Distributed by MLS Grid
- 2008-02-06 Sold (MLS) — Heartland MLS as Distributed by MLS Grid
- 2008-02-04 Listed $38,000 Heartland MLS as Distributed by MLS Grid
- 2007-08-21 Listed $38,000 Heartland MLS as Distributed by MLS Grid
- 2006-07-06 Sold (Public Records) — Public Records
- 2004-09-23 Sold (MLS) — Heartland MLS as Distributed by MLS Grid
- 2004-07-24 Listed $26,500 Heartland MLS as Distributed by MLS Grid
- 1995-10-10 Sold (Public Records) — Public Records
Property tax history
+5.0%/yrLatest (2025): $464 · -45.8% YoY. Source: county tax records.
Cash-flow waterfall
monthlySold comps — $/sqft
last 12 mo · ≤1 miLoading sold comps…