416 Broadway St · Bowerston, OH
Flood risk 6/10 · Moderate
- FEMA flood zone
- X (unshaded)
- Chance of flooding over 30 yrs
- 0.97%
- Est. flood insurance / yr
- $473 – $860
Fire risk 2/10 · Minimal
- Est. fire insurance / yr
- $713 – $1,323
Heat risk 3/10 · Minor
- Hot days now (above 97°F)
- 7 days/yr
- Hot days in 30 yrs
- 18 days/yr
Wind risk 1/10 · Minimal
- Chance of severe wind over 30 yrs
- —
Air-quality risk 2/10 · Minimal
- Unhealthy air days now
- 1 days/yr
- Unhealthy air days in 30 yrs
- 2 days/yr
Risk factors via First Street. Map © Google.
Why this score? — see what drove the B grade
The composite is a weighted blend of 9 inputs, each scored 0–100. Each bar is that input's sub-score; the figure is the points it added to the 100-point composite (weight × sub-score).
- Cash flow +30.0/30.0
- 1% rule +10.0/10.0
- DSCR +10.0/10.0
- ARV discount +7.5/15.0
- Appreciation +4.8/10.0
- Schools +3.4/10.0
- Livability +2.9/5.0
- Rent growth +2.5/5.0
- Condition / age +2.5/5.0
$29,900
🖨 Deal sheet 📄 Offer letter ✓ Due diligence
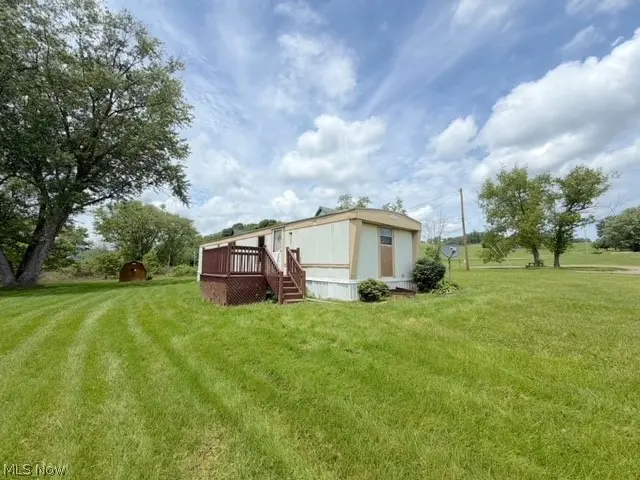
Listing remarks
If you are looking for an affordable property with potential, then this one is for you. This property features a 1983 14x56 mobile home with 2 bedrooms and 1 bath situated on a nice lot along a private, country-like street. In addition to the mobile home, there is a fixer-upper house that offers endless possibilities for renovation, storage, workshop space, or future improvement. Cash sale only. Property is being sold as-is. Please note: The purchaser of the neighboring property has the first option to purchase this parcel. This property is located in the 100-year flood zone.
Key facts
- Fixer-upper house
- 0.4 acre lot
- Parking
Tags
Property features AI
Exterior
- Parking: Driveway
- Utilities: Public water
- Home design: Single-story home; Above-grade finished area 784
- Construction: Metal siding; Flat rubber roof; Built by owner (year built source: Owner)
- Exterior features: Deck
Interior
- Bedrooms: 2 main-level bedrooms
- Bathrooms: 1 full bathroom (on main level)
- Heating & cooling: Forced air heating; Gas heating
- Interior features: 4 total rooms
- Laundry & utility: Laundry on the main level
Neighborhood map
What this means for you Summary
Snapshot
- This is a 2-bed/2.0-bath single-family listed at $30k.
Deal economics
- At list price, monthly cash flow is $553 ($7k/yr) — positive.
- The deal already cash-flows at list — no discount required.
- Meets the 1% rule at list price ($953 rent vs $30k).
Location & tenants
- Location reads 58/100 on livability (#1,051 in OH) — a working-class tenant base; expect higher turnover. Strengths: cost of living A+, housing B; Watch: schools D+, crime D-, amenities F.
- Conotton Valley Union Local (rural): math 37% / reading 42% proficiency, ranked #541 of 656 in OH (top 82%) — families likely to look elsewhere, expect single-tenant / working-renter base with shorter leases.
- Market conditions: 4 active listings in the ZIP; 1 units permitted in Harrison County in 2024 (0 in 5+ unit buildings).
Forward outlook
- In year one you build about $90 of equity ($207 loan paydown + $-117 appreciation (-0.4% local appreciation)).
- Harrison County population projected at -20% by 2050 — secular population decline; favor cash flow + early exit over multi-decade hold.
- At projected returns (-0.4% appreciation + 3.0% rent growth), your $8k cash investment doubles in ~2 years — after that, you're playing with house money.
Negotiation context
- Only 8 days on market — expect competitive offers; lowballing is unlikely to land.
Risks & watch-outs
- Climate carrying-cost: major flood risk — expect insurance premiums to compound above CPI over the hold.
Questions for the listing agent
- Is there a deadline driving the sale (1031 exchange, divorce, estate, relocation)? That informs how much negotiation room exists.
- Schools are D-rated, which usually means shorter tenancies and higher turnover. Who's the typical renter profile here, and what's been the actual vacancy rate?
- Crime grade is D in this area — have there been break-ins, vandalism, or insurance claims at this property in the last 3 years? What carrier currently insures it and at what premium?
- What's the average days-on-market for RENTAL listings here right now (not sales)? A rising rental-DOM trend means longer vacancies and softer asking-rent achievability than the comps imply.
- What's the recent tenant-quality profile in this submarket — average credit score on applications, eviction rate, late-payment / NSF rate, and stable-employment percentage? A property-management company in the area should have these aggregated.
- How much new for-sale + rental construction is in the pipeline within 1–3 miles? Heavy new supply typically softens prices + rents 12–24 months out; constrained supply supports both.
Investment metrics
- 1% rule
- 3.19% ✓
- Cap rate
- 28.49%
- Cash-on-cash
- 79.26%
- DSCR
- 4.53
- GRM
- 2.6
CMA / ARV
No comps found within radius.
Projected returns pro-forma
-0.39% appreciation · 3.0% rent growth · sell at horizon
- IRR
- 81.2%
- Equity multiple
- 5.04×
- Total profit
- $33,812
- Equity at exit
- $8,104
- IRR
- 83.0%
- Equity multiple
- 10.34×
- Total profit
- $78,156
- Equity at exit
- $9,290
Cash invested: $8,372 (down + closing). Projections, not guarantees.
Landlord ↔ Tenant lean methodology
- Overall (STATE)
- 73 Landlord-Friendly
- State Ohio
- 73 Landlord-Friendly · R+6
- County
- — inherits STATE
- City
- — inherits STATE
ZIP-level market 44695
- Home prices YoY
- -0.3%
- Active inventory
- 4
- Price-to-rent
- 2.6×
Monthly cashflow live
- Estimated rent
- $953 medium interval (Pro) →
- Mortgage (P&I)
- −$157
- Tax from tax record
- −$31 /mo · $368/yr
- Insurance
- −$12
- HOA
- −$0
- Vacancy / Maint / Mgmt
- −$200
- Net cashflow
- $553
Break-even live
UW: 25.0% down · 7.5% · 30yr · 1.5% tax · 5.0% vac · 8.0% maint · 8.0% mgmt
Financing live
Cash to close
- Down payment
- $7,475
- Closing costs
- $897
- Reserves months
- —
- Total cash needed
- —
Loan-product check · same deal, 3 products live
Conventional
25% down · 7.5% · 30yr
- Down + closing
- —
- Monthly P&I
- —
- Monthly cashflow
- —
- DSCR
- —
- Eligible?
- —
Personal DTI + credit; lowest rate.
DSCR
20% down · 8.5% · 30yr
- Down + closing
- —
- Monthly P&I
- —
- Monthly cashflow
- —
- DSCR
- —
- Eligible?
- —
No personal income docs; deal must DSCR.
Hard money
10% down · 12.0% · 12mo
- Down + closing
- —
- Monthly P&I
- —
- Monthly cashflow
- —
- DSCR
- —
- Eligible?
- —
Short-term bridge; refi at stabilization.
Listing history 7 events
-
2026-06-18days on market $29,900 Active 8 DOM
-
2026-06-17days on market $29,900 Active 7 DOM
-
2026-06-16days on market $29,900 Active 6 DOM
-
2026-06-15days on market $29,900 Active 5 DOM
-
2026-06-13days on market $29,900 Active 3 DOM
-
2026-06-12remarks 582-char remark
-
2026-06-12$29,900 Active 2 DOM
ⓘ Source: listings_history table (triggers on properties + properties_extension) + one-shot
backfill from property_details.listing_events for pre-trigger history.
Tax reassessment forecast OH · Partial reset (capped growth)
- Current annual tax
- $368 · $31/mo
- Projected year-2 tax
- $417 · $35/mo
- Expected delta
- +$49/yr (+$4/mo · 13.4%)
ⓘ Screening estimate from a state-policy table — verify with the county assessor before closing.
Climate risk First Street
- Flood 6/10 Major FEMA zone X (unshaded) · 97% chance over 30 yrs
- Wildfire 2/10 Low
- Heat 3/10 Moderate 7 d/yr ≥97°F today · 18 d/yr by 30 yrs out
- Wind 1/10 Low
- Air quality 2/10 Low 1 unhealthy d/yr today · 2 by 30 yrs out
Nearby sold comps map
Loading sold comps map…
Walkable amenities ~0.75 mi
Loading nearby amenities…
Taxation est. · year 1
- Rental income
- $11,436
- − Mortgage interest
- −$1,675
- − Property taxes
- −$368
- − Insurance
- −$150
- − Repairs & maintenance
- −$915
- − Management
- −$915
- − Depreciation
- −$870
- Taxable income
- $6,545
- Est. tax owed @ 24.0%
- −$1,571
- After-tax cash flow
- $5,065/yr
For passive investors: Depreciation is non-cash, so a rental often shows a tax loss while cash-flowing — sheltering income. Rental losses are passive: they offset passive income freely, and up to $25,000/yr can offset ordinary (W-2) income if you actively participate and your MAGI is under $100k (phasing out to $0 by $150k); unused losses carry forward. On sale, claimed depreciation is recaptured at up to 25%, and gains may owe capital-gains tax (a 1031 exchange can defer both). Figures are a year-1 estimate at your 24.0% rate — not tax advice; consult a CPA.
Schools (NCES district)
- District
- Conotton Valley Union Local
- NCES district ID
- 3904754
- Math proficiency
- 37% ▼ -18.00%
- Reading proficiency
- 42% ▼ -5.00%
- Median HH income
- $45,339
- Composite
- 33.62/100
- National rank
- #5405
- State rank
- #541 of 656 in OH
Livability — Bowerston
- Score
- 58/100
- State rank
- #1051
- US rank
- #20970
Category grades
Schools grade is shown separately in the Schools card above.
Census & demographics
- Census place
- Bowerston, OH
- County
- Carroll · 27,595 people
- Metro
- Canton-Massillon, OH
- Population (ZIP)
- 1,400
- Household income
- $58,938
- Rent vs Own
- Severe rent burden
- 14.9
Population outlook (Harrison County) Hauer SSP2
- Today (2025)
- 14,537 people
- By 2030
- 13,961 · -4.0%
- By 2040
- 12,753 · -12.3%
- By 2050
- 11,607 · -20.2%
- By 2075
- 9,299 · -36.0%
- By 2100
- 7,447 · -48.8%
Race, ethnicity, and origin ACS 2023
- Neighborhood character
- Predominantly White (99%)
- Race & ethnicity
- White 99%
- Common ancestry
- Slovak 6% Serbian 2% Lithuanian 1%
- Foreign-born
- 0%
- Languages at home
- 99% English-only · Spanish 1%
Political lean MEDSL · Harrison
- 2024 margin
- Solid R (+55.2) · D 21.9% · R 77.1%
- 2008→2024 swing
- -52.8pp toward R · 2008: -2.4pp · 2024: -55.2pp
- All cycles
- 2024: R+55.2 2020: R+52.6 2016: R+48.3 2012: R+14.9 2008: R+2.4
Not yet ingested
- Civics
- —
Market trends
- HPI YoY
- ▼ -0.39%
- Current HPI
- 136.87
- Rent YoY
- —
- Metro
- —
- State GDP YoY
- ▲ 1.98%
- F500 in state
- 48
Industry mix (Fortune 500 HQ in OH)
| Industry | F500 HQs | Revenue |
|---|---|---|
| Insurance | 3 | $145B |
|
||
| Industrial Machinery | 3 | $49B |
|
||
| Financial Services | 3 | $24B |
|
||
| Consumer Goods | 2 | $93B |
|
||
| Aerospace / Defense | 2 | $47B |
|
||
| Utilities | 2 | $33B |
|
||
Price history
+10.7% since first listed3 events — show timeline
- 2026-06-09 Listed $29,900 MLSNOW
- 2021-05-21 Sold (Public Records) $80,000 Public Records
- 2007-04-30 Sold (Public Records) $27,000 Public Records
Property tax history
+2.6%/yrLatest (2025): $368 · +0.1% YoY. Source: county tax records.
Cash-flow waterfall
monthlySold comps — $/sqft
last 12 mo · ≤1 miLoading sold comps…