3114 Park St · Columbia, SC
Flood risk 1/10 · Minimal
- FEMA flood zone
- X
- Chance of flooding over 30 yrs
- 0.0%
- Est. flood insurance / yr
- $435 – $905
Fire risk 2/10 · Minimal
- Est. fire insurance / yr
- $783 – $1,453
Heat risk 6/10 · Moderate
- Hot days now (above threshold)
- 7 days/yr
- Hot days in 30 yrs
- 16 days/yr
Wind risk No data
- Chance of severe wind over 30 yrs
- —
Air-quality risk No data
- Unhealthy air days now
- —
- Unhealthy air days in 30 yrs
- —
Risk factors via First Street. Map © Google.
Why this score? — see what drove the D grade
The composite is a weighted blend of 9 inputs, each scored 0–100. Each bar is that input's sub-score; the figure is the points it added to the 100-point composite (weight × sub-score).
- Cash flow +15.0/30.0
- ARV discount +7.5/15.0
- DSCR +4.6/10.0
- Livability +3.9/5.0
- 1% rule +3.3/10.0
- Rent growth +3.3/5.0
- Schools +2.6/10.0
- Condition / age +2.5/5.0
- Appreciation +0.0/10.0
$224,000
🖨 Deal sheet 📄 Offer letter ✓ Due diligence
Listing remarks
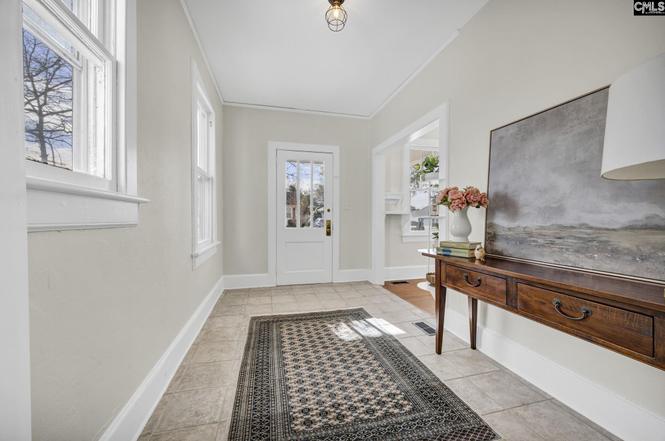
Fantastic investment opportunity with the potential to create a true 3-bedroom, 2-bath layout with an en-suite primary bedroom (ask your agent for renovation ideas and possibilities). Nestled in the heart of Earlewood, this charming white bungalow offers the character buyers love and the upside investors are searching for. Built in 1945, the home features beautifully refinished original hardwood floors, fresh interior paint, and updated lighting throughout. The kitchen has been refreshed with butcher block countertops and freshly painted cabinetry, creating a warm and functional space that blends vintage charm with modern touches. The flexible floor plan currently includes three bedrooms an
Key facts
- Spacious front porch
- Fenced backyard
- Large storage shed
Tags
Property features AI
Exterior
- Parking: 3 parking spaces
- Utilities: Public water; Public sewer
- Home design: Single-story house; House faces southwest
- Construction: Vinyl exterior finish; Crawlspace foundation
- Exterior features: Covered front porch; Shed; Rear chain-link fencing
Interior
- Kitchen: Tile floor; Painted cabinets; Countertops (other); Dishwasher; Free-standing gas range
- Bedrooms: Master bedroom on main level with tub/shower, shared bath access, ceiling fan, private closet, hardwood floors; Second bedroom on main level with tub/shower, shared bath access, private closet, hardwood floors; Third bedroom on main level with tub/shower, shared bath access, private closet, luxury vinyl plank floors
- Flooring: Hardwood floors in living room, formal dining, and most bedrooms; Luxury vinyl plank in one bedroom; Tile in kitchen
- Bathrooms: One full bathroom (main level)
- Heating & cooling: Central heating; Central air conditioning
- Interior features: Wood-burning fireplace; One fireplace total; Dishwasher; Electric water heater; Free-standing gas range
- Laundry & utility: Laundry located on main level in unheated space; Electric water heater
Neighborhood map
What this means for you Summary
Snapshot
- This is a 3-bed/1.0-bath single-family listed at $224k.
Deal economics
- At list price, monthly cash flow is $68 ($822/yr) — positive.
- The deal already cash-flows at list — no discount required.
- To meet the 1% rule (rent ≥ 1% of price), the offer needs to be $186k (17.1% below list).
- Recommended offer: $186k (17.1% below list) — sets the bar for 1% rule.
- Cap rate 6.7% vs local median 5.0% in Columbia — top-decile yield for the area; either an underpriced asset or a hidden risk that comps aren't pricing in. Stress-test before assuming the spread holds.
Location & tenants
- Location reads 78/100 on livability (#18 in SC, #2,436 nationally) — a middle-class / working-renter tenant base. Strengths: amenities A+, commute A+, cost of living A+; Watch: employment D, crime F.
- Richland 01 (urban): math 26% / reading 36% proficiency, ranked #54 of 80 in SC (top 68%) — families likely to look elsewhere, expect single-tenant / working-renter base with shorter leases; 64% free/reduced lunch — lower-income household profile, screen leases tightly.
- Zoned schools: Logan Elementary (math 42% / reading 42%, grade F, #256 of 597 statewide, top 45%, 233 students, 100% FRL); Columbia High (math 17% / reading 67%, grade F, #174 of 196 statewide, top 90%, 665 students, 100% FRL) — zoned schools average 100% FRL vs 64% district-wide (36 pts higher); higher-poverty schools than district average — tighter screening recommended.
- Market conditions: Rents rising (+3.2%/yr); 114 active listings in the ZIP; 24 comparable units currently listed for rent nearby; rentals at typical pace (median 21d on market — plan ~3-4 weeks tenant-placement turnaround); lower-income renter base — watch delinquency; 3,472 units permitted in Richland County in 2024 (1,096 in 5+ unit buildings).
- At $1,857/mo this rent would consume 69% of the median local household income ($32k/yr) (locally 3456% of renters already pay >50% of income on rent) — very limited rent-growth headroom before tenants either downsize or default.
Forward outlook
- Local home prices are declining (-3.0%/yr); year-one equity from $2k of loan paydown is wiped out by about $7k of value loss. Plan a longer hold.
- Richland County population projected at +30% by 2050 — long-run rental-demand tailwind backs the buy-and-hold thesis.
Negotiation context
- Only 6 days on market — expect competitive offers; lowballing is unlikely to land.
- 3 sale attempts since 5y ago; this cycle's ask has dropped $51k (19%) from the opening price — seller is motivated, your offer sets the floor, not the list.
- Current owner paid $190k; 18% above their basis — modest negotiation headroom, anchor on the comps not their cost.
Risks & watch-outs
- Watch-outs: built in 1945 — expect roof / HVAC / electrical / plumbing capex.
- Climate carrying-cost: extreme-heat days projected 7→16/yr by 2055 (HVAC capex compounding) — expect insurance premiums to compound above CPI over the hold.
Questions for the listing agent
- Built in 1945 — when were the roof, HVAC, electrical panel, plumbing, and water heater last replaced?
- Is there a deadline driving the sale (1031 exchange, divorce, estate, relocation)? That informs how much negotiation room exists.
- Schools are D-rated, which usually means shorter tenancies and higher turnover. Who's the typical renter profile here, and what's been the actual vacancy rate?
- Crime grade is F in this area — have there been break-ins, vandalism, or insurance claims at this property in the last 3 years? What carrier currently insures it and at what premium?
- The area grade is low — what's the realistic commute time and amenity access for the typical tenant pool here? Any planned neighborhood developments (good or bad) we should know about?
- What's the average days-on-market for RENTAL listings here right now (not sales)? A rising rental-DOM trend means longer vacancies and softer asking-rent achievability than the comps imply.
- What's the recent tenant-quality profile in this submarket — average credit score on applications, eviction rate, late-payment / NSF rate, and stable-employment percentage? A property-management company in the area should have these aggregated.
- How much new for-sale + rental construction is in the pipeline within 1–3 miles? Heavy new supply typically softens prices + rents 12–24 months out; constrained supply supports both.
Investment metrics
- 1% rule
- 0.83% ✗
- Cap rate
- 6.66%
- Cash-on-cash
- 1.31%
- DSCR
- 1.06
- GRM
- 10.1
CMA / ARV
No comps found within radius.
Projected returns pro-forma
-3.0% appreciation · 3.18% rent growth · sell at horizon
- IRR
- -14.1%
- Equity multiple
- 0.50×
- Total profit
- $-31,664
- Equity at exit
- $33,399
- IRR
- -5.1%
- Equity multiple
- 0.67×
- Total profit
- $-20,829
- Equity at exit
- $19,367
Cash invested: $62,720 (down + closing). Projections, not guarantees.
Landlord ↔ Tenant lean methodology
- Overall (STATE)
- 90 Strongly Landlord-Friendly
- State South Carolina
- 90 Strongly Landlord-Friendly · R+6
- County
- — inherits STATE
- City
- — inherits STATE
ZIP-level market 29201
- Rents YoY
- 3.2%
- Active inventory
- 114
- Price-to-rent
- 10.1×
Monthly cashflow live
- Estimated rent
- $1,857 high interval (Pro) →
- Mortgage (P&I)
- −$1,175
- Tax from tax record
- −$130 /mo · $1,563/yr
- Insurance
- −$93
- HOA
- −$0
- Vacancy / Maint / Mgmt
- −$390
- Net cashflow
- $68
Break-even live
UW: 25.0% down · 7.5% · 30yr · 1.5% tax · 5.0% vac · 8.0% maint · 8.0% mgmt
Financing live
Cash to close
- Down payment
- $56,000
- Closing costs
- $6,720
- Reserves months
- —
- Total cash needed
- —
Loan-product check · same deal, 3 products live
Conventional
25% down · 7.5% · 30yr
- Down + closing
- —
- Monthly P&I
- —
- Monthly cashflow
- —
- DSCR
- —
- Eligible?
- —
Personal DTI + credit; lowest rate.
DSCR
20% down · 8.5% · 30yr
- Down + closing
- —
- Monthly P&I
- —
- Monthly cashflow
- —
- DSCR
- —
- Eligible?
- —
No personal income docs; deal must DSCR.
Hard money
10% down · 12.0% · 12mo
- Down + closing
- —
- Monthly P&I
- —
- Monthly cashflow
- —
- DSCR
- —
- Eligible?
- —
Short-term bridge; refi at stabilization.
Rent comps 24 comps
| Address | Beds | Baths | Sqft | Rent | $/sqft | DOM | Units | Dist |
|---|---|---|---|---|---|---|---|---|
| 2901 Park St Columbia, SC | 3.0 | 2.0 | 1288 | $2,750 | $2.14 | 23d | 1 | 0.22mi |
| 98 Riverview Ct Columbia, SC | 3.0 | 2.0 | 1257 | $1,800 | $1.43 | 14d | 1 | 0.33mi |
| 328 Northwood St Columbia, SC | 3.0 | 2.5 | 1461 | $2,395 | $1.64 | 23d | 1 | 0.47mi |
| 2617 River Dr Columbia, SC | 2.0–3.0 | 1.0–2.0 | 1038 | $993 | $0.96 | 14d | 2 | 0.53mi |
| 3638 Falling Springs Rd Columbia, SC | 3.0 | 2.0 | 1080 | $1,332 | $1.23 | 23d | 1 | 0.58mi |
| 168 Canal Place Cir Columbia, SC | 3.0 | 2.5 | 1437 | $2,250 | $1.57 | 23d | 1 | 0.61mi |
| 215 Northwood St Columbia, SC | 3.0 | 2.5 | 1288 | $1,849 | $1.44 | 23d | 1 | 0.62mi |
| 1003 Elmwood Ave Columbia, SC | 1.0–2.0 | 1.0–2.0 | 937 | $1,649 | $1.76 | 11d | 4 | 0.88mi |
| 900 Vista Towers Dr Columbia, SC | 1.0–3.0 | 1.0–2.0 | 1044 | $1,725 | $1.65 | 11d | 20 | 0.96mi |
| 1000 Watermark Pl Columbia, SC | 1.0–2.0 | 1.0–2.0 | 944 | $1,100 | $1.17 | 11d | 14 | 1.08mi |
| 3606 Medical Dr Unit B Columbia, SC | 2.0 | 1.5 | 864 | $1,100 | $1.27 | 23d | 1 | 1.15mi |
| 3900 Bentley Dr Columbia, SC | 1.0–2.0 | 1.0–2.0 | 873 | $1,330 | $1.52 | 11d | 40 | 1.17mi |
| 1100 Skyland Dr Unit R1 Columbia, SC | 2.0 | 2.0 | 1100 | $1,300 | $1.18 | 23d | 1 | 1.21mi |
| 4030 Gonzales Ave Columbia, SC | 2.0 | 2.0 | 840 | $1,375 | $1.64 | 23d | 1 | 1.22mi |
| 1930 Marion St Columbia, SC | 2.0 | 1.0 | 612 | $1,500 | $2.45 | 11d | 31 | 1.23mi |
| 1319 Hendrix St Columbia, SC | 2.0 | 1.0 | 900 | $1,050 | $1.17 | 23d | 1 | 1.27mi |
| 100 Bryton Trce Columbia, SC | 2.0 | 1.0–2.0 | 950 | $1,215 | $1.28 | 21d | 4 | 1.30mi |
| 167 Stoneridge Dr Columbia, SC | 1.0–2.0 | 1.0–2.0 | 900 | $1,071 | $1.19 | 11d | 27 | 1.32mi |
| 3700 West Ave Columbia, SC | 1.0–2.0 | 1.0 | 750 | $850 | $1.13 | 14d | 1 | 1.34mi |
| 521 Pineneedle Rd Columbia, SC | 2.0 | 1.0 | 725 | $1,150 | $1.59 | 23d | 1 | 1.38mi |
| 900 Taylor St #304 Columbia, SC | 2.0 | 2.0 | 950 | $1,850 | $1.95 | 23d | 1 | 1.42mi |
| 3500 Grand St Columbia, SC | 3.0 | 2.0 | 1300 | $2,000 | $1.54 | 14d | 1 | 1.45mi |
| 4501 Bentley Dr Columbia, SC | 1.0–3.0 | 1.0–2.0 | 946 | $1,730 | $1.83 | 11d | 18 | 1.47mi |
| 606 Muller Ave Columbia, SC | 2.0 | 1.0 | 1240 | $1,349 | $1.09 | 11d | 1 | 1.48mi |
Listing history 17 events
-
2026-06-18days on market $224,000 Active 6 DOM
-
2026-06-17days on market $224,000 Active 5 DOM
-
2026-06-16days on market $224,000 Active 4 DOM
-
2026-06-15days on market $224,000 Active 3 DOM
-
2026-06-14days on market $224,000 Active 1 DOM
-
2026-06-01days on market $224,000 Active 137 DOM
-
2026-05-31days on market $224,000 Active 136 DOM
-
2026-05-16price $224,000
-
2026-05-04status Active
-
2026-04-21historical Active - Contingent
-
2026-04-08price $250,000
-
2026-03-20price $269,000
-
2026-01-15$275,000 Active
-
2022-01-20soldstatus $189,900
-
2021-12-15historical
-
2021-12-12$189,900 Active
-
1985-09-01soldstatus $37,000
ⓘ Source: listings_history table (triggers on properties + properties_extension) + one-shot
backfill from property_details.listing_events for pre-trigger history.
Tax reassessment forecast SC · Resets to sale price
- Current annual tax
- $1,563 · $130/mo
- Projected year-2 tax
- $1,563 · $130/mo
- Expected delta
- $0/yr ($0/mo · 0.0%)
ⓘ Screening estimate from a state-policy table — verify with the county assessor before closing.
Climate risk First Street
- Flood 1/10 Low FEMA zone X · 0% chance over 30 yrs
- Wildfire 2/10 Low
- Heat 6/10 Major
Nearby sold comps map
Loading sold comps map…
Walkable amenities ~0.75 mi
Loading nearby amenities…
Taxation est. · year 1
- Rental income
- $22,280
- − Mortgage interest
- −$12,547
- − Property taxes
- −$1,563
- − Insurance
- −$1,120
- − Repairs & maintenance
- −$1,782
- − Management
- −$1,782
- − Depreciation
- −$6,516
- Taxable loss
- −$3,032
- Est. tax savings @ 24.0%
- +$728
- After-tax cash flow
- $1,549/yr
For passive investors: Depreciation is non-cash, so a rental often shows a tax loss while cash-flowing — sheltering income. Rental losses are passive: they offset passive income freely, and up to $25,000/yr can offset ordinary (W-2) income if you actively participate and your MAGI is under $100k (phasing out to $0 by $150k); unused losses carry forward. On sale, claimed depreciation is recaptured at up to 25%, and gains may owe capital-gains tax (a 1031 exchange can defer both). Figures are a year-1 estimate at your 24.0% rate — not tax advice; consult a CPA.
Schools (NCES district)
- District
- Richland 01
- NCES district ID
- 4503360
- Math proficiency
- 26% ▼ -7.00%
- Reading proficiency
- 36% ▼ -5.00%
- Median HH income
- $38,931
- Composite
- 25.94/100
- National rank
- #7335
- State rank
- #54 of 80 in SC
Livability — Columbia
- Score
- 78/100
- State rank
- #18
- US rank
- #2436
Category grades
Schools grade is shown separately in the Schools card above.
Census & demographics
- Census place
- Columbia, SC
- County
- Richland County · 389,530 people
- City population
- 335,994
- Metro
- Columbia, SC
- Population (ZIP)
- 24,605
- Household income
- $32,297
- Rent vs Own
- Severe rent burden
- 3456.0
Population outlook (Richland County) Hauer SSP2
- Today (2025)
- 459,667 people
- By 2030
- 487,524 · +6.1%
- By 2040
- 542,035 · +17.9%
- By 2050
- 595,371 · +29.5%
- By 2075
- 732,998 · +59.5%
- By 2100
- 820,415 · +78.5%
Race, ethnicity, and origin ACS 2023
- Neighborhood character
- Majority White (64%)
- Race & ethnicity
- White 64% Black 24% Hispanic / Latino 4% Asian 4% Two or more races 4%
- Common ancestry
- Italian 2% Lithuanian 2% Serbian 2%
- Foreign-born
- 7% · China, Canada
- Languages at home
- 90% English-only · Spanish 3% Chinese 2% Other Indo-European 2%
Political lean MEDSL · Richland
- 2024 margin
- Solid D (+34.6) · D 66.4% · R 31.8% · Other 1.8%
- 2008→2024 swing
- +5.7pp toward D · 2008: 28.9pp · 2024: 34.6pp
- All cycles
- 2024: D+34.6 2020: D+38.3 2016: D+32.9 2012: D+33.3 2008: D+28.9
Not yet ingested
- Civics
- —
Market trends
- HPI YoY
- ▼ -142.00%
- Current HPI
- 229.8442
- Rent YoY
- ▲ 3.18%
- Metro
- Columbia, SC
- State GDP YoY
- ▲ 4.51%
- F500 in state
- 2
Industry mix (Fortune 500 HQ in SC)
| Industry | F500 HQs | Revenue |
|---|---|---|
| Packaging | 1 | $7B |
|
||
Price history
+505.4% since first listed10 events — show timeline
- 2026-05-16 Price Changed $224,000 Consolidated MLS
- 2026-05-04 Relisted — Consolidated MLS
- 2026-04-21 Contingent — Consolidated MLS
- 2026-04-08 Price Changed $250,000 Consolidated MLS
- 2026-03-20 Price Changed $269,000 Consolidated MLS
- 2026-01-15 Listed $275,000 Consolidated MLS
- 2022-01-20 Sold (Public Records) $189,900 Public Records
- 2021-12-15 Delisted — Consolidated MLS
- 2021-12-12 Listed $189,900 Consolidated MLS
- 1985-09-01 Sold (Public Records) $37,000 Public Records
Property tax history
-3.6%/yrLatest (2025): $1,563 · +3.6% YoY. Source: county tax records.
Cash-flow waterfall
monthlySold comps — $/sqft
last 12 mo · ≤1 miLoading sold comps…