500 W 43rd St Unit 5G · New York, NY
Flood risk 3/10 · Minor
- FEMA flood zone
- X (unshaded)
- Chance of flooding over 30 yrs
- 0.1%
- Est. flood insurance / yr
- $507 – $1,088
Fire risk 1/10 · Minimal
- Est. fire insurance / yr
- $691 – $1,283
Heat risk 7/10 · Major
- Hot days now (above 99°F)
- 7 days/yr
- Hot days in 30 yrs
- 15 days/yr
Wind risk 6/10 · Moderate
- Chance of severe wind over 30 yrs
- 27.0%
Air-quality risk 4/10 · Minor
- Unhealthy air days now
- 5 days/yr
- Unhealthy air days in 30 yrs
- 6 days/yr
Risk factors via First Street. Map © Google.
Why this score? — see what drove the D- grade
The composite is a weighted blend of 9 inputs, each scored 0–100. Each bar is that input's sub-score; the figure is the points it added to the 100-point composite (weight × sub-score).
- Cash flow +7.6/30.0
- ARV discount +7.5/15.0
- Schools +5.0/10.0
- 1% rule +4.2/10.0
- Appreciation +4.0/10.0
- Livability +3.8/5.0
- Rent growth +3.6/5.0
- Condition / age +2.5/5.0
- DSCR +1.7/10.0
$710,000
🖨 Deal sheet 📄 Offer letter ✓ Due diligence
Listing remarks
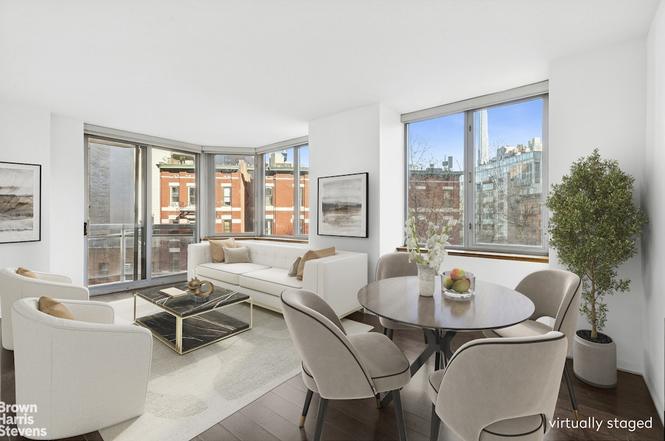
Located in The Strand, a towering diamond-shaped condominium, this one-bedroom, one-bath residence offers expansive North and East facing windows that flood the corner of every room with warm, natural light. The residence also features a private balcony and rich walnut floors. The open living area is enhanced by new solar shades and effortlessly combines relaxation and entertainment, making it the perfect space to unwind or host guests. The kitchen features stainless-steel appliances, ample storage, and a convenient dishwasher. The primary bedroom is a tranquil retreat, featuring blackout shades and spacious closet, ensuring abundant storage space and effortless organization. The bathro
Key facts
- Rich walnut floors
- Blackout shades
- Private balcony
Tags
Property features AI
Finance
- Other: Pets allowed (dogs OK in building)
- Financial info: Building contains 311 total units
- HOA & community: Monthly association fee of $966; Building amenities include sauna and bike storage; Elevator access
Exterior
- Parking: Has garage
- Home design: Condominium in The Strand; 41-story building; Entry on level 5; Zoning: C6-4
- Construction: Sauna and steam room available in building; Indoor pool
- Exterior features: Private balcony; Building roof deck; Private outdoor space under 60 sqft; East and north exposures; Has a view
Interior
- Kitchen: Includes dishwasher
- Bedrooms: Total of 3 rooms (includes bedrooms and living areas)
- Bathrooms: 1 full bathroom
- Interior features: Dishwasher; Building basement (other type)
- Laundry & utility: Building laundry facilities (building other)
Neighborhood map
What this means for you Summary
Snapshot
- This is a 1-bed/1.0-bath condo listed at $710k.
Deal economics
- At list price, monthly cash flow is $-856 ($-10k/yr) — negative.
- To cash-flow at today's rent, offer at most $559k (21.3% below list).
- To meet the 1% rule (rent ≥ 1% of price), the offer needs to be $655k (7.7% below list).
- Recommended offer: $559k (21.3% below list) — sets the bar for cash-flow.
- Cap rate 4.8% vs local median 2.6% in New York — top-decile yield for the area; either an underpriced asset or a hidden risk that comps aren't pricing in. Stress-test before assuming the spread holds.
Location & tenants
- Location reads 75/100 on livability (#268 in NY, #4,188 nationally) — a middle-class / working-renter tenant base. Strengths: amenities A+, commute A+, health & safety A; Watch: crime F, cost of living F.
- Market conditions: Rents rising fast (+4.3%/yr); 181 active listings in the ZIP; 40 comparable units currently listed for rent nearby; rentals leasing fast (median 8d on market — plan ~1-2 weeks tenant-placement turnaround); solid renter incomes; 4,467 units permitted in New York County in 2024 (4,463 in 5+ unit buildings).
- At $6,553/mo this rent would consume 82% of the median local household income ($96k/yr) (locally 3765% of renters already pay >50% of income on rent) — very limited rent-growth headroom before tenants either downsize or default.
Forward outlook
- Local home prices are declining (-2.0%/yr); year-one equity from $5k of loan paydown is wiped out by about $14k of value loss. Plan a longer hold.
- New York County population projected at +21% by 2050 — long-run rental-demand tailwind backs the buy-and-hold thesis.
Negotiation context
- It's been on market 101 days — a 9% lower offer ($646k) is reasonable based on typical stale-listing flexibility.
- 2 sale attempts with the ask held roughly flat each time — persistent listings suggest the price (not the market) is what's stuck; bring a comps-based counter.
- Current owner paid $122k; list at $710k implies a 482% gain — meaningful room to come down on a strong offer.
Risks & watch-outs
- Climate carrying-cost: major wind risk, 27% chance of damaging wind over 30y; extreme-heat days projected 7→15/yr by 2055 (HVAC capex compounding) — expect insurance premiums to compound above CPI over the hold.
Questions for the listing agent
- What do current leases actually rent for vs. the listed asking? Can we see a recent rent roll and the last 12 months of T-12 income?
- It's been on market 101 days. Have you received any prior offers? Is the seller open to a 21% concession, seller financing, or rate buy-down credit?
- What does the HOA fee cover, when was the last increase, and are there any pending special assessments or reserve-fund shortfalls?
- Any open or pending special assessments — roof, HVAC, plumbing, elevator, façade? What's the per-unit balance and payoff schedule, and is the seller paying it off at close or rolling it to the buyer?
- Why hasn't it sold? Are there any deal-killer items the seller is aware of (foundation, flood, title, zoning, code violations)?
- Is there a deadline driving the sale (1031 exchange, divorce, estate, relocation)? That informs how much negotiation room exists.
- Schools are B-rated — typically a magnet for longer-tenancy family renters. What's the average tenant stay here, and is there a school-zone premium baked into asking?
- Crime grade is F in this area — have there been break-ins, vandalism, or insurance claims at this property in the last 3 years? What carrier currently insures it and at what premium?
- The area grade is low — what's the realistic commute time and amenity access for the typical tenant pool here? Any planned neighborhood developments (good or bad) we should know about?
- What's the average days-on-market for RENTAL listings here right now (not sales)? A rising rental-DOM trend means longer vacancies and softer asking-rent achievability than the comps imply.
- What's the recent tenant-quality profile in this submarket — average credit score on applications, eviction rate, late-payment / NSF rate, and stable-employment percentage? A property-management company in the area should have these aggregated.
- How much new apartment / multifamily construction is in the pipeline within 1–3 miles? Heavy new supply (>2% of stock underway) typically softens rents 12–24 months out; light construction supports rent growth.
Investment metrics
- 1% rule
- 0.92% ✗
- Cap rate
- 4.85%
- Cash-on-cash
- -5.17%
- DSCR
- 0.77
- GRM
- 9.0
CMA / ARV
No comps found within radius.
Projected returns pro-forma
-2.0% appreciation · 4.29% rent growth · sell at horizon
- IRR
- -16.6%
- Equity multiple
- 0.35×
- Total profit
- $-129,885
- Equity at exit
- $138,070
- IRR
- -7.3%
- Equity multiple
- 0.41×
- Total profit
- $-116,785
- Equity at exit
- $118,163
Cash invested: $198,800 (down + closing). Projections, not guarantees.
Landlord ↔ Tenant lean methodology
- Overall (CITY)
- 0 Strongly Tenant-Friendly
- State New York
- 15 Strongly Tenant-Friendly · D+10
- County
- — inherits STATE
- City New York
- 0 Strongly Tenant-Friendly · D+34
ZIP-level market 10036
- Home prices YoY
- -0.8%
- Rents YoY
- 4.3%
- Active inventory
- 181
- Price-to-rent
- 9.0×
Monthly cashflow live
- Estimated rent
- $6,553 high interval (Pro) →
- Mortgage (P&I)
- −$3,723
- Tax from tax record
- −$1,048 /mo · $12,575/yr
- Insurance
- −$296
- HOA
- −$966
- Vacancy / Maint / Mgmt
- −$1,376
- Net cashflow
- $-856
Break-even live
UW: 25.0% down · 7.5% · 30yr · 1.5% tax · 5.0% vac · 8.0% maint · 8.0% mgmt
Financing live
Cash to close
- Down payment
- $177,500
- Closing costs
- $21,300
- Reserves months
- —
- Total cash needed
- —
Loan-product check · same deal, 3 products live
Conventional
25% down · 7.5% · 30yr
- Down + closing
- —
- Monthly P&I
- —
- Monthly cashflow
- —
- DSCR
- —
- Eligible?
- —
Personal DTI + credit; lowest rate.
DSCR
20% down · 8.5% · 30yr
- Down + closing
- —
- Monthly P&I
- —
- Monthly cashflow
- —
- DSCR
- —
- Eligible?
- —
No personal income docs; deal must DSCR.
Hard money
10% down · 12.0% · 12mo
- Down + closing
- —
- Monthly P&I
- —
- Monthly cashflow
- —
- DSCR
- —
- Eligible?
- —
Short-term bridge; refi at stabilization.
Rent comps 40 comps
| Address | Beds | Baths | Sqft | Rent | $/sqft | DOM | Units | Dist |
|---|---|---|---|---|---|---|---|---|
| 520 W 43rd St #742 New York, NY | 1.0–2.0 | 1.0–2.0 | 769 | $5,860 | $7.62 | 8d | 2 | 0.04mi |
| 561 10th Ave #2085 New York, NY | 2.0 | 1.0–2.0 | 795 | $6,345 | $7.98 | 8d | 2 | 0.05mi |
| 450 W 42nd St #1693 New York, NY | 2.0 | 1.0–2.0 | 690 | $9,110 | $13.20 | 2d | 3 | 0.09mi |
| 555 10th Ave Unit 1018807P New York, NY | 1.0 | 1.0 | 688 | $9,726 | $14.14 | 22d | 1 | 0.10mi |
| 560 W 43rd St New York, NY | 3.0 | 1.0–2.0 | 769 | $5,265 | $6.84 | 8d | 5 | 0.12mi |
| 605 W 42nd St Unit 1016142P New York, NY | 2.0 | 1.0–2.0 | 720 | $14,542 | $20.18 | 10d | 2 | 0.18mi |
| 622 11th Ave Unit 1402 New York, NY | 2.0 | 1.0 | 715 | $7,600 | $10.63 | 8d | 1 | 0.22mi |
| 635 W 42nd St #1990 New York, NY | 1.0–2.0 | 1.0–2.0 | 750 | $5,680 | $7.57 | 8d | 2 | 0.22mi |
| 754 9th Ave Unit 1017471P New York, NY | 1.0 | 1.0 | 538 | $7,284 | $13.54 | 8d | 1 | 0.48mi |
| 360 W 34th St New York, NY | 2.0 | 1.0–1.5 | 632 | $6,100 | $9.65 | 8d | 3 | 0.48mi |
| 311 W 50th St #228 New York, NY | 2.0 | 1.0–2.0 | 669 | $6,470 | $9.67 | 8d | 3 | 0.52mi |
| 235 W 48th St #1400 New York, NY | 2.0 | 1.0–2.0 | 687 | $6,270 | $9.12 | 8d | 3 | 0.53mi |
| 250 W 50th St New York, NY | 2.0 | 1.0–2.0 | 784 | $5,866 | $7.48 | 8d | 1 | 0.55mi |
| 435 W 31st St New York, NY | 1.0 | 1.0 | 633 | $13,963 | $22.04 | 6d | 27 | 0.56mi |
| 550 W 54th St Unit 1243 New York, NY | 1.0–3.0 | 1.0–2.0 | 913 | $6,270 | $6.86 | 8d | 3 | 0.58mi |
| 500 W 56th St #116 New York, NY | 2.0 | 1.0–2.0 | 680 | $6,190 | $9.10 | 8d | 3 | 0.67mi |
| 525 W 28th St New York, NY | 2.0 | 1.0–2.0 | 1116 | $6,612 | $5.92 | 8d | 1 | 0.69mi |
| 254 W 54th St Unit 1026635P New York, NY | 1.0–2.0 | 1.0–2.0 | 860 | $8,040 | $9.34 | 8d | 2 | 0.71mi |
| 70 W 45th St #1131 New York, NY | 1.0–2.0 | 1.0–2.0 | 902 | $5,990 | $6.64 | 8d | 2 | 0.77mi |
| 243 W 28th St #2143 New York, NY | 1.0 | 1.0 | 580 | $8,960 | $15.45 | 19d | 1 | 0.80mi |
| 244 W 29th St Unit 2149 New York, NY | 1.0 | 1.0 | 490 | $9,720 | $19.84 | 6d | 2 | 0.82mi |
| 18 W 48th St Unit 670 New York, NY | 1.0 | 1.0 | 631 | $7,730 | $12.25 | 8d | 1 | 0.89mi |
| 21 W End Ave New York, NY | 2.0–3.0 | 2.0 | 750 | $8,995 | $11.99 | 25d | 2 | 0.93mi |
| 535 W 23rd St #1584 New York, NY | 2.0 | 1.0–2.0 | 625 | $8,330 | $13.33 | 4d | 3 | 0.94mi |
| 400 W 61st St New York, NY | 4.0 | 1.0–4.0 | 1567 | $15,016 | $9.58 | 1d | 48 | 0.96mi |
| 77 W 55th St Unit 15H New York, NY | 1.0 | 1.0 | 750 | $4,900 | $6.53 | 22d | 1 | 0.98mi |
| 160 Central Park S New York, NY | 1.0–3.0 | 1.0–3.5 | 1550 | $9,250 | $5.97 | 8d | 9 | 1.02mi |
| 160 Central Park S New York, NY | 1.0–3.0 | 1.0–3.5 | 1550 | $7,500 | $4.84 | 8d | 10 | 1.02mi |
| 400 W 63rd St New York, NY | 2.0 | 1.0–2.0 | 874 | $7,477 | $8.55 | 1d | 11 | 1.03mi |
| 160 W 24th St New York, NY | 2.0 | 1.0–2.0 | 731 | $7,896 | $10.79 | 1d | 12 | 1.07mi |
| 43 W 27th St #1055 New York, NY | 2.0 | 1.0 | 740 | $9,940 | $13.43 | 25d | 1 | 1.07mi |
| 309 5th Ave New York, NY | 1.0 | 1.0 | 597 | $7,596 | $12.72 | 8d | 13 | 1.07mi |
| 15 W 55th St #736 New York, NY | 2.0–3.0 | 1.0–2.0 | 1250 | $8,550 | $6.84 | 2d | 2 | 1.08mi |
| 776 6th Ave New York, NY | 2.0 | 1.0–2.0 | 756 | $7,743 | $10.24 | 1d | 18 | 1.09mi |
| 101 W End Ave #950 New York, NY | 1.0–2.0 | 1.0–2.0 | 814 | $6,770 | $8.32 | 1d | 2 | 1.11mi |
| 30 Park Ave #1347 New York, NY | 2.0 | 1.0 | 950 | $7,890 | $8.31 | 2d | 3 | 1.14mi |
| 41 Park Ave New York, NY | 2.0 | 1.0–2.0 | 815 | $6,555 | $8.04 | 8d | 3 | 1.16mi |
| 282 11th Ave New York, NY | 2.0 | 1.0–2.0 | 960 | $7,858 | $8.18 | 1d | 1 | 1.21mi |
| 1500 Harbor Blvd Weehawken, NJ | 2.0 | 1.0–2.0 | 795 | $5,134 | $6.45 | 3d | 13 | 1.22mi |
| 1500 Avenue At Port Imperial Weehawken, NJ | 2.0 | 1.0–2.0 | 886 | $4,015 | $4.53 | 2d | 19 | 1.24mi |
HOA detail condo
- Monthly dues
- $966 · $11,592/yr
- Assessments
- None detected in remarks — confirm with the listing agent.
Listing history 6 events
-
2026-06-18days on market $710,000 Active 101 DOM
-
2026-06-17days on market $710,000 Active 100 DOM
-
2026-06-15days on market $710,000 Active 98 DOM
-
2026-06-13days on market $710,000 Active 96 DOM
-
2026-06-10remarks 699-char remark
-
2026-06-10$710,000 Active 92 DOM
ⓘ Source: listings_history table (triggers on properties + properties_extension) + one-shot
backfill from property_details.listing_events for pre-trigger history.
Tax reassessment forecast NY · Partial reset (capped growth)
- Current annual tax
- $12,575 · $1,048/mo
- Projected year-2 tax
- $12,575 · $1,048/mo
- Expected delta
- $0/yr ($0/mo · 0.0%)
ⓘ Screening estimate from a state-policy table — verify with the county assessor before closing.
Climate risk First Street
- Flood 3/10 Moderate FEMA zone X (unshaded) · 10% chance over 30 yrs
- Wildfire 1/10 Low
- Heat 7/10 Severe 7 d/yr ≥99°F today · 15 d/yr by 30 yrs out
- Wind 6/10 Major 27% chance of damaging wind over 30 yrs
- Air quality 4/10 Moderate 5 unhealthy d/yr today · 6 by 30 yrs out
Nearby sold comps map
Loading sold comps map…
Walkable amenities ~0.75 mi
Loading nearby amenities…
Taxation est. · year 1
- Rental income
- $78,640
- − Mortgage interest
- −$39,771
- − Property taxes
- −$12,575
- − Insurance
- −$3,550
- − Repairs & maintenance
- −$6,291
- − Management
- −$6,291
- − HOA
- −$11,592
- − Depreciation
- −$20,655
- Taxable loss
- −$22,085
- Est. tax savings @ 24.0%
- +$5,300
- After-tax cash flow
- $-4,971/yr
For passive investors: Depreciation is non-cash, so a rental often shows a tax loss while cash-flowing — sheltering income. Rental losses are passive: they offset passive income freely, and up to $25,000/yr can offset ordinary (W-2) income if you actively participate and your MAGI is under $100k (phasing out to $0 by $150k); unused losses carry forward. On sale, claimed depreciation is recaptured at up to 25%, and gains may owe capital-gains tax (a 1031 exchange can defer both). Figures are a year-1 estimate at your 24.0% rate — not tax advice; consult a CPA.
Schools (NCES district)
No district data.
Livability — New York
- Score
- 75/100
- State rank
- #268
- US rank
- #4188
Category grades
Schools grade is shown separately in the Schools card above.
Census & demographics
- Census place
- New York, NY
- County
- New York County · 1,599,927 people
- City population
- 7,731,280
- Metro
- New York-Newark-Jersey City, NY-NJ-PA
- Population (ZIP)
- 31,036
- Household income
- $95,638
- Rent vs Own
- Severe rent burden
- 3765.0
Population outlook (New York County) Hauer SSP2
- Today (2025)
- 1,825,725 people
- By 2030
- 1,904,611 · +4.3%
- By 2040
- 2,052,719 · +12.4%
- By 2050
- 2,206,601 · +20.9%
- By 2075
- 2,509,427 · +37.4%
- By 2100
- 2,702,933 · +48.0%
Race, ethnicity, and origin ACS 2023
- Neighborhood character
- Diverse neighborhood (Simpson 0.68)
- Race & ethnicity
- White 51% Hispanic / Latino 19% Asian 15% Two or more races 15% Black 7%
- Hispanic origin (detail)
- Mexican 2% Puerto Rican 6% Dominican 2%
- Common ancestry
- Romanian 5% Scotch-Irish 4% Lithuanian 2%
- Foreign-born
- 31% · Canada, China, South Korea
- Languages at home
- 63% English-only · Spanish 15% Other Indo-European 6% Chinese 6%
Political lean MEDSL · New York
- 2024 margin
- Solid D (+64.8) · D 82.4% · R 17.6%
- 2008→2024 swing
- -7.4pp toward R · 2008: 72.2pp · 2024: 64.8pp
- All cycles
- 2024: D+64.8 2020: D+74.5 2016: D+77.2 2012: D+69.6 2008: D+72.2
Not yet ingested
- Civics
- —
Market trends
- HPI YoY
- ▼ -2.00%
- Current HPI
- 250.4308
- Rent YoY
- ▲ 4.29%
- Metro
- New York-Newark-Jersey City, NY-NJ-PA
- State GDP YoY
- ▲ 2.60%
- F500 in state
- 92
Industry mix (Fortune 500 HQ in NY)
| Industry | F500 HQs | Revenue |
|---|---|---|
| Financial Services | 10 | $950B |
|
||
| Consumer Goods | 9 | $162B |
|
||
| Insurance | 4 | $225B |
|
||
| Telecommunications | 2 | $144B |
|
||
| Pharmaceuticals | 2 | $112B |
|
||
| Media / Entertainment | 2 | $69B |
|
||
Price history
+482.0% since first listed3 events — show timeline
- 2026-06-09 Relisted — RLS at REBNY
- 2026-01-26 Listed $710,000 RLS at REBNY
- 1993-05-07 Sold (Public Records) $122,000 Public Records
Property tax history
+3.2%/yrLatest (2025): $12,575 · +1.7% YoY. Source: county tax records.
Cash-flow waterfall
monthlySold comps — $/sqft
last 12 mo · ≤1 miLoading sold comps…