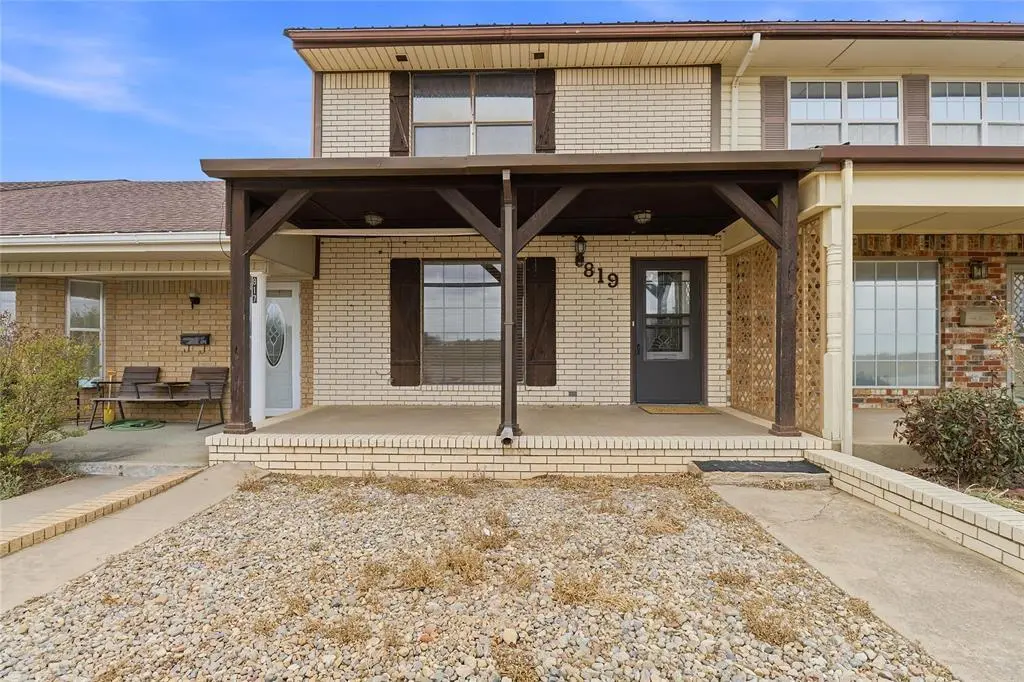
819 N Broadway Ave · Hobart, OK
Flood risk 1/10 · Minimal
- FEMA flood zone
- X (unshaded)
- Chance of flooding over 30 yrs
- 0.0%
- Est. flood insurance / yr
- $507 – $1,088
Fire risk 1/10 · Minimal
- Est. fire insurance / yr
- $2,463 – $4,575
Heat risk 6/10 · Moderate
- Hot days now (above 107°F)
- 7 days/yr
- Hot days in 30 yrs
- 20 days/yr
Wind risk 2/10 · Minimal
- Chance of severe wind over 30 yrs
- 4.0%
Air-quality risk 1/10 · Minimal
- Unhealthy air days now
- 0 days/yr
- Unhealthy air days in 30 yrs
- 0 days/yr
Risk factors via First Street. Map © Google.
Why this score? — see what drove the D grade
The composite is a weighted blend of 9 inputs, each scored 0–100. Each bar is that input's sub-score; the figure is the points it added to the 100-point composite (weight × sub-score).
- Cash flow +15.8/30.0
- Appreciation +10.0/10.0
- DSCR +4.9/10.0
- 1% rule +3.7/10.0
- Livability +2.7/5.0
- Rent growth +2.5/5.0
- Condition / age +2.5/5.0
- Schools +2.1/10.0
- ARV discount +0.0/15.0
$152,000
🖨 Deal sheet 📄 Offer letter ✓ Due diligence
Listing remarks
Spacious 2-Story Townhome on 0.98 Acres – Hobart, OK Welcome to 819 N Broadway Ave, a rare opportunity to own a spacious 2-story townhome situated on an impressive 0.98-acre lot in Hobart! Priced at 162,000, this property offers the perfect blend of space, comfort, and value. Boasting 2,299 square feet, this home features 3 bedrooms and 3 bathrooms, providing plenty of room for families, guests, or even a home office setup. The layout offers generous living spaces with great flow, ideal for both everyday living and entertaining. Upstairs includes a versatile bonus room , perfect for additional living space, a game room, or office. Downstairs, you’ll find a convenient half ba
Key facts
- Fenced in back patio
- Oversized lot
- 0.98 acre lot
Tags
Property features AI
Finance
- Other: Property listed as active; New listing; Model home: No; Living area reported as 2,204 (assessor); Directions: From W Iris Ave and S Broadway St go North and property is located on the E side of the Rd.
- Financial info: Loan qualification: Yes; Assumable: Unknown
- HOA & community: No mandatory association dues
Exterior
- Parking: 1-car garage
- Security:
- Utilities:
- Home design: Single family residence; Two-level property; Residential property; Entry built status: Existing; Homestead exempt
- Construction: Brick and frame construction; Composition roof; Slab foundation
- Exterior features: Interior lot; No exterior features listed
Interior
- Kitchen:
- Bedrooms: 3 bedrooms
- Flooring:
- Bathrooms: 3 full bathrooms
- Heating & cooling: Electric heating
- Interior features: One living area; Occupied
- Laundry & utility:
Neighborhood map
What this means for you Summary
Snapshot
- This is a 3-bed/3.0-bath single-family listed at $152k.
Deal economics
- At list price, monthly cash flow is $68 ($821/yr) — positive.
- The deal already cash-flows at list — no discount required.
- To meet the 1% rule (rent ≥ 1% of price), the offer needs to be $133k (12.8% below list).
- Recommended offer: $133k (12.8% below list) — sets the bar for 1% rule.
Location & tenants
- Location reads 53/100 on livability (#627 in OK) — a working-class tenant base; expect higher turnover. Strengths: cost of living A+; Watch: crime D+, amenities F, commute F.
- Hobart (town): math 23% / reading 28% proficiency, ranked #110 of 270 in OK (top 41%) — low school quality limits family demand, transient renter base, plan for 1-2y turnover; 63% free/reduced lunch — lower-income household profile, screen leases tightly.
- Zoned schools: Hobart Es (math 32% / reading 27%, grade F, #255 of 845 statewide, top 35%, 366 students, 0% FRL); Hobart Hs (math 5% / reading 24%, grade F, #332 of 447 statewide, top 78%, 197 students, 0% FRL) — zoned schools average 0% FRL vs 63% district-wide (63 pts lower); this property's tenant base skews higher-income than the district average.
- Market conditions: 52 active listings in the ZIP.
Forward outlook
- In year one you build about $16k of equity ($1k loan paydown + $15k appreciation (10.0% local appreciation)).
- At projected returns (10.0% appreciation + 3.0% rent growth), your $43k cash investment doubles in ~3 years — after that, you're playing with house money.
- By year 3, paydown + projected appreciation supports a ~$41k cash-out refi (75% LTV) — recoverable capital for the next deal without selling this one.
Negotiation context
- It's been on market 82 days — a 6% lower offer ($143k) is reasonable based on typical stale-listing flexibility.
- 2 sale attempts; this cycle's ask has dropped $10k (6%) from the opening price — seller is motivated, your offer sets the floor, not the list.
- Current owner paid $117k; 30% above their basis — modest negotiation headroom, anchor on the comps not their cost.
Risks & watch-outs
- Climate carrying-cost: extreme-heat days projected 7→20/yr by 2055 (HVAC capex compounding) — expect insurance premiums to compound above CPI over the hold.
Questions for the listing agent
- It's been on market 82 days. Have you received any prior offers? Is the seller open to a 13% concession, seller financing, or rate buy-down credit?
- Why hasn't it sold? Are there any deal-killer items the seller is aware of (foundation, flood, title, zoning, code violations)?
- Is there a deadline driving the sale (1031 exchange, divorce, estate, relocation)? That informs how much negotiation room exists.
- Schools are F-rated, which usually means shorter tenancies and higher turnover. Who's the typical renter profile here, and what's been the actual vacancy rate?
- Crime grade is D in this area — have there been break-ins, vandalism, or insurance claims at this property in the last 3 years? What carrier currently insures it and at what premium?
- The area grade is low — what's the realistic commute time and amenity access for the typical tenant pool here? Any planned neighborhood developments (good or bad) we should know about?
- What's the average days-on-market for RENTAL listings here right now (not sales)? A rising rental-DOM trend means longer vacancies and softer asking-rent achievability than the comps imply.
- What's the recent tenant-quality profile in this submarket — average credit score on applications, eviction rate, late-payment / NSF rate, and stable-employment percentage? A property-management company in the area should have these aggregated.
- How much new for-sale + rental construction is in the pipeline within 1–3 miles? Heavy new supply typically softens prices + rents 12–24 months out; constrained supply supports both.
Investment metrics
- 1% rule
- 0.87% ✗
- Cap rate
- 6.83%
- Cash-on-cash
- 1.93%
- DSCR
- 1.09
- GRM
- 9.6
CMA / ARV
- ARV (on-the-fly)
- $130,036
- Comps found
- 6
Show comp detail 6 sales within ~0.75 mi
| Address | Dist | Beds/Ba | Sqft | Sold | Price | $/sf | Match |
|---|---|---|---|---|---|---|---|
| 111 E Hillcrest Ln | 0.18mi | 4/2.0 (+1) | 2,226 (+1%) | 14mo | $130,000 | $58 | 69 |
| 204 E Hillcrest Rd | 0.32mi | 4/2.0 (+1) | 2,200 (-0%) | 9mo | $159,900 | $73 | 69 |
| 601 N Broadway St | 0.27mi | 3/2.0 | 1,924 (-13%) | 7mo | $58,000 | $30 | 56 |
| 505 N Hitchcock St | 0.45mi | 4/2.0 (+1) | 1,923 (-13%) | 12mo | $165,000 | $86 | 39 |
| 430 N Stephens St | 0.55mi | 3/2.5 | 2,438 (+11%) | 24mo | $144,000 | $59 | 35 |
| 305 N Broadway St | 0.52mi | 4/1.0 (+1) | 1,960 (-11%) | 13mo | $50,000 | $26 | 34 |
Match score weights: distance 35% · size 25% · config 20% · recency 20%. Top-matched comps best support the ARV.
Projected returns pro-forma
10.0% appreciation · 3.0% rent growth · sell at horizon
- IRR
- 25.7%
- Equity multiple
- 3.05×
- Total profit
- $87,118
- Equity at exit
- $136,934
- IRR
- 22.6%
- Equity multiple
- 6.95×
- Total profit
- $253,074
- Equity at exit
- $295,303
Cash invested: $42,560 (down + closing). Projections, not guarantees.
Landlord ↔ Tenant lean methodology
- Overall (STATE)
- 83 Strongly Landlord-Friendly
- State Oklahoma
- 83 Strongly Landlord-Friendly · R+20
- County
- — inherits STATE
- City
- — inherits STATE
ZIP-level market 73651
- Home prices YoY
- 8.0%
- Active inventory
- 52
- Price-to-rent
- 9.6×
Monthly cashflow live
- Estimated rent
- $1,326 medium interval (Pro) →
- Mortgage (P&I)
- −$797
- Tax from tax record
- −$119 /mo · $1,423/yr
- Insurance
- −$63
- HOA
- −$0
- Vacancy / Maint / Mgmt
- −$278
- Net cashflow
- $68
Break-even live
UW: 25.0% down · 7.5% · 30yr · 1.5% tax · 5.0% vac · 8.0% maint · 8.0% mgmt
Financing live
Cash to close
- Down payment
- $38,000
- Closing costs
- $4,560
- Reserves months
- —
- Total cash needed
- —
Loan-product check · same deal, 3 products live
Conventional
25% down · 7.5% · 30yr
- Down + closing
- —
- Monthly P&I
- —
- Monthly cashflow
- —
- DSCR
- —
- Eligible?
- —
Personal DTI + credit; lowest rate.
DSCR
20% down · 8.5% · 30yr
- Down + closing
- —
- Monthly P&I
- —
- Monthly cashflow
- —
- DSCR
- —
- Eligible?
- —
No personal income docs; deal must DSCR.
Hard money
10% down · 12.0% · 12mo
- Down + closing
- —
- Monthly P&I
- —
- Monthly cashflow
- —
- DSCR
- —
- Eligible?
- —
Short-term bridge; refi at stabilization.
Listing history 22 events
-
2026-06-18days on market $152,000 Active 82 DOM
-
2026-06-17days on market $152,000 Active 81 DOM
-
2026-06-16days on market $152,000 Active 80 DOM
-
2026-06-15days on market $152,000 Active 79 DOM
-
2026-06-13days on market $152,000 Active 77 DOM
-
2026-06-12days on market $152,000 Active 76 DOM
-
2026-06-09pricedays on market $152,000 Active 73 DOM
-
2026-06-08days on market $162,000 Active 72 DOM
-
2026-06-08days on market $162,000 Active 71 DOM
-
2026-06-05days on market $162,000 Active 69 DOM
-
2026-06-04days on market $162,000 Active 67 DOM
-
2026-06-02days on market $162,000 Active 66 DOM
-
2026-06-01days on market $162,000 Active 65 DOM
-
2026-05-31days on market $162,000 Active 64 DOM
-
2026-03-28$162,000 Active
-
2025-08-14historical
-
2025-05-12price $159,000
-
2025-02-14$169,500 Active
-
2022-02-10soldstatus $117,000
-
2020-02-05soldstatus $82,000
-
2017-09-01soldstatus $70,000
-
1997-08-26soldstatus $68,000
ⓘ Source: listings_history table (triggers on properties + properties_extension) + one-shot
backfill from property_details.listing_events for pre-trigger history.
Tax reassessment forecast OK · Resets to sale price
- Current annual tax
- $1,423 · $119/mo
- Projected year-2 tax
- $1,423 · $119/mo
- Expected delta
- $0/yr ($0/mo · 0.0%)
ⓘ Screening estimate from a state-policy table — verify with the county assessor before closing.
Climate risk First Street
- Flood 1/10 Low FEMA zone X (unshaded) · 0% chance over 30 yrs
- Wildfire 1/10 Low
- Heat 6/10 Major 7 d/yr ≥107°F today · 20 d/yr by 30 yrs out
- Wind 2/10 Low 4% chance of damaging wind over 30 yrs
- Air quality 1/10 Low 0 unhealthy d/yr today · 0 by 30 yrs out
Nearby sold comps map
Loading sold comps map…
Walkable amenities ~0.75 mi
Loading nearby amenities…
Taxation est. · year 1
- Rental income
- $15,911
- − Mortgage interest
- −$8,514
- − Property taxes
- −$1,423
- − Insurance
- −$760
- − Repairs & maintenance
- −$1,273
- − Management
- −$1,273
- − Depreciation
- −$4,422
- Taxable loss
- −$1,754
- Est. tax savings @ 24.0%
- +$421
- After-tax cash flow
- $1,242/yr
For passive investors: Depreciation is non-cash, so a rental often shows a tax loss while cash-flowing — sheltering income. Rental losses are passive: they offset passive income freely, and up to $25,000/yr can offset ordinary (W-2) income if you actively participate and your MAGI is under $100k (phasing out to $0 by $150k); unused losses carry forward. On sale, claimed depreciation is recaptured at up to 25%, and gains may owe capital-gains tax (a 1031 exchange can defer both). Figures are a year-1 estimate at your 24.0% rate — not tax advice; consult a CPA.
Schools (NCES district)
- District
- Hobart
- NCES district ID
- 4014700
- Math proficiency
- 23% ▼ -6.00%
- Reading proficiency
- 28% ▼ -8.00%
- Median HH income
- $36,779
- Composite
- 21.2/100
- National rank
- #8417
- State rank
- #110 of 270 in OK
Livability — Hobart
- Score
- 53/100
- State rank
- #627
- US rank
- #24677
Category grades
Schools grade is shown separately in the Schools card above.
Census & demographics
- Census place
- Hobart, OK
- City population
- 4,070
- Population (ZIP)
- 4,070
Population outlook (Kiowa County) Hauer SSP2
- Today (2025)
- 8,842 people
- By 2030
- 8,733 · -1.2%
- By 2040
- 8,641 · -2.3%
- By 2050
- 8,758 · -1.0%
- By 2075
- 9,894 · +11.9%
- By 2100
- 11,194 · +26.6%
Race, ethnicity, and origin ACS 2023
- Neighborhood character
- Predominantly White (72%)
- Race & ethnicity
- White 72% Hispanic / Latino 15% Two or more races 10% Black 4% Native American 2%
- Hispanic origin (detail)
- Mexican 13%
- Common ancestry
- Iranian 8% Italian 2% Slovak 1%
- Foreign-born
- 1% · Canada
- Languages at home
- 90% English-only · Spanish 10%
Political lean MEDSL · Kiowa
- 2024 margin
- Solid R (+58.3) · D 20.1% · R 78.4% · Other 1.6%
- 2008→2024 swing
- -23.5pp toward R · 2008: -34.8pp · 2024: -58.3pp
- All cycles
- 2024: R+58.3 2020: R+57.6 2016: R+52.4 2012: R+35.4 2008: R+34.8
Not yet ingested
- Civics
- —
Market trends
- HPI YoY
- ▲ 11.68%
- Current HPI
- 158.6311
- Rent YoY
- —
- Metro
- —
- State GDP YoY
- ▲ 1.55%
- F500 in state
- 6
Industry mix (Fortune 500 HQ in OK)
| Industry | F500 HQs | Revenue |
|---|---|---|
| Energy | 3 | $48B |
|
||
Price history
+138.2% since first listed8 events — show timeline
- 2026-03-28 Listed $162,000 MLSOK
- 2025-08-14 Listing Removed — MLSOK
- 2025-05-12 Price Changed $159,000 MLSOK
- 2025-02-14 Listed $169,500 MLSOK
- 2022-02-10 Sold (Public Records) $117,000 Public Records
- 2020-02-05 Sold (Public Records) $82,000 Public Records
- 2017-09-01 Sold (Public Records) $70,000 Public Records
- 1997-08-26 Sold (Public Records) $68,000 Public Records
Property tax history
+6.9%/yrLatest (2025): $1,423 · +5.3% YoY. Source: county tax records.
Cash-flow waterfall
monthlySold comps — $/sqft
last 12 mo · ≤1 miLoading sold comps…