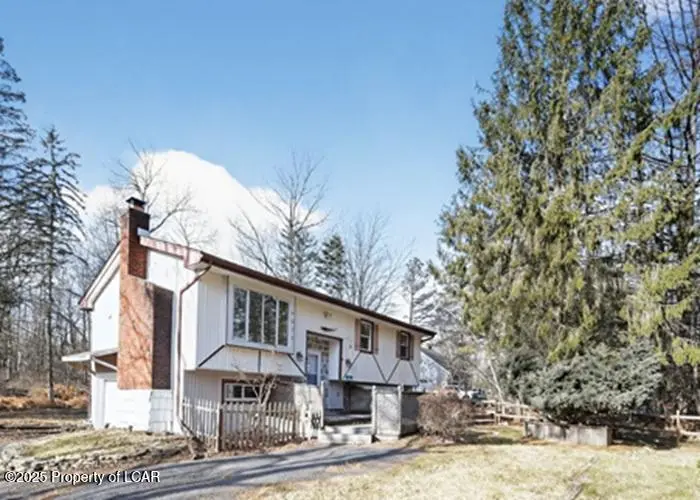
276 Ash Dr · Tobyhanna, PA
Flood risk 4/10 · Minor
- FEMA flood zone
- X (unshaded)
- Chance of flooding over 30 yrs
- 0.24%
- Est. flood insurance / yr
- $473 – $860
Fire risk 3/10 · Minor
- Est. fire insurance / yr
- $511 – $949
Heat risk 2/10 · Minimal
- Hot days now (above 90°F)
- 7 days/yr
- Hot days in 30 yrs
- 15 days/yr
Wind risk 4/10 · Minor
- Chance of severe wind over 30 yrs
- 7.0%
Air-quality risk 2/10 · Minimal
- Unhealthy air days now
- 1 days/yr
- Unhealthy air days in 30 yrs
- 2 days/yr
Risk factors via First Street. Map © Google.
Why this score? — see what drove the C- grade
The composite is a weighted blend of 9 inputs, each scored 0–100. Each bar is that input's sub-score; the figure is the points it added to the 100-point composite (weight × sub-score).
- Cash flow +15.3/30.0
- ARV discount +14.4/15.0
- DSCR +4.7/10.0
- 1% rule +4.6/10.0
- Appreciation +4.5/10.0
- Schools +4.0/10.0
- Rent growth +2.5/5.0
- Livability +2.5/5.0
- Condition / age +2.5/5.0
$243,800
🖨 Deal sheet (PDF) 📄 Offer letter ✓ Due diligence
Listing remarks MLS
This nice bi-level home is located in amenity filled Emerald Lakes and features 3 bedrooms, 1 bath, living room with wood burning fireplace and some hardwood floors. Built in 1976 this home is a short drive to ski slopes, shopping, dining and more.
Key facts
- Hardwood floors
- 0.45 acre lot
- Garage
Tags
Neighborhood map
What this means for you Summary
Snapshot
- This is a 3-bed/1.0-bath single-family listed at $244k.
Deal economics
- At list price, monthly cash flow is $88 ($1k/yr) — positive.
- The deal already cash-flows at list — no discount required.
- To meet the 1% rule (rent ≥ 1% of price), the offer needs to be $233k (4.4% below list).
- Recommended offer: $222k (9.0% below list) — sets the bar for market timing.
Location & tenants
- Location reads: area grade C — affects rentability + tenant quality, not the cash-flow math above.
- Pocono Mountain SD (rural): math 37% / reading 55% proficiency, ranked #245 of 539 in PA (top 46%) — families likely to look elsewhere, expect single-tenant / working-renter base with shorter leases.
- Market conditions: 108 active listings in the ZIP; 278 units permitted in Monroe County in 2024 (52 in 5+ unit buildings).
Forward outlook
- Local home prices are declining (-0.9%/yr); year-one equity from $2k of loan paydown is wiped out by about $2k of value loss. Plan a longer hold.
- Monroe County population projected at -11% by 2050 — secular population decline; favor cash flow + early exit over multi-decade hold.
Negotiation context
- It's been on market 110 days — a 9% lower offer ($222k) is reasonable based on typical stale-listing flexibility.
- Current owner paid $200k; 22% above their basis — modest negotiation headroom, anchor on the comps not their cost.
Questions for the listing agent
- It's been on market 110 days. Have you received any prior offers? Is the seller open to a 9% concession, seller financing, or rate buy-down credit?
- Built in 1976 — when were the roof, HVAC, electrical panel, plumbing, and water heater last replaced?
- What does the HOA fee cover, when was the last increase, and are there any pending special assessments or reserve-fund shortfalls?
- Why hasn't it sold? Are there any deal-killer items the seller is aware of (foundation, flood, title, zoning, code violations)?
- Is there a deadline driving the sale (1031 exchange, divorce, estate, relocation)? That informs how much negotiation room exists.
- What's the average days-on-market for RENTAL listings here right now (not sales)? A rising rental-DOM trend means longer vacancies and softer asking-rent achievability than the comps imply.
- What's the recent tenant-quality profile in this submarket — average credit score on applications, eviction rate, late-payment / NSF rate, and stable-employment percentage? A property-management company in the area should have these aggregated.
- How much new for-sale + rental construction is in the pipeline within 1–3 miles? Heavy new supply typically softens prices + rents 12–24 months out; constrained supply supports both.
Investment metrics
- 1% rule
- 0.96% ✗
- Cap rate
- 6.73%
- Cash-on-cash
- 1.54%
- DSCR
- 1.07
- GRM
- 8.7
CMA / ARV
- ARV (median comp)
- $288,239
- List price
- $243,800
- Delta
- -15.42%
- Verdict
- UNDERPRICED
- Comps
- 20 within 1.0 mi
Show comp detail 12 sales within ~0.75 mi
| Address | Dist | Beds/Ba | Sqft | Sold | Price | $/sf | Match |
|---|---|---|---|---|---|---|---|
| 428 Cedar Dr | 0.25mi | 2/2.0 (-1) | 1,094 (-1%) | 2mo | $292,500 | $267 | 76 |
| 594 Sullivan Trl | 0.36mi | 3/1.5 | 1,176 (+6%) | 8mo | $255,000 | $217 | 64 |
| 300 Cedar Dr | 0.41mi | 3/2.0 | 1,156 (+5%) | 10mo | $401,000 | $347 | 61 |
| 208 Ash Dr | 0.28mi | 3/1.0 | 1,152 (+4%) | 23mo | $240,000 | $208 | 61 |
| 2248 Doe Dr | 0.23mi | 3/2.0 | 960 (-13%) | 14mo | $218,000 | $227 | 52 |
| 3307 Black Cherry Ct | 0.59mi | 3/1.0 | 1,008 (-9%) | 8mo | $85,000 | $84 | 51 |
| 317 Clearview Dr | 0.30mi | 3/1.5 | 1,200 (+9%) | 23mo | $273,000 | $228 | 51 |
| 636 Sullivan Trl | 0.33mi | 3/2.0 | 1,008 (-9%) | 20mo | $210,000 | $208 | 50 |
| 1043 Cricket Ln | 0.48mi | 3/1.0 | 1,008 (-9%) | 20mo | $270,000 | $268 | 47 |
| 640 Sullivan Trl | 0.36mi | 3/2.0 | 1,257 (+14%) | 20mo | $292,500 | $233 | 39 |
| 2419 Grey Birch Ln | 0.75mi | 3/1.0 | 1,248 (+13%) | 7mo | $211,000 | $169 | 37 |
| 915 Cricket Ln | 0.59mi | 2/1.0 (-1) | 1,260 (+14%) | 12mo | $250,000 | $198 | 34 |
Match score weights: distance 35% · size 25% · config 20% · recency 20%. Top-matched comps best support the ARV.
Projected returns pro-forma
-0.95% appreciation · 3.0% rent growth · sell at horizon
- IRR
- -4.0%
- Equity multiple
- 0.82×
- Total profit
- $-12,110
- Equity at exit
- $59,461
- IRR
- 2.7%
- Equity multiple
- 1.26×
- Total profit
- $17,425
- Equity at exit
- $62,960
Cash invested: $68,264 (down + closing). Projections, not guarantees.
Landlord ↔ Tenant lean methodology
- Overall (STATE)
- 62 Landlord-Friendly
- State Pennsylvania
- 62 Landlord-Friendly · EVEN
- County
- — inherits STATE
- City
- — inherits STATE
ZIP-level market 18334
- Home prices YoY
- -0.5%
- Active inventory
- 108
- Price-to-rent
- 8.7×
Monthly cashflow live
- Estimated rent
- $2,331 medium interval (Pro) →
- Mortgage (P&I)
- −$1,279
- Tax from tax record
- −$273 /mo · $3,281/yr
- Insurance
- −$102
- HOA
- −$100
- Vacancy / Maint / Mgmt
- −$489
- Net cashflow
- $88
Break-even live
Sensitivity live
| Price | -10% $226 | -5% $157 | +0% $88 | +5% $19 | +10% $-50 |
|---|---|---|---|---|---|
| Rent | -10% $-96 | -5% $-4 | +0% $88 | +5% $180 | +10% $272 |
| Rate | -1.0pp $211 | -0.5pp $150 | base $88 | +0.5pp $25 | +1.0pp $-40 |
UW: 25.0% down · 7.5% · 30yr · 1.5% tax · 5.0% vac · 8.0% maint · 8.0% mgmt
Financing live
Cash to close
- Down payment
- $60,950
- Closing costs
- $7,314
- Reserves months
- —
- Total cash needed
- —
Loan-product check · same deal, 3 products live
Conventional
25% down · 7.5% · 30yr
- Down + closing
- —
- Monthly P&I
- —
- Monthly cashflow
- —
- DSCR
- —
- Eligible?
- —
Personal DTI + credit; lowest rate.
DSCR
20% down · 8.5% · 30yr
- Down + closing
- —
- Monthly P&I
- —
- Monthly cashflow
- —
- DSCR
- —
- Eligible?
- —
No personal income docs; deal must DSCR.
Hard money
10% down · 12.0% · 12mo
- Down + closing
- —
- Monthly P&I
- —
- Monthly cashflow
- —
- DSCR
- —
- Eligible?
- —
Short-term bridge; refi at stabilization.
HOA detail
- Monthly dues
- $100 · $1,200/yr
Listing history 18 events
-
2026-06-21days on market $243,800 Active 110 DOM
-
2026-06-18days on market $243,800 Active 107 DOM
-
2026-06-17days on market $243,800 Active 106 DOM
-
2026-06-16days on market $243,800 Active 105 DOM
-
2026-06-15days on market $243,800 Active 104 DOM
-
2026-06-14days on market $243,800 Active 102 DOM
-
2026-06-13days on market $243,800 Active 101 DOM
-
2026-06-10days on market $243,800 Active 99 DOM
-
2026-06-08days on market $243,800 Active 97 DOM
-
2026-06-07days on market $243,800 Active 96 DOM
-
2026-06-02days on market $243,800 Active 91 DOM
-
2026-06-01days on market $243,800 Active 90 DOM
-
2026-05-31days on market $243,800 Active 89 DOM
-
2026-05-30days on market $243,800 Active 88 DOM
-
2026-03-02$243,800 Active 248-char remark
Show marketing remark (248 chars)
This nice bi-level home is located in amenity filled Emerald Lakes and features 3 bedrooms, 1 bath, living room with wood burning fireplace and some hardwood floors. Built in 1976 this home is a short drive to ski slopes, shopping, dining and more.
-
2007-01-05soldstatus $200,000
-
1992-08-31soldstatus $76,900
-
1988-09-06soldstatus $78,000
ⓘ Source: listings_history table (triggers on properties + properties_extension) + one-shot
backfill from property_details.listing_events for pre-trigger history.
Tax reassessment forecast PA · Partial reset (capped growth)
- Current annual tax
- $3,281 · $273/mo
- Projected year-2 tax
- $3,566 · $297/mo
- Expected delta
- +$286/yr (+$24/mo · 8.7%)
ⓘ Screening estimate from a state-policy table — verify with the county assessor before closing.
Climate risk First Street
- Flood 4/10 Moderate FEMA zone X (unshaded) · 24% chance over 30 yrs
- Wildfire 3/10 Moderate
- Heat 2/10 Low 7 d/yr ≥90°F today · 15 d/yr by 30 yrs out
- Wind 4/10 Moderate 7% chance of damaging wind over 30 yrs
- Air quality 2/10 Low 1 unhealthy d/yr today · 2 by 30 yrs out
Nearby sold comps map
Loading sold comps map…
Walkable amenities ~0.75 mi
Loading nearby amenities…
Taxation est. · year 1
- Rental income
- $27,970
- − Mortgage interest
- −$13,657
- − Property taxes
- −$3,281
- − Insurance
- −$1,219
- − Repairs & maintenance
- −$2,238
- − Management
- −$2,238
- − HOA
- −$1,200
- − Depreciation
- −$7,092
- Taxable loss
- −$2,954
- Est. tax savings @ 24.0%
- +$709
- After-tax cash flow
- $1,763/yr
For passive investors: Depreciation is non-cash, so a rental often shows a tax loss while cash-flowing — sheltering income. Rental losses are passive: they offset passive income freely, and up to $25,000/yr can offset ordinary (W-2) income if you actively participate and your MAGI is under $100k (phasing out to $0 by $150k); unused losses carry forward. On sale, claimed depreciation is recaptured at up to 25%, and gains may owe capital-gains tax (a 1031 exchange can defer both). Figures are a year-1 estimate at your 24.0% rate — not tax advice; consult a CPA.
Schools (NCES district)
- District
- Pocono Mountain SD
- NCES district ID
- 4219500
- Math proficiency
- 37% ▼ -5.00%
- Reading proficiency
- 55% ▲ 1.00%
- Median HH income
- $55,317
- Composite
- 39.91/100
- National rank
- #3856
- State rank
- #245 of 539 in PA
Livability — Tobyhanna
No livability data for this city. (Only ~50 U.S. cities are tracked.)
Census & demographics
- Census place
- Emerald Lakes, PA
- Population (ZIP)
- 4,907
Population outlook (Monroe County) Hauer SSP2
- Today (2025)
- 164,099 people
- By 2030
- 161,412 · -1.6%
- By 2040
- 154,616 · -5.8%
- By 2050
- 146,710 · -10.6%
- By 2075
- 140,830 · -14.2%
- By 2100
- 138,472 · -15.6%
Race, ethnicity, and origin ACS 2023
- Neighborhood character
- Majority White (64%)
- Race & ethnicity
- White 64% Hispanic / Latino 20% Two or more races 12% Black 9%
- Hispanic origin (detail)
- Puerto Rican 17%
- Common ancestry
- Romanian 6% Lithuanian 4% Iranian 4%
- Foreign-born
- 8% · Canada
- Languages at home
- 87% English-only · Spanish 10% Russian/Polish/Slavic 3%
Political lean MEDSL · Monroe
- 2024 margin
- Toss-up / Even · D 49.1% · R 49.9%
- 2008→2024 swing
- -17.1pp toward R · 2008: 16.3pp · 2024: -0.8pp
- All cycles
- 2024: R+0.8 2020: D+6.4 2016: D+0.3 2012: D+14.0 2008: D+16.3
Not yet ingested
- Civics
- —
Market trends
- HPI YoY
- ▼ -0.95%
- Current HPI
- 178.5307
- Rent YoY
- —
- Metro
- —
- State GDP YoY
- ▲ 1.68%
- F500 in state
- 34
Industry mix (Fortune 500 HQ in PA)
| Industry | F500 HQs | Revenue |
|---|---|---|
| Healthcare | 2 | $309B |
|
||
| Insurance | 2 | $27B |
|
||
| Telecommunications / Media | 1 | $124B |
|
||
| Industrial Distribution | 1 | $22B |
|
||
| Financial Services | 1 | $20B |
|
||
| Chemicals / Materials | 1 | $18B |
|
||
Price history
+212.6% since first listed4 events — show timeline
- 2026-03-02 Listed $243,800 LCAR
- 2007-01-05 Sold (Public Records) $200,000 Public Records
- 1992-08-31 Sold (Public Records) $76,900 Public Records
- 1988-09-06 Sold (Public Records) $78,000 Public Records
Property tax history
-0.2%/yrLatest (2026): $3,281 · +3.3% YoY. Source: county tax records.
Cash-flow waterfall
monthlySold comps — $/sqft
last 12 mo · ≤1 miLoading sold comps…