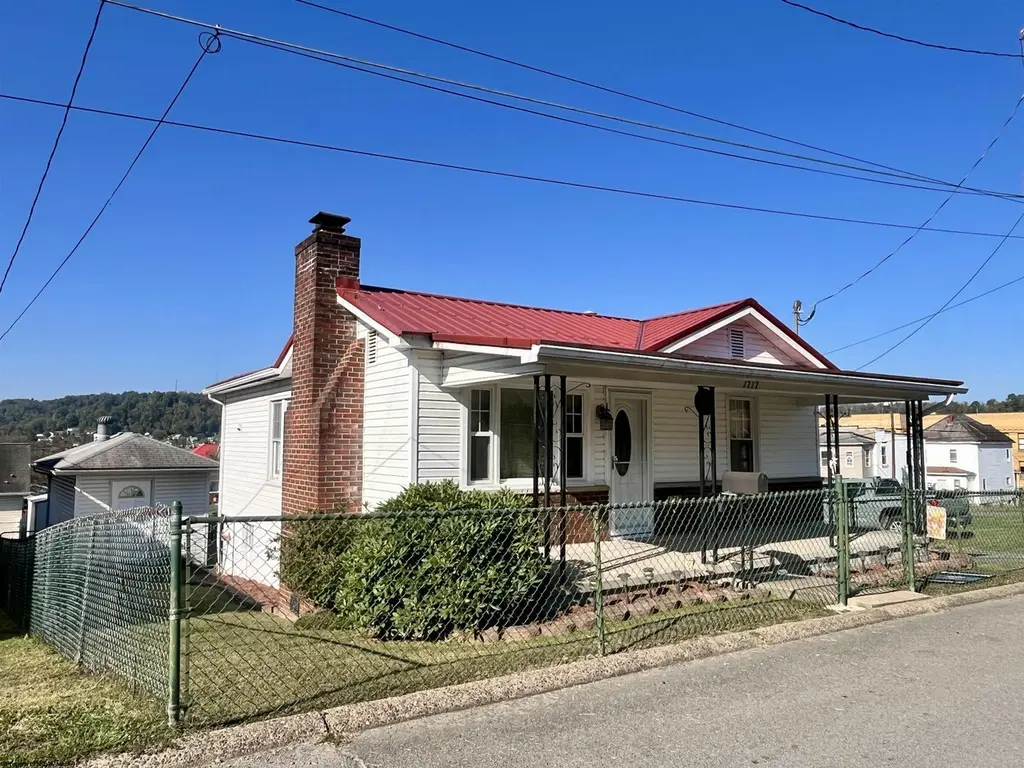
1717 Gould Ave · Clarksburg, WV
Flood risk 1/10 · Minimal
- FEMA flood zone
- X (unshaded)
- Chance of flooding over 30 yrs
- 0.0%
- Est. flood insurance / yr
- $473 – $860
Fire risk 1/10 · Minimal
- Est. fire insurance / yr
- $787 – $1,461
Heat risk 5/10 · Moderate
- Hot days now (above 97°F)
- 7 days/yr
- Hot days in 30 yrs
- 21 days/yr
Wind risk 1/10 · Minimal
- Chance of severe wind over 30 yrs
- 1.0%
Air-quality risk 2/10 · Minimal
- Unhealthy air days now
- 0 days/yr
- Unhealthy air days in 30 yrs
- 1 days/yr
Risk factors via First Street. Map © Google.
Why this score? — see what drove the D- grade
The composite is a weighted blend of 9 inputs, each scored 0–100. Each bar is that input's sub-score; the figure is the points it added to the 100-point composite (weight × sub-score).
- Cash flow +15.8/30.0
- DSCR +4.9/10.0
- Livability +4.0/5.0
- Rent growth +3.4/5.0
- 1% rule +3.1/10.0
- Schools +3.0/10.0
- Condition / age +2.5/5.0
- ARV discount +0.0/15.0
- Appreciation +0.0/10.0
$125,000
🖨 Deal sheet (PDF) 📄 Offer letter ✓ Due diligence
Listing remarks
Charming 2-Bedroom Home with Fenced Yard Welcome to this well-maintained 2-bedroom, 1-bathroom home nestled on a quiet street. The property features a spacious fenced backyard, perfect for pets, entertaining, or relaxing outdoors. A finished shed adds versatility—ideal for storage, hobbies, or a small workshop. The home has been lovingly cared for and includes a durable metal roof for peace of mind. With new water lines going in the neighborhood, all streets will be paved once project is complete. If you’re looking for a move-in ready home with a great outdoor space, this is one you won’t want to miss!
Key facts
- Metal roof
- Fenced backyard
- Finished shed
Tags
Neighborhood map
What this means for you Summary
Snapshot
- This is a 2-bed/1.0-bath single-family listed at $125k.
Deal economics
- At list price, monthly cash flow is $57 ($689/yr) — positive.
- The deal already cash-flows at list — no discount required.
- To meet the 1% rule (rent ≥ 1% of price), the offer needs to be $101k (19.4% below list).
- Recommended offer: $101k (19.4% below list) — sets the bar for 1% rule.
Location & tenants
- Location reads 81/100 on livability (#11 in WV, #1,521 nationally) — a professional / high-income tenant draw. Strengths: commute A+, cost of living A+, housing A+; Watch: amenities C-, crime D+, employment D-.
- Harrison County Schools (town): math 29% / reading 43% proficiency, ranked #12 of 55 in WV (top 22%) — families likely to look elsewhere, expect single-tenant / working-renter base with shorter leases.
- Zoned schools: Salem Elementary (math 52% / reading 47%, grade D, #49 of 377 statewide, top 16%, 189 students, 0% FRL); Mountaineer Middle School (math 25% / reading 37%, grade F, #55 of 109 statewide, top 51%, 361 students, 0% FRL); Lincoln High School (math 17% / reading 37%, grade F, #79 of 110 statewide, top 78%, 548 students, 0% FRL) — zoned schools average 0% FRL vs 43% district-wide (43 pts lower); this property's tenant base skews higher-income than the district average.
- Market conditions: Rents rising (+3.6%/yr); 54 active listings in the ZIP; 84 units permitted in Harrison County in 2024 (5 in 5+ unit buildings).
Forward outlook
- Local home prices are declining (-3.0%/yr); year-one equity from $864 of loan paydown is wiped out by about $4k of value loss. Plan a longer hold.
- Harrison County population projected at -11% by 2050 — secular population decline; favor cash flow + early exit over multi-decade hold.
Negotiation context
- Only 7 days on market — expect competitive offers; lowballing is unlikely to land.
Risks & watch-outs
- Watch-outs: built in 1920 — expect roof / HVAC / electrical / plumbing capex.
- Climate carrying-cost: extreme-heat days projected 7→21/yr by 2055 (HVAC capex compounding) — expect insurance premiums to compound above CPI over the hold.
Questions for the listing agent
- Built in 1920 — when were the roof, HVAC, electrical panel, plumbing, and water heater last replaced?
- Is there a deadline driving the sale (1031 exchange, divorce, estate, relocation)? That informs how much negotiation room exists.
- Schools are F-rated, which usually means shorter tenancies and higher turnover. Who's the typical renter profile here, and what's been the actual vacancy rate?
- Crime grade is D in this area — have there been break-ins, vandalism, or insurance claims at this property in the last 3 years? What carrier currently insures it and at what premium?
- The area grade is low — what's the realistic commute time and amenity access for the typical tenant pool here? Any planned neighborhood developments (good or bad) we should know about?
- What's the average days-on-market for RENTAL listings here right now (not sales)? A rising rental-DOM trend means longer vacancies and softer asking-rent achievability than the comps imply.
- What's the recent tenant-quality profile in this submarket — average credit score on applications, eviction rate, late-payment / NSF rate, and stable-employment percentage? A property-management company in the area should have these aggregated.
- How much new for-sale + rental construction is in the pipeline within 1–3 miles? Heavy new supply typically softens prices + rents 12–24 months out; constrained supply supports both.
Investment metrics
- 1% rule
- 0.81% ✗
- Cap rate
- 6.84%
- Cash-on-cash
- 1.97%
- DSCR
- 1.09
- GRM
- 10.3
CMA / ARV
- ARV (on-the-fly)
- $92,352
- Comps found
- 11
Show comp detail 11 sales within ~0.75 mi
| Address | Dist | Beds/Ba | Sqft | Sold | Price | $/sf | Match |
|---|---|---|---|---|---|---|---|
| 1523 N 16th | 0.13mi | 2/1.0 | 904 (+9%) | 3mo | $85,000 | $94 | 77 |
| 1920 Hamill Ave | 0.20mi | 2/1.0 | 819 (-2%) | 13mo | $138,000 | $168 | 77 |
| 1619 Gould | 0.07mi | 2/1.5 | 866 (+4%) | 19mo | $119,000 | $137 | 72 |
| 1201 N 25th St | 0.49mi | 2/1.0 | 824 (-1%) | 5mo | $109,000 | $132 | 71 |
| 1600 Pride | 0.12mi | 2/1.0 | 810 (-3%) | 23mo | $90,000 | $111 | 71 |
| 1217 N 18th St | 0.15mi | 2/1.0 | 874 (+5%) | 19mo | $90,000 | $103 | 68 |
| 1102 N 14th St | 0.32mi | 2/1.0 | 800 (-4%) | 13mo | $125,000 | $156 | 68 |
| 1101 N 15th St | 0.31mi | 2/1.0 | 894 (+8%) | 10mo | $134,000 | $150 | 65 |
| 1823 N 21 St | 0.41mi | 1/1.0 (-1) | 760 (-9%) | 1mo | $65,000 | $86 | 61 |
| 1533 Hoffman Ave | 0.73mi | 3/1.0 (+1) | 833 (+0%) | 5mo | $18,000 | $22 | 57 |
| 314 N 7th St | 0.69mi | 2/1.0 | 732 (-12%) | 13mo | $72,000 | $98 | 37 |
Match score weights: distance 35% · size 25% · config 20% · recency 20%. Top-matched comps best support the ARV.
Projected returns pro-forma
-3.0% appreciation · 3.62% rent growth · sell at horizon
- IRR
- -12.6%
- Equity multiple
- 0.54×
- Total profit
- $-16,025
- Equity at exit
- $18,638
- IRR
- -2.9%
- Equity multiple
- 0.80×
- Total profit
- $-6,866
- Equity at exit
- $10,808
Cash invested: $35,000 (down + closing). Projections, not guarantees.
Landlord ↔ Tenant lean methodology
- Overall (STATE)
- 83 Strongly Landlord-Friendly
- State West Virginia
- 83 Strongly Landlord-Friendly · R+22
- County
- — inherits STATE
- City
- — inherits STATE
ZIP-level market 26301
- Home prices YoY
- -26.4%
- Rents YoY
- 3.6%
- Active inventory
- 54
- Price-to-rent
- 10.3×
Monthly cashflow live
- Estimated rent
- $1,007 medium interval (Pro) →
- Mortgage (P&I)
- −$656
- Tax from tax record
- −$31 /mo · $369/yr
- Insurance
- −$52
- HOA
- −$0
- Vacancy / Maint / Mgmt
- −$212
- Net cashflow
- $57
Break-even live
Sensitivity live
| Price | -10% $128 | -5% $93 | +0% $57 | +5% $22 | +10% $-13 |
|---|---|---|---|---|---|
| Rent | -10% $-22 | -5% $18 | +0% $57 | +5% $97 | +10% $137 |
| Rate | -1.0pp $120 | -0.5pp $89 | base $57 | +0.5pp $25 | +1.0pp $-8 |
UW: 25.0% down · 7.5% · 30yr · 1.5% tax · 5.0% vac · 8.0% maint · 8.0% mgmt
Financing live
Cash to close
- Down payment
- $31,250
- Closing costs
- $3,750
- Reserves months
- —
- Total cash needed
- —
Loan-product check · same deal, 3 products live
Conventional
25% down · 7.5% · 30yr
- Down + closing
- —
- Monthly P&I
- —
- Monthly cashflow
- —
- DSCR
- —
- Eligible?
- —
Personal DTI + credit; lowest rate.
DSCR
20% down · 8.5% · 30yr
- Down + closing
- —
- Monthly P&I
- —
- Monthly cashflow
- —
- DSCR
- —
- Eligible?
- —
No personal income docs; deal must DSCR.
Hard money
10% down · 12.0% · 12mo
- Down + closing
- —
- Monthly P&I
- —
- Monthly cashflow
- —
- DSCR
- —
- Eligible?
- —
Short-term bridge; refi at stabilization.
Listing history 2 events
-
2025-09-23status Pending
-
2025-09-16$125,000 Active
ⓘ Source: listings_history table (triggers on properties + properties_extension) + one-shot
backfill from property_details.listing_events for pre-trigger history.
Tax reassessment forecast WV · Resets to sale price
- Current annual tax
- $369 · $31/mo
- Projected year-2 tax
- $738 · $61/mo
- Expected delta
- +$368/yr (+$31/mo · 99.7%)
ⓘ Screening estimate from a state-policy table — verify with the county assessor before closing.
Climate risk First Street
- Flood 1/10 Low FEMA zone X (unshaded) · 0% chance over 30 yrs
- Wildfire 1/10 Low
- Heat 5/10 Major 7 d/yr ≥97°F today · 21 d/yr by 30 yrs out
- Wind 1/10 Low 100% chance of damaging wind over 30 yrs
- Air quality 2/10 Low 0 unhealthy d/yr today · 1 by 30 yrs out
Nearby sold comps map
Loading sold comps map…
Walkable amenities ~0.75 mi
Loading nearby amenities…
Taxation est. · year 1
- Rental income
- $12,089
- − Mortgage interest
- −$7,002
- − Property taxes
- −$369
- − Insurance
- −$625
- − Repairs & maintenance
- −$967
- − Management
- −$967
- − Depreciation
- −$3,636
- Taxable loss
- −$1,478
- Est. tax savings @ 24.0%
- +$355
- After-tax cash flow
- $1,044/yr
For passive investors: Depreciation is non-cash, so a rental often shows a tax loss while cash-flowing — sheltering income. Rental losses are passive: they offset passive income freely, and up to $25,000/yr can offset ordinary (W-2) income if you actively participate and your MAGI is under $100k (phasing out to $0 by $150k); unused losses carry forward. On sale, claimed depreciation is recaptured at up to 25%, and gains may owe capital-gains tax (a 1031 exchange can defer both). Figures are a year-1 estimate at your 24.0% rate — not tax advice; consult a CPA.
Schools (NCES district)
- District
- Harrison County Schools
- NCES district ID
- 5400510
- Math proficiency
- 29% ▼ -10.00%
- Reading proficiency
- 43% ▼ -3.00%
- Median HH income
- $43,269
- Composite
- 30.48/100
- National rank
- #6222
- State rank
- #12 of 55 in WV
Livability — Clarksburg
- Score
- 81/100
- State rank
- #11
- US rank
- #1521
Category grades
Schools grade is shown separately in the Schools card above.
Census & demographics
- Census place
- Clarksburg, WV
- County
- Harrison County · 44,316 people
- City population
- 28,716
- Metro
- Clarksburg, WV
- Population (ZIP)
- 28,716
- Household income
- $49,816
- Rent vs Own
- Severe rent burden
- 765.0
Population outlook (Harrison County) Hauer SSP2
- Today (2025)
- 67,273 people
- By 2030
- 65,963 · -1.9%
- By 2040
- 63,033 · -6.3%
- By 2050
- 59,999 · -10.8%
- By 2075
- 52,524 · -21.9%
- By 2100
- 42,654 · -36.6%
Race, ethnicity, and origin ACS 2023
- Neighborhood character
- Predominantly White (92%)
- Race & ethnicity
- White 92% Two or more races 5% Hispanic / Latino 2% Black 2%
- Common ancestry
- Slovak 2% Serbian 2% Lithuanian 1%
- Foreign-born
- 0%
- Languages at home
- 98% English-only · Other Indo-European 1%
Political lean MEDSL · Harrison
- 2024 margin
- Solid R (+41.0) · D 28.5% · R 69.4% · Other 2.1%
- 2008→2024 swing
- -27.6pp toward R · 2008: -13.3pp · 2024: -41.0pp
- All cycles
- 2024: R+41.0 2020: R+37.6 2016: R+39.5 2012: R+23.5 2008: R+13.3
Not yet ingested
- Civics
- —
Market trends
- HPI YoY
- ▼ -53.70%
- Current HPI
- 149.308
- Rent YoY
- ▲ 3.62%
- Metro
- Clarksburg, WV
- State GDP YoY
- —
- F500 in state
- 0
Price history
2 events — show timeline
- 2025-09-23 Pending — NCWVREIN
- 2025-09-16 Listed $125,000 NCWVREIN
Property tax history
+6.1%/yrLatest (2025): $369 · +10.3% YoY. Source: county tax records.
Cash-flow waterfall
monthlySold comps — $/sqft
last 12 mo · ≤1 miLoading sold comps…