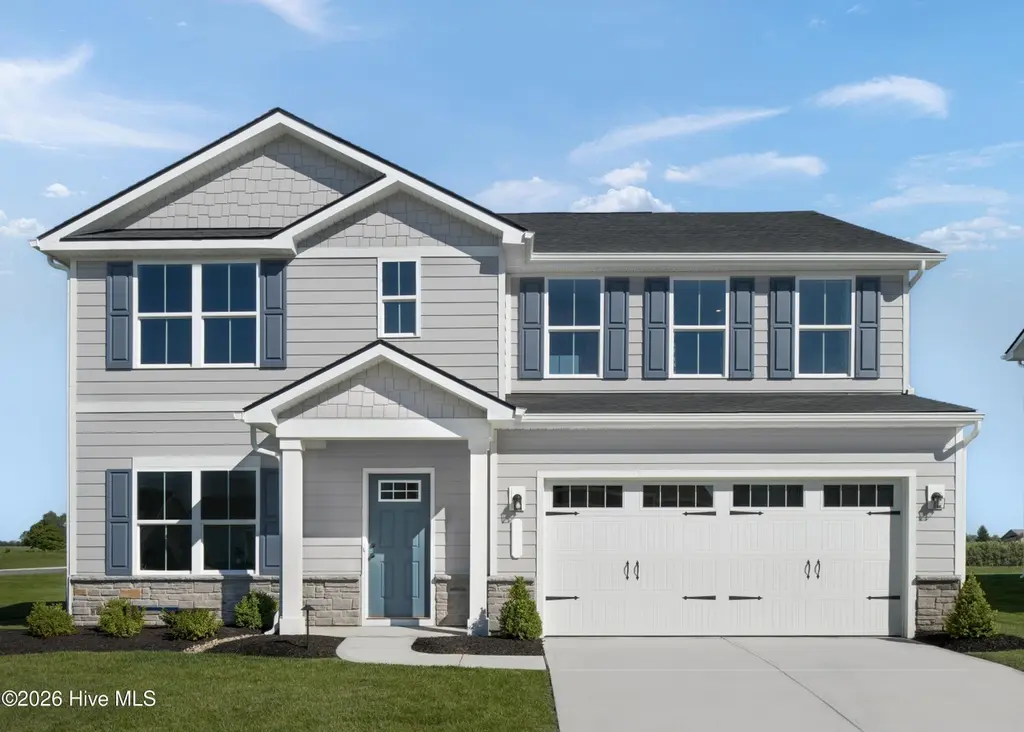
128 Jasmine Ct · South Mills, NC
Flood risk No data
- FEMA flood zone
- —
- Chance of flooding over 30 yrs
- —
- Est. flood insurance / yr
- —
Fire risk No data
- Est. fire insurance / yr
- —
Heat risk No data
- Hot days now (above threshold)
- —
- Hot days in 30 yrs
- —
Wind risk No data
- Chance of severe wind over 30 yrs
- —
Air-quality risk No data
- Unhealthy air days now
- —
- Unhealthy air days in 30 yrs
- —
Risk factors via First Street. Map © Google.
Why this score? — see what drove the D- grade
The composite is a weighted blend of 9 inputs, each scored 0–100. Each bar is that input's sub-score; the figure is the points it added to the 100-point composite (weight × sub-score).
- ARV discount +8.9/15.0
- Cash flow +8.1/30.0
- Schools +5.2/10.0
- Appreciation +4.8/10.0
- Livability +2.9/5.0
- 1% rule +2.7/10.0
- Rent growth +2.5/5.0
- Condition / age +2.5/5.0
- DSCR +2.1/10.0
$427,905
🖨 Deal sheet (PDF) 📄 Offer letter ✓ Due diligence
Listing remarks MLS
HAZEL. SOLD. TBB.
Key facts
- Double-vanity bath
- Flex space
- Community amenities
Tags
Property features AI
Finance
- HOA & community: Has HOA managed by GOODMAN PROPERTY MANAGEMENT; HOA fee $65 monthly; Warranty plan
Exterior
- Utilities: City/County water; City/County sewer; Electric water heater; Electric power
- Home design: Detached home; Traditional style; 2 stories; Slab foundation
- Construction: Vinyl siding; Asphalt shingle roof
- Exterior features: Cul-de-sac lot; Wooded view
Interior
- Kitchen: Electric range; Microwave; Refrigerator; Dishwasher; Disposal
- Bedrooms: Master bedroom on 2nd floor; Additional bedrooms on 2nd floor
- Flooring: Carpet; Laminate
- Bathrooms: Two full bathrooms; One half bathroom
- Heating & cooling: Electric heating; Central air conditioning
- Interior features: Primary bathroom with double sinks; Pull-down attic stairs; Walk-in closet; Breakfast area; Foyer; Office/Study; Pantry
- Laundry & utility: Washer hookup; Dryer hookup
Neighborhood map
What this means for you Summary
Snapshot
- This is a 5-bed/3.0-bath single-family listed at $428k.
Deal economics
- At list price, monthly cash flow is $-415 ($-5k/yr) — negative.
- To cash-flow at today's rent, offer at most $368k (14.0% below list).
- To meet the 1% rule (rent ≥ 1% of price), the offer needs to be $330k (22.9% below list).
- Recommended offer: $330k (22.9% below list) — sets the bar for 1% rule.
Location & tenants
- Location reads 57/100 on livability (#612 in NC) — a working-class tenant base; expect higher turnover. Strengths: cost of living A+, crime A, housing A; Watch: amenities F, commute F, employment F.
- Camden County Schools (rural): math 56% / reading 64% proficiency, ranked #29 of 178 in NC (top 16%) — acceptable for families but not a draw, mixed tenant base, ~2y average lease.
- Zoned schools: Grandy Primary (math 87% / reading 72%, grade A, #24 of 1,410 statewide, top 2%, 607 students, 32% FRL); Camden County High (math 62% / reading 62%, grade B-, #184 of 535 statewide, top 37%, 464 students, 25% FRL).
- Market conditions: 86 active listings in the ZIP; 1 comparable units currently listed for rent nearby; 105 units permitted in Camden County in 2024 (0 in 5+ unit buildings).
Forward outlook
- In year one you build about $1k of equity ($3k loan paydown + $-2k appreciation (-0.4% local appreciation)).
- Camden County population projected at +5% by 2050 — modest demand growth; plan on rents tracking national, not racing it.
- By year 10, paydown + projected appreciation supports a ~$30k cash-out refi (75% LTV) — recoverable capital for the next deal without selling this one.
Negotiation context
- It's been on market 42 days — a 3% lower offer ($415k) is reasonable based on typical stale-listing flexibility.
- 2 sale attempts; this cycle's ask is 9% above the opening price — seller raised mid-cycle; expect resistance to lowballs.
Questions for the listing agent
- What do current leases actually rent for vs. the listed asking? Can we see a recent rent roll and the last 12 months of T-12 income?
- It's been on market 42 days. Have you received any prior offers? Is the seller open to a 23% concession, seller financing, or rate buy-down credit?
- What does the HOA fee cover, when was the last increase, and are there any pending special assessments or reserve-fund shortfalls?
- Is there a deadline driving the sale (1031 exchange, divorce, estate, relocation)? That informs how much negotiation room exists.
- Schools are D-rated, which usually means shorter tenancies and higher turnover. Who's the typical renter profile here, and what's been the actual vacancy rate?
- The area grade is low — what's the realistic commute time and amenity access for the typical tenant pool here? Any planned neighborhood developments (good or bad) we should know about?
- What's the average days-on-market for RENTAL listings here right now (not sales)? A rising rental-DOM trend means longer vacancies and softer asking-rent achievability than the comps imply.
- What's the recent tenant-quality profile in this submarket — average credit score on applications, eviction rate, late-payment / NSF rate, and stable-employment percentage? A property-management company in the area should have these aggregated.
- How much new for-sale + rental construction is in the pipeline within 1–3 miles? Heavy new supply typically softens prices + rents 12–24 months out; constrained supply supports both.
Investment metrics
- 1% rule
- 0.77% ✗
- Cap rate
- 5.13%
- Cash-on-cash
- -4.16%
- DSCR
- 0.81
- GRM
- 10.8
CMA / ARV
- ARV (on-the-fly)
- $441,960
- Comps found
- 12
Show comp detail 12 sales within ~0.75 mi
| Address | Dist | Beds/Ba | Sqft | Sold | Price | $/sf | Match |
|---|---|---|---|---|---|---|---|
| 209 Myrtle Ln | 0.13mi | 5/3.0 | 2,540 (0%) | 2mo | $450,990 | $178 | 92 |
| 129 Pampas St | 0.21mi | 5/3.0 | 2,540 (0%) | 2mo | $442,990 | $174 | 89 |
| 223 Myrtle Ln | 0.24mi | 6/3.0 (+1) | 2,540 (0%) | 4mo | $431,815 | $170 | 81 |
| 102 Jasmine Ct | 0.52mi | 5/2.5 | 2,540 (0%) | 4mo | $444,205 | $175 | 70 |
| 233 Myrtle Ln | 0.52mi | 6/3.0 (+1) | 2,540 (0%) | 3mo | $416,375 | $164 | 68 |
| 112 Jasmine Ct | 0.52mi | 4/3.0 (-1) | 2,540 (0%) | 4mo | $440,650 | $173 | 67 |
| 227 Myrtle Ln | 0.52mi | 4/2.5 (-1) | 2,540 (0%) | 2mo | $441,950 | $174 | 67 |
| 203 Myrtle Ln | 0.52mi | 6/3.0 (+1) | 2,540 (0%) | 6mo | $446,510 | $176 | 66 |
| 114 Jasmine Ct | 0.52mi | 4/2.5 (-1) | 2,540 (0%) | 3mo | $435,760 | $172 | 66 |
| 219 Myrtle Ln | 0.52mi | 4/2.5 (-1) | 2,540 (0%) | 4mo | $446,750 | $176 | 65 |
| 215 Myrtle Ln | 0.13mi | 5/5.5 | 2,176 (-14%) | 3mo | $416,990 | $192 | 58 |
| 204 Spencers Ave | 0.52mi | 5/3.0 | 2,160 (-15%) | 3mo | $285,000 | $132 | 48 |
Match score weights: distance 35% · size 25% · config 20% · recency 20%. Top-matched comps best support the ARV.
Projected returns pro-forma
-0.39% appreciation · 3.0% rent growth · sell at horizon
- IRR
- -8.6%
- Equity multiple
- 0.61×
- Total profit
- $-46,679
- Equity at exit
- $115,942
- IRR
- -2.2%
- Equity multiple
- 0.78×
- Total profit
- $-26,862
- Equity at exit
- $132,899
Cash invested: $119,813 (down + closing). Projections, not guarantees.
Landlord ↔ Tenant lean methodology
- Overall (STATE)
- 85 Strongly Landlord-Friendly
- State North Carolina
- 85 Strongly Landlord-Friendly · R+3
- County
- — inherits STATE
- City
- — inherits STATE
ZIP-level market 27976
- Home prices YoY
- -0.2%
- Active inventory
- 86
- Price-to-rent
- 10.8×
Monthly cashflow live
- Estimated rent
- $3,300 medium interval (Pro) →
- Mortgage (P&I)
- −$2,244
- Tax est. 1.5%
- −$535 /mo · $6,419/yr
- Insurance
- −$178
- HOA
- −$65
- Vacancy / Maint / Mgmt
- −$693
- Net cashflow
- $-415
Break-even live
Sensitivity live
| Price | -10% $-119 | -5% $-267 | +0% $-415 | +5% $-563 | +10% $-711 |
|---|---|---|---|---|---|
| Rent | -10% $-676 | -5% $-546 | +0% $-415 | +5% $-285 | +10% $-154 |
| Rate | -1.0pp $-200 | -0.5pp $-306 | base $-415 | +0.5pp $-526 | +1.0pp $-639 |
UW: 25.0% down · 7.5% · 30yr · 1.5% tax · 5.0% vac · 8.0% maint · 8.0% mgmt
Financing live
Cash to close
- Down payment
- $106,976
- Closing costs
- $12,837
- Reserves months
- —
- Total cash needed
- —
Loan-product check · same deal, 3 products live
Conventional
25% down · 7.5% · 30yr
- Down + closing
- —
- Monthly P&I
- —
- Monthly cashflow
- —
- DSCR
- —
- Eligible?
- —
Personal DTI + credit; lowest rate.
DSCR
20% down · 8.5% · 30yr
- Down + closing
- —
- Monthly P&I
- —
- Monthly cashflow
- —
- DSCR
- —
- Eligible?
- —
No personal income docs; deal must DSCR.
Hard money
10% down · 12.0% · 12mo
- Down + closing
- —
- Monthly P&I
- —
- Monthly cashflow
- —
- DSCR
- —
- Eligible?
- —
Short-term bridge; refi at stabilization.
Rent comps 1 comps
| Address | Beds | Baths | Sqft | Rent | $/sqft | DOM | Units | Dist |
|---|---|---|---|---|---|---|---|---|
| 125 Pampas ST South Mills, NC | 4.0 | 2.5 | 1903 | $3,300 | $1.73 | 2d | 1 | 0.78mi |
HOA detail
- Monthly dues
- $65 · $780/yr
Listing history 12 events
-
2026-05-21status Pending 17-char remark
Show marketing remark (17 chars)
HAZEL. SOLD. TBB.
-
2026-05-21price $427,905 17-char remark
Show marketing remark (17 chars)
HAZEL. SOLD. TBB.
-
2026-05-21status Under Contract
Show marketing remark (17 chars)
HAZEL. SOLD. TBB.
-
2026-05-21price $427,905
Show marketing remark (17 chars)
HAZEL. SOLD. TBB.
-
2026-05-20price $409,990
Show marketing remark (17 chars)
HAZEL. SOLD. TBB.
-
2026-05-20price $409,990 17-char remark
Show marketing remark (17 chars)
HAZEL. SOLD. TBB.
-
2026-05-18price $404,990
Show marketing remark (17 chars)
HAZEL. SOLD. TBB.
-
2026-05-18price $404,990 17-char remark
Show marketing remark (17 chars)
HAZEL. SOLD. TBB.
-
2026-05-12price $399,990
Show marketing remark (17 chars)
HAZEL. SOLD. TBB.
-
2026-05-12price $399,990 17-char remark
Show marketing remark (17 chars)
HAZEL. SOLD. TBB.
-
2026-04-09$391,885 Active 17-char remark
Show marketing remark (17 chars)
HAZEL. SOLD. TBB.
-
2026-04-09$391,885 Active
Show marketing remark (17 chars)
HAZEL. SOLD. TBB.
ⓘ Source: listings_history table (triggers on properties + properties_extension) + one-shot
backfill from property_details.listing_events for pre-trigger history.
Nearby sold comps map
Loading sold comps map…
Walkable amenities ~0.75 mi
Loading nearby amenities…
Taxation est. · year 1
- Rental income
- $39,600
- − Mortgage interest
- −$23,969
- − Property taxes
- −$6,419
- − Insurance
- −$2,140
- − Repairs & maintenance
- −$3,168
- − Management
- −$3,168
- − HOA
- −$780
- − Depreciation
- −$12,448
- Taxable loss
- −$12,492
- Est. tax savings @ 24.0%
- +$2,998
- After-tax cash flow
- $-1,984/yr
For passive investors: Depreciation is non-cash, so a rental often shows a tax loss while cash-flowing — sheltering income. Rental losses are passive: they offset passive income freely, and up to $25,000/yr can offset ordinary (W-2) income if you actively participate and your MAGI is under $100k (phasing out to $0 by $150k); unused losses carry forward. On sale, claimed depreciation is recaptured at up to 25%, and gains may owe capital-gains tax (a 1031 exchange can defer both). Figures are a year-1 estimate at your 24.0% rate — not tax advice; consult a CPA.
Schools (NCES district)
- District
- Camden County Schools
- NCES district ID
- 3700600
- Math proficiency
- 56% ▲ 8.00%
- Reading proficiency
- 64% ▲ 4.00%
- Median HH income
- $59,622
- Composite
- 51.97/100
- National rank
- #1643
- State rank
- #29 of 178 in NC
Livability — South Mills
- Score
- 57/100
- State rank
- #612
- US rank
- #22229
Category grades
Schools grade is shown separately in the Schools card above.
Census & demographics
- Census place
- South Mills, NC
- Population (ZIP)
- 4,237
Population outlook (Camden County) Hauer SSP2
- Today (2025)
- 10,980 people
- By 2030
- 11,246 · +2.4%
- By 2040
- 11,562 · +5.3%
- By 2050
- 11,572 · +5.4%
- By 2075
- 11,450 · +4.3%
- By 2100
- 10,648 · -3.0%
Race, ethnicity, and origin ACS 2023
- Neighborhood character
- Predominantly White (79%)
- Race & ethnicity
- White 79% Two or more races 8% Black 8% Hispanic / Latino 6%
- Hispanic origin (detail)
- Mexican 2% Puerto Rican 1%
- Common ancestry
- Scotch-Irish 4% Portuguese 3% Romanian 3%
- Languages at home
- 98% English-only · Arabic 1%
Political lean MEDSL · Camden
- 2024 margin
- Solid R (+50.8) · D 24.2% · R 75.0%
- 2008→2024 swing
- -18.8pp toward R · 2008: -32.0pp · 2024: -50.8pp
- All cycles
- 2024: R+50.8 2020: R+46.6 2016: R+45.8 2012: R+34.0 2008: R+32.0
Not yet ingested
- Civics
- —
Market trends
- HPI YoY
- ▼ -0.39%
- Current HPI
- 174.2102
- Rent YoY
- —
- Metro
- —
- State GDP YoY
- ▲ 3.28%
- F500 in state
- 26
Industry mix (Fortune 500 HQ in NC)
| Industry | F500 HQs | Revenue |
|---|---|---|
| Financial Services | 2 | $213B |
|
||
| Retail | 2 | $95B |
|
||
| Industrial Conglomerate | 1 | $38B |
|
||
| Metals / Steel | 1 | $35B |
|
||
| Utilities | 1 | $30B |
|
||
| Industrial Machinery | 1 | $19B |
|
||
Price history
+9.2% since first listed12 events — show timeline
- 2026-05-21 Pending — Hive MLS
- 2026-05-21 Price Changed $427,905 Hive MLS
- 2026-05-21 Pending — REINMLS
- 2026-05-21 Price Changed $427,905 REINMLS
- 2026-05-20 Price Changed $409,990 REINMLS
- 2026-05-20 Price Changed $409,990 Hive MLS
- 2026-05-18 Price Changed $404,990 REINMLS
- 2026-05-18 Price Changed $404,990 Hive MLS
- 2026-05-12 Price Changed $399,990 REINMLS
- 2026-05-12 Price Changed $399,990 Hive MLS
- 2026-04-09 Listed $391,885 Hive MLS
- 2026-04-09 Listed $391,885 REINMLS
Cash-flow waterfall
monthlySold comps — $/sqft
last 12 mo · ≤1 miLoading sold comps…