1711 Jessamine Rd · Charleston, SC
Flood risk 1/10 · Minimal
- FEMA flood zone
- X (unshaded)
- Chance of flooding over 30 yrs
- 0.0%
- Est. flood insurance / yr
- $507 – $1,088
Fire risk 3/10 · Minor
- Est. fire insurance / yr
- $783 – $1,453
Heat risk 10/10 · Severe
- Hot days now (above 105°F)
- 7 days/yr
- Hot days in 30 yrs
- 18 days/yr
Wind risk 9/10 · Severe
- Chance of severe wind over 30 yrs
- 99.0%
Air-quality risk 3/10 · Minor
- Unhealthy air days now
- 3 days/yr
- Unhealthy air days in 30 yrs
- 3 days/yr
Risk factors via First Street. Map © Google.
Why this score? — see what drove the C grade
The composite is a weighted blend of 9 inputs, each scored 0–100. Each bar is that input's sub-score; the figure is the points it added to the 100-point composite (weight × sub-score).
- Cash flow +25.2/30.0
- DSCR +8.3/10.0
- ARV discount +7.5/15.0
- 1% rule +5.3/10.0
- Schools +4.3/10.0
- Livability +3.8/5.0
- Rent growth +3.0/5.0
- Condition / age +2.5/5.0
- Appreciation +0.0/10.0
$295,000
🖨 Deal sheet (PDF) 📄 Offer letter ✓ Due diligence
Listing remarks
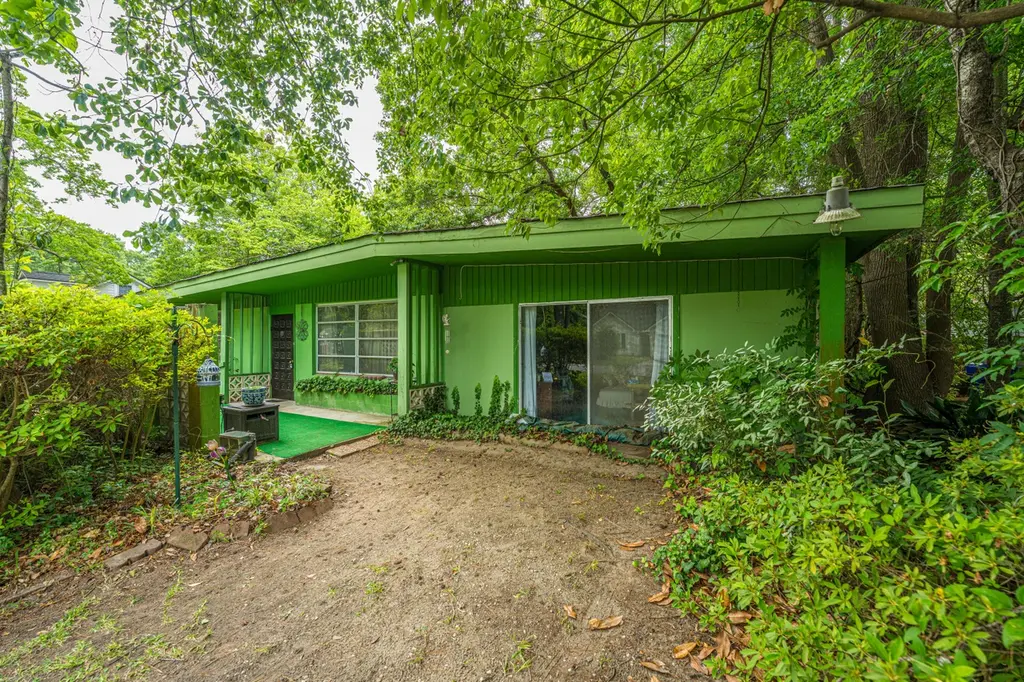
Prime West Ashley location, just off Sam Rittenberg Highway and Ashley River Road. The property includes a 3-bedroom, 2-bath, Mid-Century Modern Home in need of full renovation on a . 19-acre parcel. Ideal opportunity for a fix-and-flip or a primary residence. Convenient access to shopping, dining, beaches and downtown.
Key facts
- Convenient access
- Full renovation
- 8,276 sq ft lot
Tags
Property features AI
Exterior
- Parking: Off-street parking
- Utilities: Public sewer
- Home design: Single-family detached residence; One story; Ground level entry
- Construction: Asphalt roof; Fee simple ownership
- Exterior features: Partial fencing; Level lot
Interior
- Bedrooms: 3 bedrooms
- Bathrooms: 2 bathrooms
- Heating & cooling: Central heating; Window unit(s) for cooling
- Interior features: Family room; Separate dining room; Fireplace in family room (one)
Neighborhood map
What this means for you Summary
Snapshot
- This is a 3-bed/2.0-bath single-family listed at $295k.
Deal economics
- At list price, monthly cash flow is $660 ($8k/yr) — positive.
- The deal already cash-flows at list — no discount required.
- Meets the 1% rule at list price ($3k rent vs $295k).
- Cap rate 9.0% vs local median 2.4% in Charleston — top-decile yield for the area; either an underpriced asset or a hidden risk that comps aren't pricing in. Stress-test before assuming the spread holds.
Location & tenants
- Location reads 76/100 on livability (#22 in SC, #3,336 nationally) — a middle-class / working-renter tenant base. Strengths: amenities A+, housing A+, health & safety A+; Watch: crime D+, commute F, cost of living D-.
- Charleston 01 (urban): math 48% / reading 53% proficiency, ranked #7 of 80 in SC (top 9%) — acceptable for families but not a draw, mixed tenant base, ~2y average lease.
- Zoned schools: Stono Park Elementary (math 22% / reading 22%, grade F, #475 of 597 statewide, top 81%, 399 students, 100% FRL); C. E. Williams Middle School For Creative And Scientific Art (math 25% / reading 38%, grade F, #124 of 229 statewide, top 55%, 1,172 students, 70% FRL); West Ashley High (math 52% / reading 84%, grade B, #70 of 196 statewide, top 36%, 1,935 students, 100% FRL) — zoned schools average 90% FRL vs 44% district-wide (46 pts higher); higher-poverty schools than district average — tighter screening recommended.
- Market conditions: Rents rising (+2.2%/yr); 136 active listings in the ZIP; 10 comparable units currently listed for rent nearby; rentals at typical pace (median 25d on market — plan ~3-4 weeks tenant-placement turnaround); solid renter incomes; 4,156 units permitted in Charleston County in 2024 (857 in 5+ unit buildings).
- This rent runs 43% of the median local income ($85k/yr) — at the standard rent-burdened threshold; future hikes will face affordability resistance.
Forward outlook
- Local home prices are declining (-3.0%/yr); year-one equity from $2k of loan paydown is wiped out by about $9k of value loss. Plan a longer hold.
- Charleston County population projected at +44% by 2050 — long-run rental-demand tailwind backs the buy-and-hold thesis.
Negotiation context
- Only 2 days on market — expect competitive offers; lowballing is unlikely to land.
Risks & watch-outs
- Climate carrying-cost: severe wind risk, 99% chance of damaging wind over 30y; extreme-heat days projected 7→18/yr by 2055 (HVAC capex compounding) — expect insurance premiums to compound above CPI over the hold.
Questions for the listing agent
- Built in 1962 — when were the roof, HVAC, electrical panel, plumbing, and water heater last replaced?
- Is there a deadline driving the sale (1031 exchange, divorce, estate, relocation)? That informs how much negotiation room exists.
- Schools are A-rated — typically a magnet for longer-tenancy family renters. What's the average tenant stay here, and is there a school-zone premium baked into asking?
- Crime grade is D in this area — have there been break-ins, vandalism, or insurance claims at this property in the last 3 years? What carrier currently insures it and at what premium?
- What's the average days-on-market for RENTAL listings here right now (not sales)? A rising rental-DOM trend means longer vacancies and softer asking-rent achievability than the comps imply.
- What's the recent tenant-quality profile in this submarket — average credit score on applications, eviction rate, late-payment / NSF rate, and stable-employment percentage? A property-management company in the area should have these aggregated.
- How much new for-sale + rental construction is in the pipeline within 1–3 miles? Heavy new supply typically softens prices + rents 12–24 months out; constrained supply supports both.
Investment metrics
- 1% rule
- 1.03% ✓
- Cap rate
- 8.98%
- Cash-on-cash
- 9.58%
- DSCR
- 1.43
- GRM
- 8.1
CMA / ARV
- ARV (on-the-fly)
- $716,430
- Comps found
- 10
Show comp detail 10 sales within ~0.75 mi
| Address | Dist | Beds/Ba | Sqft | Sold | Price | $/sf | Match |
|---|---|---|---|---|---|---|---|
| 1711 Jessamine Rd | 0.00mi | 3/2.0 | 2,145 (0%) | 1mo | $325,000 | $152 | 99 |
| 1513 Morgan Campbell Ct | 0.27mi | 4/3.0 (+1) | 2,060 (-4%) | 4mo | $599,000 | $291 | 68 |
| 1514 Gardenia Rd | 0.31mi | 3/2.0 | 1,856 (-14%) | 12mo | $633,000 | $341 | 53 |
| 1729 Heritage Park Rd | 0.59mi | 4/2.5 (+1) | 2,044 (-5%) | 8mo | $695,000 | $340 | 51 |
| 1416 Fairfield Ave | 0.48mi | 3/2.5 | 1,888 (-12%) | 8mo | $630,000 | $334 | 49 |
| 834 Prince John Dr | 0.70mi | 4/3.0 (+1) | 2,189 (+2%) | 13mo | $360,000 | $164 | 44 |
| 1311 Marvin Ave | 0.44mi | 3/2.5 | 2,343 (+9%) | 24mo | $797,900 | $341 | 42 |
| 1602 Juniper St | 0.61mi | 4/3.5 (+1) | 2,142 (-0%) | 23mo | $392,850 | $183 | 41 |
| 1260 Marvin Ave | 0.75mi | 3/3.0 | 1,893 (-12%) | 7mo | $685,000 | $362 | 35 |
| 1849 Hazelwood Dr | 0.69mi | 4/2.5 (+1) | 2,222 (+4%) | 24mo | $400,000 | $180 | 35 |
Match score weights: distance 35% · size 25% · config 20% · recency 20%. Top-matched comps best support the ARV.
Projected returns pro-forma
-3.0% appreciation · 2.18% rent growth · sell at horizon
- IRR
- -2.7%
- Equity multiple
- 0.90×
- Total profit
- $-8,412
- Equity at exit
- $43,985
- IRR
- 6.1%
- Equity multiple
- 1.44×
- Total profit
- $36,193
- Equity at exit
- $25,506
Cash invested: $82,600 (down + closing). Projections, not guarantees.
Landlord ↔ Tenant lean methodology
- Overall (STATE)
- 90 Strongly Landlord-Friendly
- State South Carolina
- 90 Strongly Landlord-Friendly · R+6
- County
- — inherits STATE
- City
- — inherits STATE
ZIP-level market 29407
- Rents YoY
- 2.2%
- Active inventory
- 136
- Price-to-rent
- 8.1×
Monthly cashflow live
- Estimated rent
- $3,026 high interval (Pro) →
- Mortgage (P&I)
- −$1,547
- Tax from tax record
- −$61 /mo · $732/yr
- Insurance
- −$123
- HOA
- −$0
- Vacancy / Maint / Mgmt
- −$635
- Net cashflow
- $660
Break-even live
Sensitivity live
| Price | -10% $827 | -5% $743 | +0% $660 | +5% $576 | +10% $493 |
|---|---|---|---|---|---|
| Rent | -10% $421 | -5% $540 | +0% $660 | +5% $779 | +10% $899 |
| Rate | -1.0pp $808 | -0.5pp $735 | base $660 | +0.5pp $583 | +1.0pp $505 |
UW: 25.0% down · 7.5% · 30yr · 1.5% tax · 5.0% vac · 8.0% maint · 8.0% mgmt
Financing live
Cash to close
- Down payment
- $73,750
- Closing costs
- $8,850
- Reserves months
- —
- Total cash needed
- —
Loan-product check · same deal, 3 products live
Conventional
25% down · 7.5% · 30yr
- Down + closing
- —
- Monthly P&I
- —
- Monthly cashflow
- —
- DSCR
- —
- Eligible?
- —
Personal DTI + credit; lowest rate.
DSCR
20% down · 8.5% · 30yr
- Down + closing
- —
- Monthly P&I
- —
- Monthly cashflow
- —
- DSCR
- —
- Eligible?
- —
No personal income docs; deal must DSCR.
Hard money
10% down · 12.0% · 12mo
- Down + closing
- —
- Monthly P&I
- —
- Monthly cashflow
- —
- DSCR
- —
- Eligible?
- —
Short-term bridge; refi at stabilization.
Rent comps 10 comps
| Address | Beds | Baths | Sqft | Rent | $/sqft | DOM | Units | Dist |
|---|---|---|---|---|---|---|---|---|
| 1865 Jaywood Cir Charleston, SC | 3.0 | 2.0 | 2078 | $2,781 | $1.34 | 25d | 1 | 0.67mi |
| 1258 Gilmore Rd Charleston, SC | 3.0 | 2.0 | 1454 | $3,100 | $2.13 | 25d | 1 | 0.74mi |
| 1395 W Lenevar Dr Charleston, SC | 3.0 | 2.0 | 1696 | $2,700 | $1.59 | 25d | 1 | 0.85mi |
| 1552 Evergreen St Unit B Charleston, SC | 3.0 | 1.5 | 1535 | $1,950 | $1.27 | 22d | 1 | 0.87mi |
| 1709 Mulmar St Charleston, SC | 4.0 | 2.0 | 1700 | $3,030 | $1.78 | 25d | 1 | 0.92mi |
| 1750 Raoul Wallenberg Blvd Charleston, SC | 1.0–3.0 | 1.0–2.0 | 1163 | $1,450 | $1.25 | 16d | 4 | 0.95mi |
| 804 Browning Rd #2 Charleston, SC | 4.0 | 3.0 | 1700 | $4,000 | $2.35 | 25d | 1 | 1.17mi |
| 413 Hoff Ave Charleston, SC | 3.0 | 1.5 | 1596 | $3,750 | $2.35 | 22d | 1 | 1.24mi |
| 1790 Wilshire Dr Unit 1491019P Charleston, SC | 4.0 | 2.0 | 2551 | $8,490 | $3.33 | 25d | 1 | 1.30mi |
| 78 Ashley Hall Plantation Rd Charleston, SC | 1.0–3.0 | 1.0–2.5 | 1025 | $2,007 | $1.96 | 4d | 13 | 1.41mi |
Listing history 2 events
-
2026-05-09status Pending
-
2026-05-06$295,000 Active
ⓘ Source: listings_history table (triggers on properties + properties_extension) + one-shot
backfill from property_details.listing_events for pre-trigger history.
Tax reassessment forecast SC · Resets to sale price
- Current annual tax
- $732 · $61/mo
- Projected year-2 tax
- $1,682 · $140/mo
- Expected delta
- +$949/yr (+$79/mo · 129.7%)
ⓘ Screening estimate from a state-policy table — verify with the county assessor before closing.
Climate risk First Street
- Flood 1/10 Low FEMA zone X (unshaded) · 0% chance over 30 yrs
- Wildfire 3/10 Moderate
- Heat 10/10 Extreme 7 d/yr ≥105°F today · 18 d/yr by 30 yrs out
- Wind 9/10 Extreme 99% chance of damaging wind over 30 yrs
- Air quality 3/10 Moderate 3 unhealthy d/yr today · 3 by 30 yrs out
Nearby sold comps map
Loading sold comps map…
Walkable amenities ~0.75 mi
Loading nearby amenities…
Taxation est. · year 1
- Rental income
- $36,312
- − Mortgage interest
- −$16,525
- − Property taxes
- −$732
- − Insurance
- −$1,475
- − Repairs & maintenance
- −$2,905
- − Management
- −$2,905
- − Depreciation
- −$8,582
- Taxable income
- $3,189
- Est. tax owed @ 24.0%
- −$765
- After-tax cash flow
- $7,150/yr
For passive investors: Depreciation is non-cash, so a rental often shows a tax loss while cash-flowing — sheltering income. Rental losses are passive: they offset passive income freely, and up to $25,000/yr can offset ordinary (W-2) income if you actively participate and your MAGI is under $100k (phasing out to $0 by $150k); unused losses carry forward. On sale, claimed depreciation is recaptured at up to 25%, and gains may owe capital-gains tax (a 1031 exchange can defer both). Figures are a year-1 estimate at your 24.0% rate — not tax advice; consult a CPA.
Schools (NCES district)
- District
- Charleston 01
- NCES district ID
- 4501440
- Math proficiency
- 48% ▼ -2.00%
- Reading proficiency
- 53% ▬ 0.00%
- Median HH income
- $52,376
- Composite
- 43.41/100
- National rank
- #3018
- State rank
- #7 of 80 in SC
Livability — Charleston
- Score
- 76/100
- State rank
- #22
- US rank
- #3336
Category grades
Schools grade is shown separately in the Schools card above.
Census & demographics
- County
- Charleston County · 366,793 people
- City population
- 200,573
- Metro
- Charleston-North Charleston, SC
- Population (ZIP)
- 36,706
- Household income
- $85,367
- Rent vs Own
- Severe rent burden
- 1988.0
Population outlook (Charleston County) Hauer SSP2
- Today (2025)
- 480,562 people
- By 2030
- 525,921 · +9.4%
- By 2040
- 612,189 · +27.4%
- By 2050
- 691,627 · +43.9%
- By 2075
- 847,979 · +76.5%
- By 2100
- 926,482 · +92.8%
Race, ethnicity, and origin ACS 2023
- Neighborhood character
- Majority White (63%)
- Race & ethnicity
- White 63% Black 26% Hispanic / Latino 5% Two or more races 4% Asian 2%
- Hispanic origin (detail)
- Mexican 3%
- Common ancestry
- Slovak 3% Lithuanian 2% Italian 2%
- Foreign-born
- 6% · Canada, Jamaica
- Languages at home
- 92% English-only · Spanish 4% Other Indo-European 1% Tagalog/Filipino 1%
Political lean MEDSL · Charleston
- 2024 margin
- Lean D (+5.7) · D 51.9% · R 46.3% · Other 1.8%
- 2008→2024 swing
- -2.7pp toward R · 2008: 8.3pp · 2024: 5.7pp
- All cycles
- 2024: D+5.7 2020: D+12.9 2016: D+7.9 2012: D+2.4 2008: D+8.3
Not yet ingested
- Civics
- —
Market trends
- HPI YoY
- ▼ -432.03%
- Current HPI
- 399.0894
- Rent YoY
- ▲ 2.18%
- Metro
- Charleston-North Charleston, SC
- State GDP YoY
- ▲ 4.51%
- F500 in state
- 2
Industry mix (Fortune 500 HQ in SC)
| Industry | F500 HQs | Revenue |
|---|---|---|
| Packaging | 1 | $7B |
|
||
Price history
2 events — show timeline
- 2026-05-09 Pending — Charleston Trident MLS
- 2026-05-06 Listed $295,000 Charleston Trident MLS
Property tax history
+2.1%/yrLatest (2022): $732 · -2.7% YoY. Source: county tax records.
Cash-flow waterfall
monthlySold comps — $/sqft
last 12 mo · ≤1 miLoading sold comps…