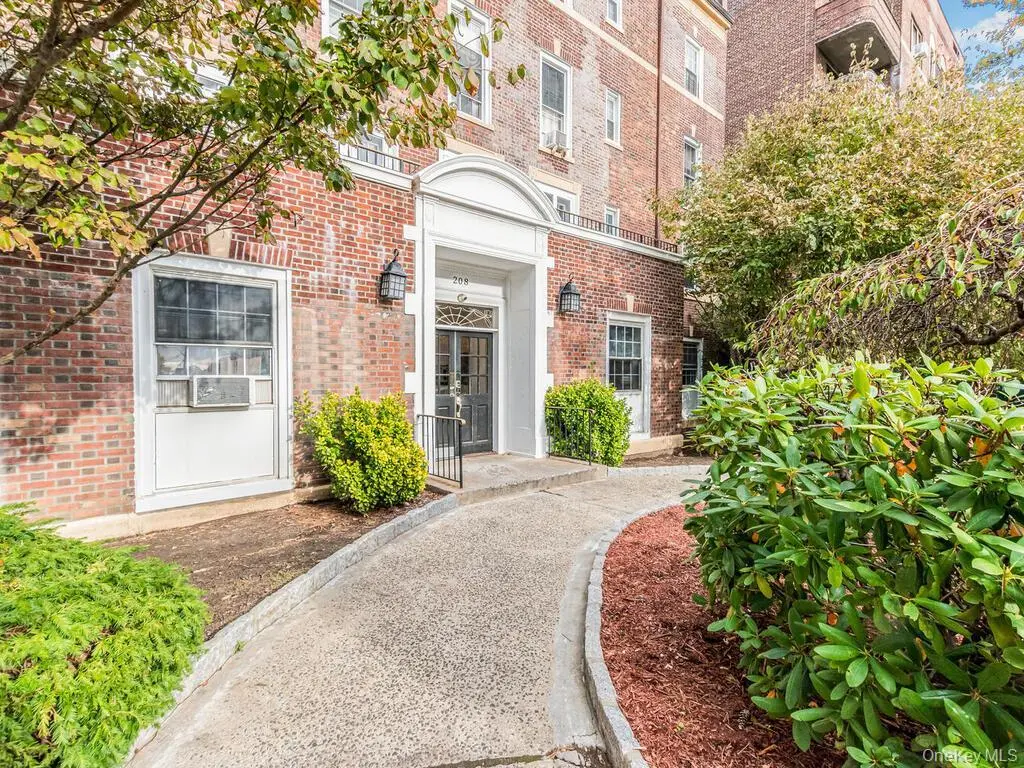
208 Centre Ave Unit 5k · New Rochelle, NY
Flood risk 1/10 · Minimal
- FEMA flood zone
- X (unshaded)
- Chance of flooding over 30 yrs
- 0.0%
- Est. flood insurance / yr
- $507 – $1,088
Fire risk 1/10 · Minimal
- Est. fire insurance / yr
- $691 – $1,283
Heat risk 6/10 · Moderate
- Hot days now (above 98°F)
- 7 days/yr
- Hot days in 30 yrs
- 15 days/yr
Wind risk 6/10 · Moderate
- Chance of severe wind over 30 yrs
- 27.0%
Air-quality risk 5/10 · Moderate
- Unhealthy air days now
- 6 days/yr
- Unhealthy air days in 30 yrs
- 8 days/yr
Risk factors via First Street. Map © Google.
Why this score? — see what drove the B+ grade
The composite is a weighted blend of 9 inputs, each scored 0–100. Each bar is that input's sub-score; the figure is the points it added to the 100-point composite (weight × sub-score).
- Cash flow +30.0/30.0
- 1% rule +10.0/10.0
- DSCR +10.0/10.0
- ARV discount +7.5/15.0
- Schools +5.7/10.0
- Appreciation +4.3/10.0
- Livability +3.5/5.0
- Rent growth +2.5/5.0
- Condition / age +2.5/5.0
$149,900
🖨 Deal sheet 📄 Offer letter ✓ Due diligence
Listing remarks
Welcome to this move in ready beautifully remodeled 1-bedroom, 1-bath cooperative located in a warm and friendly midrise building in the heart of New Rochelle. This home features hardwood floors and a kitchen equipped with stainless steel appliances. Conveniently situated near downtown New Rochelle, you’ll enjoy easy access to local markets, shops, restaurants, and transportation—including Metro-North, major highways, and bus lines—making commuting simple and efficient. The building offers well-maintained common areas that truly feels like home. unit also includes one dedicated basement storage space and oil-above-ground heating. Perfect for first-time buyers or those look
Key facts
- Built 1928
- Listed 102 days
Neighborhood map
What this means for you Summary
Snapshot
- This is a 1-bed/1.0-bath condo listed at $150k.
Deal economics
- At list price, monthly cash flow is $1k ($13k/yr) — positive.
- The deal already cash-flows at list — no discount required.
- Meets the 1% rule at list price ($3k rent vs $150k).
- Recommended offer: $136k (9.0% below list) — sets the bar for market timing.
- Cap rate 14.9% vs local median 4.5% in New Rochelle — top-decile yield for the area; either an underpriced asset or a hidden risk that comps aren't pricing in. Stress-test before assuming the spread holds.
Location & tenants
- Location reads 69/100 on livability (#487 in NY) — a middle-class / working-renter tenant base. Strengths: employment A+, crime A, amenities B+; Watch: housing D+, commute F, cost of living F.
- New Rochelle City School District (suburban): math 63% / reading 66% proficiency, ranked #171 of 590 in NY (top 29%) — acceptable for families but not a draw, mixed tenant base, ~2y average lease.
- Zoned schools: Trinity Elementary School (math 40% / reading 47%, grade F, #1,350 of 2,108 statewide, top 64%, 863 students, 66% FRL); Isaac E Young Middle School (math 47% / reading 62%, grade B-, #214 of 729 statewide, top 31%, 1,138 students, 76% FRL); New Rochelle High School (math 87% / reading 72%, grade A-, #518 of 1,100 statewide, top 51%, 3,076 students, 57% FRL) — zoned schools average 67% FRL vs 41% district-wide (26 pts higher); higher-poverty schools than district average — tighter screening recommended.
- Market conditions: 84 active listings in the ZIP; 40 comparable units currently listed for rent nearby; rentals leasing fast (median 11d on market — plan ~1-2 weeks tenant-placement turnaround); solid renter incomes; 954 units permitted in Westchester County in 2024 (649 in 5+ unit buildings).
- This rent runs 31% of the median local income ($102k/yr) — at the standard rent-burdened threshold; future hikes will face affordability resistance.
Forward outlook
- Local home prices are declining (-1.5%/yr); year-one equity from $1k of loan paydown is wiped out by about $2k of value loss. Plan a longer hold.
- Westchester County population projected at +10% by 2050 — modest demand growth; plan on rents tracking national, not racing it.
- At projected returns (-1.5% appreciation + 3.0% rent growth), your $42k cash investment doubles in ~4 years — after that, you're playing with house money.
Negotiation context
- It's been on market 102 days — a 9% lower offer ($136k) is reasonable based on typical stale-listing flexibility.
Risks & watch-outs
- Watch-outs: built in 1928 — expect roof / HVAC / electrical / plumbing capex.
- Climate carrying-cost: major wind risk, 27% chance of damaging wind over 30y; extreme-heat days projected 7→15/yr by 2055 (HVAC capex compounding) — expect insurance premiums to compound above CPI over the hold.
Questions for the listing agent
- It's been on market 102 days. Have you received any prior offers? Is the seller open to a 9% concession, seller financing, or rate buy-down credit?
- Built in 1928 — when were the roof, HVAC, electrical panel, plumbing, and water heater last replaced?
- Any open or pending special assessments — roof, HVAC, plumbing, elevator, façade? What's the per-unit balance and payoff schedule, and is the seller paying it off at close or rolling it to the buyer?
- Why hasn't it sold? Are there any deal-killer items the seller is aware of (foundation, flood, title, zoning, code violations)?
- Is there a deadline driving the sale (1031 exchange, divorce, estate, relocation)? That informs how much negotiation room exists.
- What's the average days-on-market for RENTAL listings here right now (not sales)? A rising rental-DOM trend means longer vacancies and softer asking-rent achievability than the comps imply.
- What's the recent tenant-quality profile in this submarket — average credit score on applications, eviction rate, late-payment / NSF rate, and stable-employment percentage? A property-management company in the area should have these aggregated.
- How much new apartment / multifamily construction is in the pipeline within 1–3 miles? Heavy new supply (>2% of stock underway) typically softens rents 12–24 months out; light construction supports rent growth.
Investment metrics
- 1% rule
- 1.78% ✓
- Cap rate
- 14.89%
- Cash-on-cash
- 30.70%
- DSCR
- 2.37
- GRM
- 4.7
CMA / ARV
No comps found within radius.
Projected returns pro-forma
-1.48% appreciation · 3.0% rent growth · sell at horizon
- IRR
- 28.5%
- Equity multiple
- 2.29×
- Total profit
- $53,957
- Equity at exit
- $32,783
- IRR
- 34.0%
- Equity multiple
- 4.44×
- Total profit
- $144,210
- Equity at exit
- $31,603
Cash invested: $41,972 (down + closing). Projections, not guarantees.
Landlord ↔ Tenant lean methodology
- Overall (STATE)
- 15 Strongly Tenant-Friendly
- State New York
- 15 Strongly Tenant-Friendly · D+10
- County
- — inherits STATE
- City
- — inherits STATE
ZIP-level market 10805
- Home prices YoY
- -0.5%
- Active inventory
- 84
- Price-to-rent
- 4.7×
Monthly cashflow live
- Estimated rent
- $2,671 high interval (Pro) →
- Mortgage (P&I)
- −$786
- Tax est. 1.5%
- −$187 /mo · $2,248/yr
- Insurance
- −$62
- HOA
- −$0
- Vacancy / Maint / Mgmt
- −$561
- Net cashflow
- $1,074
Break-even live
UW: 25.0% down · 7.5% · 30yr · 1.5% tax · 5.0% vac · 8.0% maint · 8.0% mgmt
Financing live
Cash to close
- Down payment
- $37,475
- Closing costs
- $4,497
- Reserves months
- —
- Total cash needed
- —
Loan-product check · same deal, 3 products live
Conventional
25% down · 7.5% · 30yr
- Down + closing
- —
- Monthly P&I
- —
- Monthly cashflow
- —
- DSCR
- —
- Eligible?
- —
Personal DTI + credit; lowest rate.
DSCR
20% down · 8.5% · 30yr
- Down + closing
- —
- Monthly P&I
- —
- Monthly cashflow
- —
- DSCR
- —
- Eligible?
- —
No personal income docs; deal must DSCR.
Hard money
10% down · 12.0% · 12mo
- Down + closing
- —
- Monthly P&I
- —
- Monthly cashflow
- —
- DSCR
- —
- Eligible?
- —
Short-term bridge; refi at stabilization.
Rent comps 40 comps
| Address | Beds | Baths | Sqft | Rent | $/sqft | DOM | Units | Dist |
|---|---|---|---|---|---|---|---|---|
| 79 S Division St Unit 3 New Rochelle, NY | 2.0 | 1.0 | 800 | $2,600 | $3.25 | 3d | 1 | 0.13mi |
| 50 Clinton Pl New Rochelle, NY | 2.0 | 1.0–2.0 | 844 | $5,007 | $5.93 | 1d | 31 | 0.24mi |
| 111 Centre Ave New Rochelle, NY | 1.0–2.0 | 1.0–2.0 | 787 | $2,847 | $3.62 | 1d | 17 | 0.27mi |
| 230 Pelham Rd Unit 6F New Rochelle, NY | 1.0 | 1.0 | 800 | $1,995 | $2.49 | 44d | 1 | 0.27mi |
| 220 Pelham Rd Unit 5E New Rochelle, NY | 2.0 | 1.0 | 1000 | $2,595 | $2.60 | 7d | 1 | 0.27mi |
| 220 Pelham Rd New Rochelle, NY | 1.0–2.0 | 1.0 | 862 | $2,195 | $2.54 | 1d | 2 | 0.27mi |
| 220 Pelham Rd New Rochelle, NY | 1.0–2.0 | 1.0 | 900 | $2,150 | $2.39 | 11d | 2 | 0.27mi |
| 55 Clinton Pl New Rochelle, NY | 2.0 | 1.0–2.0 | 910 | $3,721 | $4.09 | 1d | 28 | 0.28mi |
| 25 Maple Ave New Rochelle, NY | 2.0 | 1.0–2.0 | 748 | $3,054 | $4.08 | 4d | 12 | 0.28mi |
| 12 Church St New Rochelle, NY | 2.0 | 1.0–2.0 | 770 | $3,536 | $4.59 | 3d | 50 | 0.33mi |
| 46 Locust Ave Unit 2 New Rochelle, NY | 2.0 | 1.0 | 750 | $2,950 | $3.93 | 19d | 1 | 0.35mi |
| 360 Huguenot St New Rochelle, NY | 2.0 | 1.0–2.0 | 764 | $2,945 | $3.85 | 2d | 15 | 0.35mi |
| 543 Main St #402 New Rochelle, NY | 1.0 | 1.0 | 924 | $3,000 | $3.25 | 15d | 1 | 0.36mi |
| 387 Huguenot St New Rochelle, NY | 2.0 | 1.0–2.0 | 753 | $2,808 | $3.73 | 4d | 6 | 0.37mi |
| 333 Huguenot St New Rochelle, NY | 2.0 | 1.0–2.0 | 853 | $3,562 | $4.17 | 2d | 12 | 0.40mi |
| 40 Memorial Hwy New Rochelle, NY | 3.0 | 1.0–2.0 | 917 | $3,158 | $3.44 | 1d | 51 | 0.41mi |
| 325 Huguenot St New Rochelle, NY | 1.0–2.0 | 1.0–2.0 | 989 | $2,855 | $2.89 | 5d | 8 | 0.42mi |
| 3 Davenport Ave New Rochelle, NY | 1.0 | 1.0 | 821 | $2,099 | $2.56 | 6d | 1 | 0.43mi |
| 10 Lecount Pl New Rochelle, NY | 2.0 | 1.0–2.0 | 740 | $3,764 | $5.08 | 1d | 14 | 0.44mi |
| 1 Shearwood Pl New Rochelle, NY | 3.0 | 1.0–2.0 | 896 | $2,922 | $3.26 | 2d | 31 | 0.50mi |
| 12 Russell Ave Apt 2 New Rochelle, NY | 2.0 | 1.0 | 800 | $2,350 | $2.94 | 7d | 1 | 0.59mi |
| 7 Lanecrest Ave New Rochelle, NY | 2.0 | 1.0 | 1100 | $2,690 | $2.45 | 17d | 1 | 0.61mi |
| 504 Pelham Rd New Rochelle, NY | 1.0 | 1.0 | 700 | $2,300 | $3.29 | 13d | 1 | 0.65mi |
| 20 Burling Ln New Rochelle, NY | 1.0 | 1.0 | 725 | $3,110 | $4.29 | 10d | 10 | 0.67mi |
| 10 Commerce Dr New Rochelle, NY | 2.0 | 1.0–2.0 | 792 | $3,094 | $3.91 | 1d | 11 | 0.70mi |
| 11 Park Pl New Rochelle, NY | 1.0 | 1.0 | 1015 | $2,700 | $2.66 | 44d | 1 | 0.80mi |
| 245 Main St Unit 1 New Rochelle, NY | 1.0 | 1.0 | 750 | $1,750 | $2.33 | 17d | 1 | 0.83mi |
| 29 Pratt St Unit 2 New Rochelle, NY | 2.0 | 1.0 | 800 | $2,600 | $3.25 | 44d | 1 | 0.87mi |
| 3 Harbor Ln Unit 3A New Rochelle, NY | 1.0 | 1.0 | 700 | $2,500 | $3.57 | 24d | 1 | 0.87mi |
| 36 4th St Unit One New Rochelle, NY | 2.0 | 1.0 | 900 | $2,900 | $3.22 | 4d | 1 | 0.90mi |
| 139 Sickles Ave Unit 2 New Rochelle, NY | 2.0 | 1.5 | 1000 | $3,100 | $3.10 | 21d | 1 | 0.95mi |
| 49 5th St Apt 8 New Rochelle, NY | 2.0 | 1.0 | 800 | $2,429 | $3.04 | 44d | 1 | 0.97mi |
| 49 5th St Apt 8 New Rochelle, NY | 2.0 | 1.0 | 800 | $2,429 | $3.04 | 13d | 1 | 0.97mi |
| 299 Webster Ave Unit 3F New Rochelle, NY | 1.0 | 1.0 | 861 | $2,385 | $2.77 | 44d | 1 | 0.97mi |
| 666 Pelham Rd Apt 3A New Rochelle, NY | 1.0 | 1.0 | 750 | $2,350 | $3.13 | 44d | 1 | 0.99mi |
| 965 Main St Unit 2 New Rochelle, NY | 2.0 | 1.0 | 825 | $2,995 | $3.63 | 7d | 1 | 1.02mi |
| 274 Lockwood Ave Unit First floor New Rochelle, NY | 2.0 | 1.0 | 908 | $2,700 | $2.97 | 44d | 1 | 1.02mi |
| 225 Sickles Ave Unit 1 New Rochelle, NY | 1.0 | 1.0 | 750 | $2,600 | $3.47 | 44d | 1 | 1.05mi |
| 17 Dewitt Pl New Rochelle, NY | 2.0 | 1.0 | 550 | $2,500 | $4.55 | 44d | 1 | 1.11mi |
| 9 9th St Unit 3rd Floor New Rochelle, NY | 1.0 | 1.0 | 750 | $2,100 | $2.80 | 44d | 1 | 1.12mi |
HOA detail condo
- Monthly dues
- $0 · $0/yr
- Assessments
- None detected in remarks — confirm with the listing agent.
Listing history 4 events
-
2026-03-02status Pending
-
2026-01-20price $149,900
-
2025-11-21$154,900 Active
-
2025-11-18historical $154,900
ⓘ Source: listings_history table (triggers on properties + properties_extension) + one-shot
backfill from property_details.listing_events for pre-trigger history.
Climate risk First Street
- Flood 1/10 Low FEMA zone X (unshaded) · 0% chance over 30 yrs
- Wildfire 1/10 Low
- Heat 6/10 Major 7 d/yr ≥98°F today · 15 d/yr by 30 yrs out
- Wind 6/10 Major 27% chance of damaging wind over 30 yrs
- Air quality 5/10 Major 6 unhealthy d/yr today · 8 by 30 yrs out
Nearby sold comps map
Loading sold comps map…
Walkable amenities ~0.75 mi
Loading nearby amenities…
Taxation est. · year 1
- Rental income
- $32,049
- − Mortgage interest
- −$8,397
- − Property taxes
- −$2,248
- − Insurance
- −$750
- − Repairs & maintenance
- −$2,564
- − Management
- −$2,564
- − Depreciation
- −$4,361
- Taxable income
- $11,166
- Est. tax owed @ 24.0%
- −$2,680
- After-tax cash flow
- $10,208/yr
For passive investors: Depreciation is non-cash, so a rental often shows a tax loss while cash-flowing — sheltering income. Rental losses are passive: they offset passive income freely, and up to $25,000/yr can offset ordinary (W-2) income if you actively participate and your MAGI is under $100k (phasing out to $0 by $150k); unused losses carry forward. On sale, claimed depreciation is recaptured at up to 25%, and gains may owe capital-gains tax (a 1031 exchange can defer both). Figures are a year-1 estimate at your 24.0% rate — not tax advice; consult a CPA.
Schools (NCES district)
- District
- New Rochelle City School District
- NCES district ID
- 3620490
- Math proficiency
- 63% ▲ 3.00%
- Reading proficiency
- 66% ▲ 9.00%
- Median HH income
- $69,165
- Composite
- 56.63/100
- National rank
- #1139
- State rank
- #171 of 590 in NY
Livability — New Rochelle
- Score
- 69/100
- State rank
- #487
- US rank
- #8572
Category grades
Schools grade is shown separately in the Schools card above.
Census & demographics
- Census place
- New Rochelle, NY
- County
- Westchester County · 709,332 people
- City population
- 63,657
- Metro
- New York-Newark-Jersey City, NY-NJ-PA
- Population (ZIP)
- 20,903
- Household income
- $102,109
- Rent vs Own
- Severe rent burden
- 961.0
Population outlook (Westchester County) Hauer SSP2
- Today (2025)
- 1,028,035 people
- By 2030
- 1,051,636 · +2.3%
- By 2040
- 1,098,520 · +6.9%
- By 2050
- 1,136,044 · +10.5%
- By 2075
- 1,196,925 · +16.4%
- By 2100
- 1,175,147 · +14.3%
Race, ethnicity, and origin ACS 2023
- Neighborhood character
- Diverse neighborhood (Simpson 0.67)
- Race & ethnicity
- Hispanic / Latino 39% White 38% Black 17% Two or more races 13% Asian 4%
- Hispanic origin (detail)
- Mexican 15% Puerto Rican 11% Dominican 2%
- Common ancestry
- Romanian 2% Russian 1% Scotch-Irish 1%
- Foreign-born
- 32% · Canada, Jamaica, South Korea
- Languages at home
- 54% English-only · Spanish 32% Other Indo-European 7% German/W. Germanic 2%
Political lean MEDSL · Westchester
- 2024 margin
- Strong D (+26.3) · D 63.1% · R 36.9%
- 2008→2024 swing
- -1.3pp toward R · 2008: 27.6pp · 2024: 26.3pp
- All cycles
- 2024: D+26.3 2020: D+36.3 2016: D+32.8 2012: D+22.2 2008: D+27.6
Not yet ingested
- Civics
- —
Market trends
- HPI YoY
- ▼ -1.48%
- Current HPI
- 278.8511
- Rent YoY
- —
- Metro
- New York-Newark-Jersey City, NY-NJ-PA
- State GDP YoY
- ▲ 2.60%
- F500 in state
- 92
Industry mix (Fortune 500 HQ in NY)
| Industry | F500 HQs | Revenue |
|---|---|---|
| Financial Services | 10 | $950B |
|
||
| Consumer Goods | 9 | $162B |
|
||
| Insurance | 4 | $225B |
|
||
| Telecommunications | 2 | $144B |
|
||
| Pharmaceuticals | 2 | $112B |
|
||
| Media / Entertainment | 2 | $69B |
|
||
Price history
-3.2% since first listed4 events — show timeline
- 2026-03-02 Pending — OneKey® MLS as Distributed by MLS Grid
- 2026-01-20 Price Changed $149,900 OneKey® MLS as Distributed by MLS Grid
- 2025-11-21 Listed $154,900 OneKey® MLS as Distributed by MLS Grid
- 2025-11-18 Coming Soon $154,900 OneKey® MLS as Distributed by MLS Grid
Cash-flow waterfall
monthlySold comps — $/sqft
last 12 mo · ≤1 miLoading sold comps…