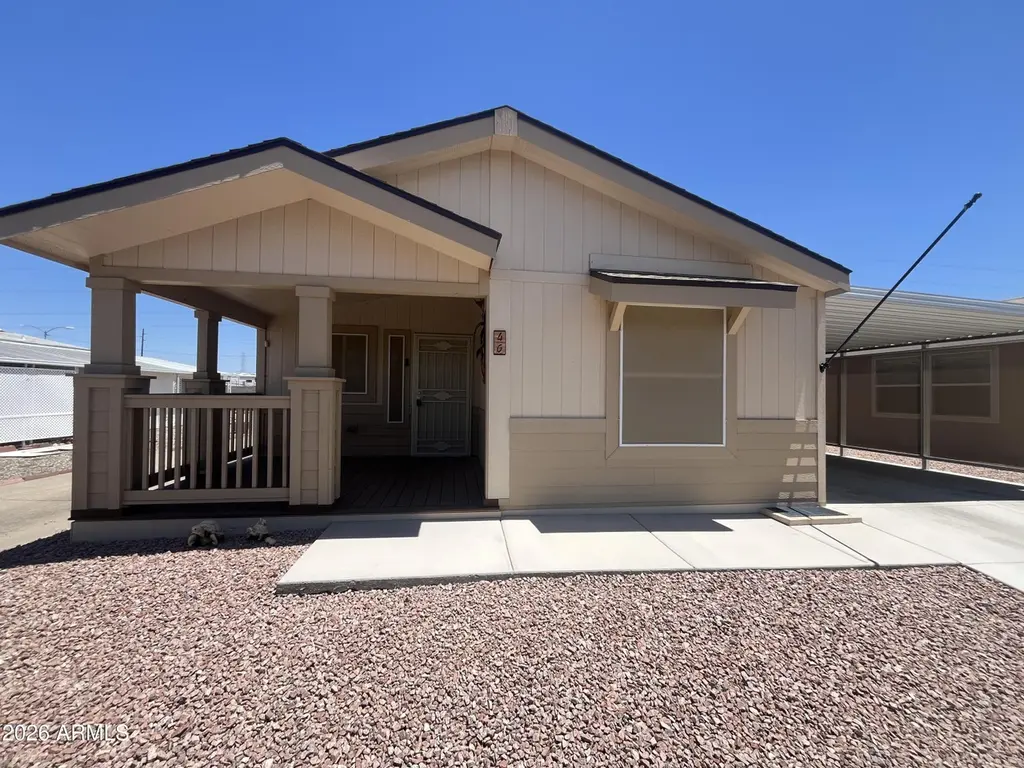
11596 W Sierra Dawn Blvd #46 · Surprise, AZ
Flood risk 1/10 · Minimal
- FEMA flood zone
- X (shaded)
- Chance of flooding over 30 yrs
- 0.0%
- Est. flood insurance / yr
- $507 – $1,088
Fire risk 3/10 · Minor
- Est. fire insurance / yr
- $610 – $1,132
Heat risk 9/10 · Severe
- Hot days now (above 114°F)
- 7 days/yr
- Hot days in 30 yrs
- 16 days/yr
Wind risk 1/10 · Minimal
- Chance of severe wind over 30 yrs
- —
Air-quality risk 2/10 · Minimal
- Unhealthy air days now
- 1 days/yr
- Unhealthy air days in 30 yrs
- 1 days/yr
Risk factors via First Street. Map © Google.
Why this score? — see what drove the C+ grade
The composite is a weighted blend of 9 inputs, each scored 0–100. Each bar is that input's sub-score; the figure is the points it added to the 100-point composite (weight × sub-score).
- Cash flow +23.3/30.0
- DSCR +7.5/10.0
- ARV discount +7.5/15.0
- 1% rule +6.1/10.0
- Appreciation +5.1/10.0
- Condition / age +4.0/5.0
- Livability +3.7/5.0
- Schools +3.3/10.0
- Rent growth +1.1/5.0
$166,500
🖨 Deal sheet 📄 Offer letter ✓ Due diligence
Listing remarks
STEP INSIDE THIS NEWER HOME! Move In ready! With tasteful fixtures, recessed lighting, extra long carport, Large Storage shed, fenced back yard, and new roof done in 2023! Located In the 55+Community of Rose Garden , With Tons of amenities! Pickleball, 2DOG parks with agility equipment, Work out facility, Sauna, Spa, Pool, and tons of activities! and MUCH MUCH MORE!
Key facts
- Dog parks
- Fenced back yard
- Pickleball
Tags
Property features AI
Finance
- Other: Land lease amount displayed separately from association fees
- Financial info: Conventional financing available
- HOA & community: Land lease (monthly); Monthly land lease fee; Association covers water, sewer, trash, and grounds maintenance; Community amenities: pool, heated community spa, pickleball courts, fitness center, community media room, biking/walking paths; Coin-op laundry in community; No visible truck/trailer/RV/boat allowed
Exterior
- Parking: 2 covered parking spaces; 2 carport spaces
- Security: Gated community
- Utilities: City water; Public sewer
- Home design: Manufactured/mobile home; Leasehold ownership
- Construction: Wood frame construction; Painted exterior; Composition roof
- Exterior features: Private yard; Storage; Cul-de-sac lot; Gravel/stone front and back
Interior
- Kitchen: Built-in microwave; Kitchen island; Laminate counters; Pantry; Refrigerator; Dishwasher; Garbage disposal
- Bedrooms: 2 possible bedrooms
- Flooring: Carpet; Linoleum
- Bathrooms: 2 full bathrooms
- Heating & cooling: Electric heating; Central air conditioning
- Interior features: High-speed internet; Double vanity; Eat-in kitchen; No interior steps; Vaulted ceilings; Kitchen island; Pantry; 3/4 bath in primary bedroom; Laminate counters; Solar screens on windows; Dual-pane windows
- Laundry & utility: Coin-operated laundry available in community
Neighborhood map
What this means for you Summary
Snapshot
- This is a 2-bed/2.0-bath manufactured listed at $166k. Condition is rated good.
Deal economics
- At list price, monthly cash flow is $305 ($4k/yr) — positive.
- The deal already cash-flows at list — no discount required.
- Meets the 1% rule at list price ($2k rent vs $166k).
- Recommended offer: $162k (3.0% below list) — sets the bar for market timing.
- Cap rate 8.5% vs local median 3.3% in Surprise — top-decile yield for the area; either an underpriced asset or a hidden risk that comps aren't pricing in. Stress-test before assuming the spread holds.
Location & tenants
- Location reads 74/100 on livability (#19 in AZ, #4,616 nationally) — a middle-class / working-renter tenant base. Strengths: crime A+, housing A+, employment A-; Watch: health & safety D+, amenities D-, commute F.
- Dysart Unified District (4243) (suburban): math 34% / reading 40% proficiency, ranked #73 of 249 in AZ (top 29%) — families likely to look elsewhere, expect single-tenant / working-renter base with shorter leases.
- Market conditions: Rents falling (-5.5%/yr); 76 active listings in the ZIP; 20 comparable units currently listed for rent nearby; rentals at typical pace (median 20d on market — plan ~3-4 weeks tenant-placement turnaround); 36,011 units permitted in Maricopa County in 2024 (12,801 in 5+ unit buildings).
- This rent runs 39% of the median local income ($56k/yr) — at the standard rent-burdened threshold; future hikes will face affordability resistance.
Forward outlook
- In year one you build about $1k of equity ($1k loan paydown + $295 appreciation (0.2% local appreciation)).
- Maricopa County population projected at +38% by 2050 — long-run rental-demand tailwind backs the buy-and-hold thesis.
- At projected returns (0.2% appreciation + 0.0% rent growth), your $47k cash investment doubles in ~9 years — after that, you're playing with house money.
Negotiation context
- It's been on market 33 days — a 3% lower offer ($162k) is reasonable based on typical stale-listing flexibility.
- 2 sale attempts with the ask held roughly flat each time — persistent listings suggest the price (not the market) is what's stuck; bring a comps-based counter.
Risks & watch-outs
- Climate carrying-cost: extreme-heat days projected 7→16/yr by 2055 (HVAC capex compounding) — expect insurance premiums to compound above CPI over the hold.
Questions for the listing agent
- It's been on market 33 days. Have you received any prior offers? Is the seller open to a 3% concession, seller financing, or rate buy-down credit?
- Is there a deadline driving the sale (1031 exchange, divorce, estate, relocation)? That informs how much negotiation room exists.
- What's the average days-on-market for RENTAL listings here right now (not sales)? A rising rental-DOM trend means longer vacancies and softer asking-rent achievability than the comps imply.
- What's the recent tenant-quality profile in this submarket — average credit score on applications, eviction rate, late-payment / NSF rate, and stable-employment percentage? A property-management company in the area should have these aggregated.
- How much new for-sale + rental construction is in the pipeline within 1–3 miles? Heavy new supply typically softens prices + rents 12–24 months out; constrained supply supports both.
Investment metrics
- 1% rule
- 1.11% ✓
- Cap rate
- 8.49%
- Cash-on-cash
- 7.85%
- DSCR
- 1.35
- GRM
- 7.5
CMA / ARV
- ARV (on-the-fly)
- $91,392
- Comps found
- 12
Show comp detail 12 sales within ~0.75 mi
| Address | Dist | Beds/Ba | Sqft | Sold | Price | $/sf | Match |
|---|---|---|---|---|---|---|---|
| 11596 W Sierra Dawn Blvd #33 | 0.09mi | 3/2.0 (+1) | 1,344 (0%) | 4mo | $112,000 | $83 | 87 |
| 11596 W Sierra Dawn Blvd #25 | 0.09mi | 3/2.0 (+1) | 1,320 (-2%) | 2mo | $92,000 | $70 | 86 |
| 11596 W Sierra Dawn Blvd #165 | 0.18mi | 2/2.0 | 1,296 (-4%) | 1mo | $94,500 | $73 | 85 |
| 11596 W Sierra Dawn Blvd #134 | 0.09mi | 3/2.0 (+1) | 1,352 (+1%) | 9mo | $75,000 | $55 | 82 |
| 11596 W Sierra Dawn Blvd #182 | 0.09mi | 2/2.0 | 1,456 (+8%) | 9mo | $70,000 | $48 | 74 |
| 11596 W Sierra Dawn Blvd #188 | 0.25mi | 2/2.0 | 1,456 (+8%) | 2mo | $80,000 | $55 | 73 |
| 11596 W Sierra Dawn Blvd #243 | 0.09mi | 2/2.0 | 1,203 (-10%) | 7mo | $135,000 | $112 | 73 |
| 11596 W Sierra Dawn Blvd #80 | 0.09mi | 2/2.0 | 1,536 (+14%) | 1mo | $120,000 | $78 | 71 |
| 11596 W Sierra Dawn Blvd #75 | 0.09mi | 2/2.0 | 1,152 (-14%) | 6mo | $62,000 | $54 | 67 |
| 11596 W Sierra Dawn Blvd #23 | 0.25mi | 2/2.0 | 1,173 (-13%) | 5mo | $79,990 | $68 | 63 |
| 11596 W Sierra Dawn Blvd #29 | 0.25mi | 2/2.0 | 1,534 (+14%) | 5mo | $73,500 | $48 | 61 |
| 11596 W Sierra Dawn Blvd #271 | 0.39mi | 3/2.0 (+1) | 1,456 (+8%) | 8mo | $74,000 | $51 | 57 |
Match score weights: distance 35% · size 25% · config 20% · recency 20%. Top-matched comps best support the ARV.
Projected returns pro-forma
0.18% appreciation · 0.0% rent growth · sell at horizon
- IRR
- 4.8%
- Equity multiple
- 1.23×
- Total profit
- $10,560
- Equity at exit
- $49,824
- IRR
- 7.7%
- Equity multiple
- 1.79×
- Total profit
- $36,865
- Equity at exit
- $61,084
Cash invested: $46,620 (down + closing). Projections, not guarantees.
Landlord ↔ Tenant lean methodology
- Overall (STATE)
- 87 Strongly Landlord-Friendly
- State Arizona
- 87 Strongly Landlord-Friendly · R+3
- County
- — inherits STATE
- City
- — inherits STATE
ZIP-level market 85378
- Home prices YoY
- 0.1%
- Rents YoY
- -5.5%
- Active inventory
- 76
- Price-to-rent
- 7.5×
Monthly cashflow live
- Estimated rent
- $1,842 high interval (Pro) →
- Mortgage (P&I)
- −$873
- Tax est. 1.5%
- −$208 /mo · $2,498/yr
- Insurance
- −$69
- HOA
- −$0
- Vacancy / Maint / Mgmt
- −$387
- Net cashflow
- $305
Break-even live
UW: 25.0% down · 7.5% · 30yr · 1.5% tax · 5.0% vac · 8.0% maint · 8.0% mgmt
Financing live
Cash to close
- Down payment
- $41,625
- Closing costs
- $4,995
- Reserves months
- —
- Total cash needed
- —
Loan-product check · same deal, 3 products live
Conventional
25% down · 7.5% · 30yr
- Down + closing
- —
- Monthly P&I
- —
- Monthly cashflow
- —
- DSCR
- —
- Eligible?
- —
Personal DTI + credit; lowest rate.
DSCR
20% down · 8.5% · 30yr
- Down + closing
- —
- Monthly P&I
- —
- Monthly cashflow
- —
- DSCR
- —
- Eligible?
- —
No personal income docs; deal must DSCR.
Hard money
10% down · 12.0% · 12mo
- Down + closing
- —
- Monthly P&I
- —
- Monthly cashflow
- —
- DSCR
- —
- Eligible?
- —
Short-term bridge; refi at stabilization.
Rent comps 20 comps
| Address | Beds | Baths | Sqft | Rent | $/sqft | DOM | Units | Dist |
|---|---|---|---|---|---|---|---|---|
| 11345 W Loma Blanca Dr Surprise, AZ | 3.0 | 2.0 | 1368 | $1,930 | $1.41 | 43d | 1 | 0.29mi |
| 11417 W Amber Trl Surprise, AZ | 3.0 | 2.0 | 1130 | $1,750 | $1.55 | 5d | 1 | 0.33mi |
| 17447 Avenue of the Arts Unit 2 Surprise, AZ | 2.0 | 2.0 | 1078 | $1,732 | $1.61 | 24d | 1 | 0.73mi |
| 17447 Avenue of the Arts Unit 3 Surprise, AZ | 3.0 | 2.0 | 1183 | $1,822 | $1.54 | 24d | 1 | 0.73mi |
| 17447 N Avenue of the Arts Surprise, AZ | 3.0 | 2.0 | 1183 | $1,981 | $1.67 | 1d | 1 | 0.80mi |
| 17447 N Avenue of the Arts Surprise, AZ | 2.0 | 2.0 | 1078 | $1,813 | $1.68 | 12d | 1 | 0.80mi |
| 12121 W Ironwood St El Mirage, AZ | 3.0 | 2.0 | 1680 | $1,999 | $1.19 | 24d | 1 | 0.84mi |
| 17590 N 114th Ln Surprise, AZ | 3.0 | 3.0 | 1737 | $1,695 | $0.98 | 5d | 1 | 0.86mi |
| 17590 N 114th Ln Surprise, AZ | 3.0 | 2.5 | 1737 | $1,695 | $0.98 | 24d | 1 | 0.86mi |
| 12134 W Ironwood St El Mirage, AZ | 3.0 | 2.0 | 1680 | $1,950 | $1.16 | 24d | 1 | 0.86mi |
| 15620 N El Mirage Rd Surprise, AZ | 3.0 | 2.5 | 1310 | $1,599 | $1.22 | 24d | 2 | 1.08mi |
| 10831 W Tropicana Cir Sun City, AZ | 2.0 | 1.0 | 995 | $2,800 | $2.81 | 20d | 1 | 1.14mi |
| 15427 N Jerry St Surprise, AZ | 2.0 | 1.5 | 920 | $1,450 | $1.58 | 5d | 1 | 1.17mi |
| 10814 W El Capitan Cir Sun City, AZ | 2.0 | 1.0 | 995 | $3,000 | $3.02 | 15d | 1 | 1.18mi |
| 16629 N Greasewood St Surprise, AZ | 2.0 | 1.5 | 1052 | $1,462 | $1.39 | 2d | 3 | 1.20mi |
| 16520 N Greasewood St Surprise, AZ | 2.0–3.0 | 2.5 | 1267 | $1,695 | $1.34 | 2d | 17 | 1.28mi |
| 11476 W Madisen Ellise Dr Surprise, AZ | 3.0 | 2.0 | 1301 | $2,070 | $1.59 | 43d | 1 | 1.28mi |
| 11755 W Thompson Ranch Rd El Mirage, AZ | 1.0–3.0 | 1.0–2.0 | 936 | $2,017 | $2.15 | 1d | 1 | 1.29mi |
| 12437 W Via Camille El Mirage, AZ | 3.0 | 2.0 | 1534 | $1,875 | $1.22 | 16d | 1 | 1.48mi |
| 12438 W Hearn Rd El Mirage, AZ | 3.0 | 2.0 | 1308 | $1,595 | $1.22 | 24d | 1 | 1.50mi |
Listing history 17 events
-
2026-06-18days on market $166,500 Active 33 DOM
-
2026-06-17days on market $166,500 Active 32 DOM
-
2026-06-16days on market $166,500 Active 31 DOM
-
2026-06-15days on market $166,500 Active 30 DOM
-
2026-06-13days on market $166,500 Active 28 DOM
-
2026-06-09days on market $166,500 Active 24 DOM
-
2026-06-08days on market $166,500 Active 23 DOM
-
2026-06-07days on market $166,500 Active 22 DOM
-
2026-06-04days on market $166,500 Active 19 DOM
-
2026-06-03days on market $166,500 Active 18 DOM
-
2026-06-02days on market $166,500 Active 17 DOM
-
2026-06-01days on market $166,500 Active 16 DOM
-
2026-05-31days on market $166,500 Active 15 DOM
-
2026-05-15$166,500 Active
-
2026-04-01historical
-
2025-10-28price $167,900
-
2025-09-08$169,900 Active
ⓘ Source: listings_history table (triggers on properties + properties_extension) + one-shot
backfill from property_details.listing_events for pre-trigger history.
Climate risk First Street
- Flood 1/10 Low FEMA zone X (shaded) · 0% chance over 30 yrs
- Wildfire 3/10 Moderate
- Heat 9/10 Extreme 7 d/yr ≥114°F today · 16 d/yr by 30 yrs out
- Wind 1/10 Low
- Air quality 2/10 Low 1 unhealthy d/yr today · 1 by 30 yrs out
Nearby sold comps map
Loading sold comps map…
Walkable amenities ~0.75 mi
Loading nearby amenities…
Taxation est. · year 1
- Rental income
- $22,108
- − Mortgage interest
- −$9,327
- − Property taxes
- −$2,498
- − Insurance
- −$832
- − Repairs & maintenance
- −$1,769
- − Management
- −$1,769
- − Depreciation
- −$4,844
- Taxable income
- $1,071
- Est. tax owed @ 24.0%
- −$257
- After-tax cash flow
- $3,401/yr
For passive investors: Depreciation is non-cash, so a rental often shows a tax loss while cash-flowing — sheltering income. Rental losses are passive: they offset passive income freely, and up to $25,000/yr can offset ordinary (W-2) income if you actively participate and your MAGI is under $100k (phasing out to $0 by $150k); unused losses carry forward. On sale, claimed depreciation is recaptured at up to 25%, and gains may owe capital-gains tax (a 1031 exchange can defer both). Figures are a year-1 estimate at your 24.0% rate — not tax advice; consult a CPA.
Condition & rehab AI · 13 photos
This move-in ready manufactured home is in good condition with a new roof and tasteful fixtures. It's located in a 55+ community with amenities, making it an attractive option for buyers and renters.
Value-add opportunities
- Both Paint exterior — Enhances curb appeal and value
- Both Replace carpet with tile — Improves durability and appearance
- Both Install smart home features — Attracts tech-savvy buyers and renters
Renovation cost estimate screening
Value-add ROI direction
- Both Paint exterior — Enhances curb appeal and value ↑
- Both Replace carpet with tile — Improves durability and appearance ↑
- Both Install smart home features — Attracts tech-savvy buyers and renters ↑
ⓘ Cost ranges are severity-bucket heuristics (US national rule-of-thumb). Get contractor quotes + a written scope before underwriting a rehab budget.
Schools (NCES district)
- District
- Dysart Unified District (4243)
- NCES district ID
- 0402690
- Math proficiency
- 34% ▼ -10.00%
- Reading proficiency
- 40% ▼ -5.00%
- Median HH income
- $58,033
- Composite
- 32.76/100
- National rank
- #5634
- State rank
- #73 of 249 in AZ
Livability — Surprise
- Score
- 74/100
- State rank
- #19
- US rank
- #4616
Category grades
Schools grade is shown separately in the Schools card above.
Census & demographics
- Census place
- Surprise, AZ
- County
- Maricopa County · 4,537,380 people
- City population
- 160,031
- Metro
- Phoenix-Mesa-Chandler, AZ
- Population (ZIP)
- 9,765
- Household income
- $56,444
- Rent vs Own
- Severe rent burden
- 510.0
Population outlook (Maricopa County) Hauer SSP2
- Today (2025)
- 4,979,203 people
- By 2030
- 5,378,229 · +8.0%
- By 2040
- 6,156,598 · +23.6%
- By 2050
- 6,872,376 · +38.0%
- By 2075
- 8,401,270 · +68.7%
- By 2100
- 9,247,439 · +85.7%
Race, ethnicity, and origin ACS 2023
- Neighborhood character
- Diverse neighborhood (Simpson 0.56)
- Race & ethnicity
- White 54% Hispanic / Latino 38% Two or more races 17% Black 4% Native American 1%
- Hispanic origin (detail)
- Mexican 31% Cuban 3%
- Common ancestry
- Romanian 2% Portuguese 2% Lithuanian 1%
- Foreign-born
- 9% · Canada, Guatemala
- Languages at home
- 73% English-only · Spanish 22% Arabic 2% Russian/Polish/Slavic 1%
Political lean MEDSL · Maricopa
- 2024 margin
- Toss-up / Even · D 47.7% · R 51.2% · Other 1.1%
- 2008→2024 swing
- +7.1pp toward D · 2008: -10.6pp · 2024: -3.5pp
- All cycles
- 2024: R+3.5 2020: D+2.2 2016: R+3.5 2012: R+12.0 2008: R+10.6
Not yet ingested
- Civics
- —
Market trends
- HPI YoY
- ▲ 0.18%
- Current HPI
- 287.1228
- Rent YoY
- ▼ -5.53%
- Metro
- Phoenix-Mesa-Chandler, AZ
- State GDP YoY
- ▲ 4.54%
- F500 in state
- 20
Industry mix (Fortune 500 HQ in AZ)
| Industry | F500 HQs | Revenue |
|---|---|---|
| Technology | 2 | $13B |
|
||
| Mining / Metals | 1 | $23B |
|
||
| Environmental Services | 1 | $16B |
|
||
| Metals / Steel | 1 | $14B |
|
||
| Technology Distribution | 1 | $9B |
|
||
| Homebuilding | 1 | $8B |
|
||
Price history
-2.0% since first listed4 events — show timeline
- 2026-05-15 Listed $166,500 ARMLS
- 2026-04-01 Listing Removed — ARMLS
- 2025-10-28 Price Changed $167,900 ARMLS
- 2025-09-08 Listed $169,900 ARMLS
Cash-flow waterfall
monthlySold comps — $/sqft
last 12 mo · ≤1 miLoading sold comps…