 🏷️ Likely Rental
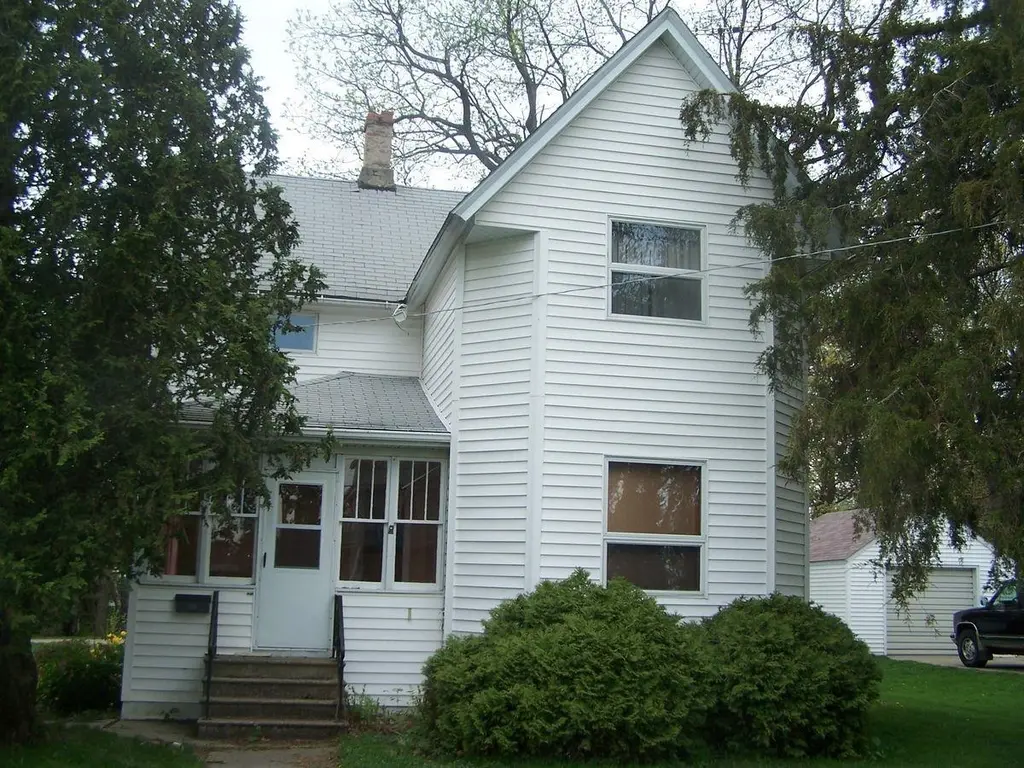
705 W Main · Warren, IL
Flood risk 1/10 · Minimal
- FEMA flood zone
- X (unshaded)
- Chance of flooding over 30 yrs
- 0.0%
- Est. flood insurance / yr
- $507 – $1,088
Fire risk 1/10 · Minimal
- Est. fire insurance / yr
- $804 – $1,492
Heat risk 2/10 · Minimal
- Hot days now (above 99°F)
- 7 days/yr
- Hot days in 30 yrs
- 15 days/yr
Wind risk 2/10 · Minimal
- Chance of severe wind over 30 yrs
- —
Air-quality risk 2/10 · Minimal
- Unhealthy air days now
- 1 days/yr
- Unhealthy air days in 30 yrs
- 1 days/yr
Risk factors via First Street. Map © Google.
Why this score? — see what drove the B+ grade
The composite is a weighted blend of 9 inputs, each scored 0–100. Each bar is that input's sub-score; the figure is the points it added to the 100-point composite (weight × sub-score).
- Cash flow +25.1/30.0
- ARV discount +15.0/15.0
- Appreciation +10.0/10.0
- DSCR +8.2/10.0
- 1% rule +6.8/10.0
- Schools +3.9/10.0
- Livability +3.7/5.0
- Rent growth +2.5/5.0
- Condition / age +2.5/5.0
$98,000
🖨 Deal sheet (PDF) 📄 Offer letter ✓ Due diligence
Listing remarks
Solid two story with main floor laundry. Large eat in kitchen. Natural woodwork. Alley access to garage and off-street parking. Presently home is a rental with a long-time tenant. Home offers great opportunity or an investor as rental or would make a great affordable starter.
Key facts
- Natural woodwork
- Alley access
- Large eat in kitchen
Tags
Property features AI
Exterior
- Parking: Detached 1-car garage
- Utilities: Public water; Public sewer
- Home design: Residential single-family house; 2 stories
- Exterior features: Shingle roof; 0.2-acre lot
Interior
- Kitchen: Electric cooktop; Refrigerator
- Bathrooms: 1 full bathroom; 1 half bathroom
- Heating & cooling: Forced air heating; Natural gas heating
- Interior features: Electric cooktop; Refrigerator; Gas water heater; Full basement
Neighborhood map
What this means for you Summary
Snapshot
- This is a 3-bed/1.5-bath other listed at $98k.
Deal economics
- At list price, monthly cash flow is $215 ($3k/yr) — positive.
- The deal already cash-flows at list — no discount required.
- Meets the 1% rule at list price ($1k rent vs $98k).
- Recommended offer: $95k (3.0% below list) — sets the bar for market timing.
Location & tenants
- Location reads 73/100 on livability (#290 in IL) — a middle-class / working-renter tenant base. Strengths: crime A+, cost of living A+, housing A+; Watch: employment C-, amenities F, commute F.
- Warren CUSD 205 (rural): math 40% / reading 45% proficiency, ranked #273 of 919 in IL (top 30%) — families likely to look elsewhere, expect single-tenant / working-renter base with shorter leases.
- Zoned schools: Warren Elementary School (math 42% / reading 47%, grade F, #267 of 2,056 statewide, top 15%, 194 students, 0% FRL); Warren Jr/Sr High School (math 22% / reading 42%, grade F, #157 of 693 statewide, top 25%, 203 students, 0% FRL) — zoned schools average 0% FRL vs 28% district-wide (28 pts lower); this property's tenant base skews higher-income than the district average.
- Market conditions: 5 active listings in the ZIP; 58 units permitted in Jo Daviess County in 2024 (0 in 5+ unit buildings).
Forward outlook
- In year one you build about $10k of equity ($678 loan paydown + $10k appreciation (10.0% local appreciation)).
- Jo Daviess County population projected at -25% by 2050 — secular population decline; favor cash flow + early exit over multi-decade hold.
- At projected returns (10.0% appreciation + 3.0% rent growth), your $27k cash investment doubles in ~3 years — after that, you're playing with house money.
- By year 4, paydown + projected appreciation supports a ~$37k cash-out refi (75% LTV) — recoverable capital for the next deal without selling this one.
Negotiation context
- It's been on market 51 days — a 3% lower offer ($95k) is reasonable based on typical stale-listing flexibility.
- Current owner paid $35k; list at $98k implies a 180% gain — meaningful room to come down on a strong offer.
Risks & watch-outs
- Watch-outs: built in 1800 — expect roof / HVAC / electrical / plumbing capex.
Questions for the listing agent
- It's been on market 51 days. Have you received any prior offers? Is the seller open to a 3% concession, seller financing, or rate buy-down credit?
- Built in 1800 — when were the roof, HVAC, electrical panel, plumbing, and water heater last replaced?
- Is there a deadline driving the sale (1031 exchange, divorce, estate, relocation)? That informs how much negotiation room exists.
- What's the average days-on-market for RENTAL listings here right now (not sales)? A rising rental-DOM trend means longer vacancies and softer asking-rent achievability than the comps imply.
- What's the recent tenant-quality profile in this submarket — average credit score on applications, eviction rate, late-payment / NSF rate, and stable-employment percentage? A property-management company in the area should have these aggregated.
- How much new for-sale + rental construction is in the pipeline within 1–3 miles? Heavy new supply typically softens prices + rents 12–24 months out; constrained supply supports both.
Investment metrics
- 1% rule
- 1.18% ✓
- Cap rate
- 8.93%
- Cash-on-cash
- 9.42%
- DSCR
- 1.42
- GRM
- 7.0
CMA / ARV
- ARV (median comp)
- $132,385
- List price
- $98,000
- Delta
- -25.97%
- Verdict
- UNDERPRICED
- Comps
- 20 within 1.0 mi
Projected returns pro-forma
10.0% appreciation · 3.0% rent growth · sell at horizon
- IRR
- 31.2%
- Equity multiple
- 3.45×
- Total profit
- $67,129
- Equity at exit
- $88,286
- IRR
- 27.0%
- Equity multiple
- 7.81×
- Total profit
- $186,957
- Equity at exit
- $190,392
Cash invested: $27,440 (down + closing). Projections, not guarantees.
Landlord ↔ Tenant lean methodology
- Overall (STATE)
- 43 Moderately Tenant-Leaning
- State Illinois
- 43 Moderately Tenant-Leaning · D+7
- County
- — inherits STATE
- City
- — inherits STATE
ZIP-level market 61087
- Home prices YoY
- 9.6%
- Active inventory
- 5
- Price-to-rent
- 7.0×
Monthly cashflow live
- Estimated rent
- $1,161 medium interval (Pro) →
- Mortgage (P&I)
- −$514
- Tax from tax record
- −$147 /mo · $1,760/yr
- Insurance
- −$41
- HOA
- −$0
- Vacancy / Maint / Mgmt
- −$244
- Net cashflow
- $215
Break-even live
Sensitivity live
| Price | -10% $271 | -5% $243 | +0% $215 | +5% $188 | +10% $160 |
|---|---|---|---|---|---|
| Rent | -10% $124 | -5% $170 | +0% $215 | +5% $261 | +10% $307 |
| Rate | -1.0pp $265 | -0.5pp $240 | base $215 | +0.5pp $190 | +1.0pp $164 |
UW: 25.0% down · 7.5% · 30yr · 1.5% tax · 5.0% vac · 8.0% maint · 8.0% mgmt
Financing live
Cash to close
- Down payment
- $24,500
- Closing costs
- $2,940
- Reserves months
- —
- Total cash needed
- —
Loan-product check · same deal, 3 products live
Conventional
25% down · 7.5% · 30yr
- Down + closing
- —
- Monthly P&I
- —
- Monthly cashflow
- —
- DSCR
- —
- Eligible?
- —
Personal DTI + credit; lowest rate.
DSCR
20% down · 8.5% · 30yr
- Down + closing
- —
- Monthly P&I
- —
- Monthly cashflow
- —
- DSCR
- —
- Eligible?
- —
No personal income docs; deal must DSCR.
Hard money
10% down · 12.0% · 12mo
- Down + closing
- —
- Monthly P&I
- —
- Monthly cashflow
- —
- DSCR
- —
- Eligible?
- —
Short-term bridge; refi at stabilization.
Listing history 19 events
-
2026-06-21days on market $98,000 Active 51 DOM
-
2026-06-21days on market $98,000 Active 50 DOM
-
2026-06-18days on market $98,000 Active 48 DOM
-
2026-06-17days on market $98,000 Active 47 DOM
-
2026-06-16days on market $98,000 Active 46 DOM
-
2026-06-15days on market $98,000 Active 45 DOM
-
2026-06-13days on market $98,000 Active 43 DOM
-
2026-06-12days on market $98,000 Active 42 DOM
-
2026-06-09days on market $98,000 Active 39 DOM
-
2026-06-08days on market $98,000 Active 38 DOM
-
2026-06-07days on market $98,000 Active 37 DOM
-
2026-06-05days on market $98,000 Active 35 DOM
-
2026-06-04days on market $98,000 Active 33 DOM
-
2026-06-02days on market $98,000 Active 32 DOM
-
2026-06-01days on market $98,000 Active 31 DOM
-
2026-05-31days on market $98,000 Active 30 DOM
-
2026-05-31days on market $98,000 Active 29 DOM
-
2026-05-01$98,000 Active 276-char remark
-
2013-08-26soldstatus $35,000
ⓘ Source: listings_history table (triggers on properties + properties_extension) + one-shot
backfill from property_details.listing_events for pre-trigger history.
Tax reassessment forecast IL · Partial reset (capped growth)
- Current annual tax
- $1,760 · $147/mo
- Projected year-2 tax
- $1,992 · $166/mo
- Expected delta
- +$233/yr (+$19/mo · 13.2%)
ⓘ Screening estimate from a state-policy table — verify with the county assessor before closing.
Climate risk First Street
- Flood 1/10 Low FEMA zone X (unshaded) · 0% chance over 30 yrs
- Wildfire 1/10 Low
- Heat 2/10 Low 7 d/yr ≥99°F today · 15 d/yr by 30 yrs out
- Wind 2/10 Low
- Air quality 2/10 Low 1 unhealthy d/yr today · 1 by 30 yrs out
Nearby sold comps map
Loading sold comps map…
Walkable amenities ~0.75 mi
Loading nearby amenities…
Taxation est. · year 1
- Rental income
- $13,927
- − Mortgage interest
- −$5,490
- − Property taxes
- −$1,760
- − Insurance
- −$490
- − Repairs & maintenance
- −$1,114
- − Management
- −$1,114
- − Depreciation
- −$2,851
- Taxable income
- $1,109
- Est. tax owed @ 24.0%
- −$266
- After-tax cash flow
- $2,320/yr
For passive investors: Depreciation is non-cash, so a rental often shows a tax loss while cash-flowing — sheltering income. Rental losses are passive: they offset passive income freely, and up to $25,000/yr can offset ordinary (W-2) income if you actively participate and your MAGI is under $100k (phasing out to $0 by $150k); unused losses carry forward. On sale, claimed depreciation is recaptured at up to 25%, and gains may owe capital-gains tax (a 1031 exchange can defer both). Figures are a year-1 estimate at your 24.0% rate — not tax advice; consult a CPA.
Schools (NCES district)
- District
- Warren CUSD 205
- NCES district ID
- 1740740
- Math proficiency
- 40% ▬ 0.00%
- Reading proficiency
- 45% ▲ 10.00%
- Median HH income
- $48,322
- Composite
- 38.72/100
- National rank
- #8384
- State rank
- #273 of 919 in IL
Livability — Warren
- Score
- 73/100
- State rank
- #290
- US rank
- #5562
Category grades
Schools grade is shown separately in the Schools card above.
Census & demographics
- Census place
- Warren, IL
- Population (ZIP)
- 1,648
Population outlook (Jo Daviess County) Hauer SSP2
- Today (2025)
- 20,420 people
- By 2030
- 19,405 · -5.0%
- By 2040
- 17,244 · -15.6%
- By 2050
- 15,357 · -24.8%
- By 2075
- 11,760 · -42.4%
- By 2100
- 8,355 · -59.1%
Race, ethnicity, and origin ACS 2023
- Neighborhood character
- Predominantly White (91%)
- Race & ethnicity
- White 91% Hispanic / Latino 5% Two or more races 4%
- Hispanic origin (detail)
- Mexican 5%
- Common ancestry
- Portuguese 5% Romanian 2% Iranian 2%
- Foreign-born
- 1% · Canada
- Languages at home
- 99% English-only · Spanish 1%
Political lean MEDSL · Jo Daviess
- 2024 margin
- R (+16.8) · D 40.8% · R 57.6% · Other 1.6%
- 2008→2024 swing
- -27.3pp toward R · 2008: 10.5pp · 2024: -16.8pp
- All cycles
- 2024: R+16.8 2020: R+16.5 2016: R+14.9 2012: D+1.1 2008: D+10.5
Not yet ingested
- Civics
- —
Market trends
- HPI YoY
- ▲ 14.20%
- Current HPI
- 161.8
- Rent YoY
- —
- Metro
- —
- State GDP YoY
- ▲ 1.59%
- F500 in state
- 60
Industry mix (Fortune 500 HQ in IL)
| Industry | F500 HQs | Revenue |
|---|---|---|
| Insurance | 4 | $201B |
|
||
| Consumer Goods | 4 | $87B |
|
||
| Industrial Machinery | 3 | $64B |
|
||
| Healthcare | 2 | $55B |
|
||
| Retail / Pharmacy | 1 | $148B |
|
||
| Agriculture / Food | 1 | $86B |
|
||
Price history
+180.0% since first listed2 events — show timeline
- 2026-05-01 Listed $98,000 NWIAR
- 2013-08-26 Sold (Public Records) $35,000 Public Records
Property tax history
+1.2%/yrLatest (2025): $1,760 · +14.6% YoY. Source: county tax records.
Cash-flow waterfall
monthlySold comps — $/sqft
last 12 mo · ≤1 miLoading sold comps…