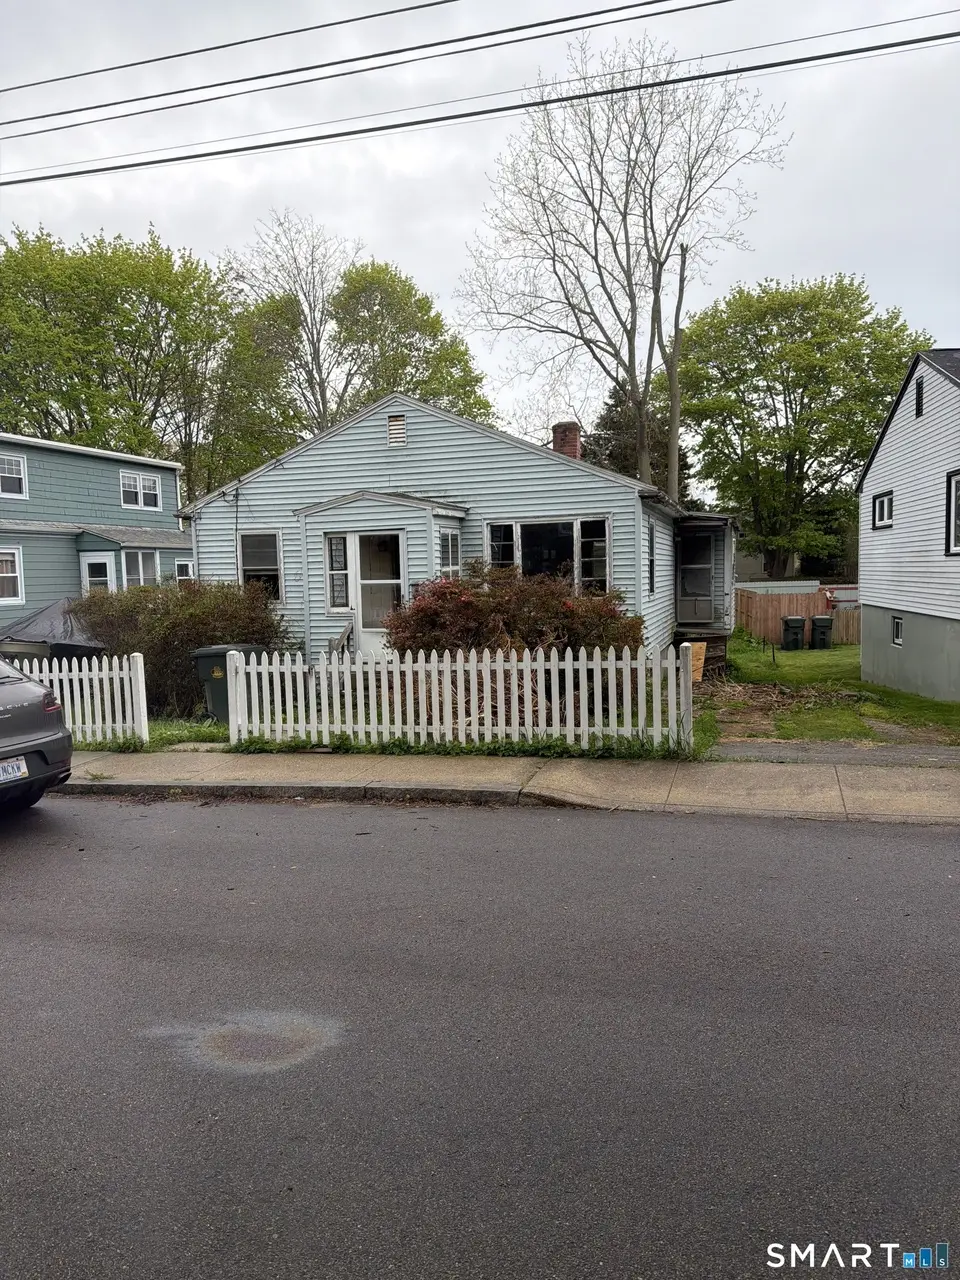
38 Robinson St · New London, CT
Flood risk 4/10 · Minor
- FEMA flood zone
- X (unshaded)
- Chance of flooding over 30 yrs
- 0.13%
- Est. flood insurance / yr
- $507 – $1,088
Fire risk 1/10 · Minimal
- Est. fire insurance / yr
- $829 – $1,539
Heat risk 6/10 · Moderate
- Hot days now (above 94°F)
- 7 days/yr
- Hot days in 30 yrs
- 16 days/yr
Wind risk 8/10 · Major
- Chance of severe wind over 30 yrs
- 80.0%
Air-quality risk 4/10 · Minor
- Unhealthy air days now
- 5 days/yr
- Unhealthy air days in 30 yrs
- 7 days/yr
Risk factors via First Street. Map © Google.
Why this score? — see what drove the C- grade
The composite is a weighted blend of 9 inputs, each scored 0–100. Each bar is that input's sub-score; the figure is the points it added to the 100-point composite (weight × sub-score).
- Cash flow +17.9/30.0
- ARV discount +15.0/15.0
- DSCR +5.6/10.0
- 1% rule +4.9/10.0
- Livability +3.7/5.0
- Rent growth +2.7/5.0
- Condition / age +2.5/5.0
- Schools +1.4/10.0
- Appreciation +0.0/10.0
$175,000
🖨 Deal sheet 📄 Offer letter ✓ Due diligence
Listing remarks
Calling all investors, flippers, and rehab specialists! This 2-bedroom, 1-bath home is a full-rehab opportunity located in one of New London's most desirable and quiet neighborhoods. With strong upside potential and an unbeatable location, this property is perfect for anyone looking to build instant equity, complete a profitable flip, or create a high-demand rental property. Ideally situated less than 3 miles from Ocean Beach Park and under 1.5 miles from Mitchell College, the home is positioned to benefit from strong year-round and seasonal demand. The location offers excellent potential for college housing, long-term rental income, or Airbnb/short-term rental opportunities, thanks to near
Key facts
- 6,098 sq ft lot
- Built 1960
- Listed 36 days
Property features AI
Finance
- Financial info: Assessed value listed
Exterior
- Utilities: Public water connected; Public sewer connected
- Home design: Single-family home
- Construction: Frame construction; Concrete foundation; Asphalt shingle roof
- Exterior features: Level lot; Vinyl siding
Interior
- Bedrooms: Two bedrooms
- Bathrooms: One full bathroom
- Heating & cooling: No heat; No hot water
- Interior features: Four total rooms; Full basement with interior access
Neighborhood map
What this means for you Summary
Snapshot
- This is a 2-bed/1.0-bath single-family listed at $175k.
Deal economics
- At list price, monthly cash flow is $148 ($2k/yr) — positive.
- The deal already cash-flows at list — no discount required.
- To meet the 1% rule (rent ≥ 1% of price), the offer needs to be $174k (0.6% below list).
- Recommended offer: $170k (3.0% below list) — sets the bar for market timing.
- Cap rate 7.3% vs local median 4.3% in New London — top-decile yield for the area; either an underpriced asset or a hidden risk that comps aren't pricing in. Stress-test before assuming the spread holds.
Location & tenants
- Location reads 74/100 on livability (#66 in CT, #4,772 nationally) — a middle-class / working-renter tenant base. Strengths: health & safety A+, housing A-, crime B+; Watch: employment D+, schools F, amenities F.
- New London School District (urban): math 11% / reading 21% proficiency, ranked #149 of 153 in CT (top 97%) — low school quality limits family demand, transient renter base, plan for 1-2y turnover; 72% free/reduced lunch — lower-income household profile, screen leases tightly.
- Market conditions: Rents flat; 69 active listings in the ZIP; 22 comparable units currently listed for rent nearby; rentals at typical pace (median 21d on market — plan ~3-4 weeks tenant-placement turnaround); 45% of comp listings sitting > 30 days — soft ceiling on asking rent; 487 units permitted in Southeastern Connecticut Planning Region in 2024 (244 in 5+ unit buildings).
- This rent runs 35% of the median local income ($59k/yr) — at the standard rent-burdened threshold; future hikes will face affordability resistance.
Forward outlook
- Local home prices are declining (-3.0%/yr); year-one equity from $1k of loan paydown is wiped out by about $5k of value loss. Plan a longer hold.
Negotiation context
- It's been on market 37 days — a 3% lower offer ($170k) is reasonable based on typical stale-listing flexibility.
Risks & watch-outs
- Climate carrying-cost: severe wind risk, 80% chance of damaging wind over 30y; extreme-heat days projected 7→16/yr by 2055 (HVAC capex compounding) — expect insurance premiums to compound above CPI over the hold.
Questions for the listing agent
- It's been on market 37 days. Have you received any prior offers? Is the seller open to a 3% concession, seller financing, or rate buy-down credit?
- Built in 1960 — when were the roof, HVAC, electrical panel, plumbing, and water heater last replaced?
- Is there a deadline driving the sale (1031 exchange, divorce, estate, relocation)? That informs how much negotiation room exists.
- Schools are F-rated, which usually means shorter tenancies and higher turnover. Who's the typical renter profile here, and what's been the actual vacancy rate?
- What's the average days-on-market for RENTAL listings here right now (not sales)? A rising rental-DOM trend means longer vacancies and softer asking-rent achievability than the comps imply.
- What's the recent tenant-quality profile in this submarket — average credit score on applications, eviction rate, late-payment / NSF rate, and stable-employment percentage? A property-management company in the area should have these aggregated.
- How much new for-sale + rental construction is in the pipeline within 1–3 miles? Heavy new supply typically softens prices + rents 12–24 months out; constrained supply supports both.
Investment metrics
- 1% rule
- 0.99% ✗
- Cap rate
- 7.31%
- Cash-on-cash
- 3.62%
- DSCR
- 1.16
- GRM
- 8.4
CMA / ARV
- ARV (median comp)
- $237,207
- List price
- $175,000
- Delta
- -26.22%
- Verdict
- UNDERPRICED
- Comps
- 20 within 1.0 mi
Show comp detail 12 sales within ~0.75 mi
| Address | Dist | Beds/Ba | Sqft | Sold | Price | $/sf | Match |
|---|---|---|---|---|---|---|---|
| 188 Shaw St | 0.10mi | 3/1.0 (+1) | 1,036 (+5%) | 4mo | $300,000 | $290 | 79 |
| 26 Crescent St | 0.33mi | 2/1.0 | 1,047 (+6%) | 0mo | $275,000 | $263 | 75 |
| 309 Ocean Ave | 0.44mi | 2/1.0 | 936 (-5%) | 14mo | $137,000 | $146 | 59 |
| 77 Squire St | 0.32mi | 3/1.0 (+1) | 1,068 (+8%) | 9mo | $269,000 | $252 | 59 |
| 47 W High St | 0.69mi | 3/1.5 (+1) | 975 (-1%) | 0mo | $340,000 | $349 | 58 |
| 58 Gorton St | 0.42mi | 3/1.0 (+1) | 1,080 (+9%) | 11mo | $325,000 | $301 | 51 |
| 14 Warren St | 0.60mi | 2/1.5 | 1,126 (+14%) | 1mo | $317,000 | $282 | 46 |
| 28 Crescent St | 0.32mi | 2/1.0 | 1,134 (+15%) | 18mo | $265,000 | $234 | 46 |
| 43 Gorton St | 0.40mi | 3/1.0 (+1) | 1,131 (+14%) | 12mo | $295,000 | $261 | 42 |
| 51 Dell Ave | 0.58mi | 1/1.0 (-1) | 908 (-8%) | 18mo | $185,000 | $204 | 39 |
| 88 Blackhall St | 0.73mi | 2/2.0 | 1,054 (+7%) | 15mo | $260,000 | $247 | 38 |
| 4 Bishop Ct | 0.73mi | 3/1.5 (+1) | 1,082 (+9%) | 14mo | $210,000 | $194 | 32 |
Match score weights: distance 35% · size 25% · config 20% · recency 20%. Top-matched comps best support the ARV.
Projected returns pro-forma
-3.0% appreciation · 0.7% rent growth · sell at horizon
- IRR
- -13.3%
- Equity multiple
- 0.53×
- Total profit
- $-22,843
- Equity at exit
- $26,093
- IRR
- -8.4%
- Equity multiple
- 0.53×
- Total profit
- $-23,045
- Equity at exit
- $15,131
Cash invested: $49,000 (down + closing). Projections, not guarantees.
Landlord ↔ Tenant lean methodology
- Overall (STATE)
- 27 Tenant-Leaning
- State Connecticut
- 27 Tenant-Leaning · D+7
- County
- — inherits STATE
- City
- — inherits STATE
ZIP-level market 06320
- Home prices YoY
- -20.7%
- Rents YoY
- 0.7%
- Active inventory
- 69
- Price-to-rent
- 8.4×
Monthly cashflow live
- Estimated rent
- $1,740 high interval (Pro) →
- Mortgage (P&I)
- −$918
- Tax from tax record
- −$236 /mo · $2,834/yr
- Insurance
- −$73
- HOA
- −$0
- Vacancy / Maint / Mgmt
- −$365
- Net cashflow
- $148
Break-even live
UW: 25.0% down · 7.5% · 30yr · 1.5% tax · 5.0% vac · 8.0% maint · 8.0% mgmt
Financing live
Cash to close
- Down payment
- $43,750
- Closing costs
- $5,250
- Reserves months
- —
- Total cash needed
- —
Loan-product check · same deal, 3 products live
Conventional
25% down · 7.5% · 30yr
- Down + closing
- —
- Monthly P&I
- —
- Monthly cashflow
- —
- DSCR
- —
- Eligible?
- —
Personal DTI + credit; lowest rate.
DSCR
20% down · 8.5% · 30yr
- Down + closing
- —
- Monthly P&I
- —
- Monthly cashflow
- —
- DSCR
- —
- Eligible?
- —
No personal income docs; deal must DSCR.
Hard money
10% down · 12.0% · 12mo
- Down + closing
- —
- Monthly P&I
- —
- Monthly cashflow
- —
- DSCR
- —
- Eligible?
- —
Short-term bridge; refi at stabilization.
Rent comps 22 comps
| Address | Beds | Baths | Sqft | Rent | $/sqft | DOM | Units | Dist |
|---|---|---|---|---|---|---|---|---|
| 205 Shaw St Apt 3 New London, CT | 2.0 | 1.0 | 625 | $1,500 | $2.40 | 43d | 1 | 0.11mi |
| 50 Montauk Ave Unit 1 New London, CT | 2.0 | 1.0 | 936 | $1,600 | $1.71 | 21d | 1 | 0.34mi |
| 50 Montauk Ave Unit 2 New London, CT | 1.0 | 1.0 | 840 | $1,350 | $1.61 | 43d | 1 | 0.34mi |
| 848 Bank St Unit 1st Floor New London, CT | 2.0 | 1.0 | 913 | $1,850 | $2.03 | 43d | 1 | 0.43mi |
| 835 Bank St New London, CT | 2.0 | 1.0 | 1031 | $1,750 | $1.70 | 43d | 1 | 0.46mi |
| 837 Bank St Unit 3 New London, CT | 1.0 | 1.0 | 525 | $1,450 | $2.76 | 43d | 1 | 0.46mi |
| 42 Jefferson Ave New London, CT | 2.0 | 1.0 | 825 | $1,600 | $1.94 | 43d | 1 | 0.55mi |
| 16 School St Unit 2 New London, CT | 2.0 | 1.0 | 1000 | $2,300 | $2.30 | 13d | 1 | 0.56mi |
| 9 Brewer St #4 New London, CT | 1.0 | 1.0 | 752 | $1,975 | $2.63 | 21d | 1 | 0.63mi |
| 82 Longview St #36 Waterford, CT | 1.0 | 1.0 | 750 | $1,550 | $2.07 | 13d | 1 | 0.66mi |
| 13 Thompson Ct New London, CT | 3.0 | 1.0 | 1000 | $1,900 | $1.90 | 43d | 1 | 0.74mi |
| 156 Garfield Ave New London, CT | 1.0 | 1.0 | 525 | $1,395 | $2.66 | 13d | 1 | 0.77mi |
| 27 Jay St Unit 1 New London, CT | 2.0 | 1.0 | 650 | $1,500 | $2.31 | 21d | 1 | 0.77mi |
| 123 Bank St Unit 2F New London, CT | 1.0 | 1.0 | 620 | $1,850 | $2.98 | 13d | 1 | 0.78mi |
| 394 Willetts Ave Waterford, CT | 1.0–2.0 | 1.0–2.0 | 963 | $2,725 | $2.83 | 43d | 14 | 0.79mi |
| 394 Willetts Ave Waterford, CT | 1.0–2.0 | 1.0–2.0 | 963 | $2,725 | $2.83 | 21d | 7 | 0.79mi |
| 159 Connecticut Ave New London, CT | 3.0 | 1.0 | 1047 | $1,850 | $1.77 | 43d | 1 | 0.96mi |
| 120 Broad St New London, CT | 2.0 | 1.0–3.0 | 977 | $2,500 | $2.56 | 21d | 7 | 0.98mi |
| 395 Pequot Ave Unit 4 New London, CT | 1.0 | 1.0 | 650 | $1,300 | $2.00 | 44d | 1 | 1.01mi |
| 59 Federal St New London, CT | 1.0–2.0 | 1.0 | 625 | $1,045 | $1.67 | 13d | 1 | 1.03mi |
| 5 Nob Hill Rd New London, CT | 2.0 | 1.0 | 722 | $2,231 | $3.09 | 13d | 54 | 1.06mi |
| 55 Channing St Unit 3 New London, CT | 2.0 | 1.0 | 685 | $1,895 | $2.77 | 21d | 1 | 1.22mi |
Listing history 13 events
-
2026-06-10days on market $175,000 Active 37 DOM
-
2026-06-09days on market $175,000 Active 36 DOM
-
2026-06-08days on market $175,000 Active 35 DOM
-
2026-06-07days on market $175,000 Active 34 DOM
-
2026-06-05days on market $175,000 Active 31 DOM
-
2026-06-03days on market $175,000 Active 30 DOM
-
2026-06-02days on market $175,000 Active 29 DOM
-
2026-06-01days on market $175,000 Active 28 DOM
-
2026-05-31days on market $175,000 Active 27 DOM
-
2026-05-30days on market $175,000 Active 26 DOM
-
2026-05-19price $175,000 1032-char remark
-
2026-05-05$199,900 Active 1032-char remark
-
2026-05-03historical $199,900 1032-char remark
ⓘ Source: listings_history table (triggers on properties + properties_extension) + one-shot
backfill from property_details.listing_events for pre-trigger history.
Tax reassessment forecast CT · Partial reset (capped growth)
- Current annual tax
- $2,834 · $236/mo
- Projected year-2 tax
- $3,290 · $274/mo
- Expected delta
- +$456/yr (+$38/mo · 16.1%)
ⓘ Screening estimate from a state-policy table — verify with the county assessor before closing.
Climate risk First Street
- Flood 4/10 Moderate FEMA zone X (unshaded) · 13% chance over 30 yrs
- Wildfire 1/10 Low
- Heat 6/10 Major 7 d/yr ≥94°F today · 16 d/yr by 30 yrs out
- Wind 8/10 Severe 80% chance of damaging wind over 30 yrs
- Air quality 4/10 Moderate 5 unhealthy d/yr today · 7 by 30 yrs out
Nearby sold comps map
Loading sold comps map…
Walkable amenities ~0.75 mi
Loading nearby amenities…
Taxation est. · year 1
- Rental income
- $20,880
- − Mortgage interest
- −$9,803
- − Property taxes
- −$2,834
- − Insurance
- −$875
- − Repairs & maintenance
- −$1,670
- − Management
- −$1,670
- − Depreciation
- −$5,091
- Taxable loss
- −$1,063
- Est. tax savings @ 24.0%
- +$255
- After-tax cash flow
- $2,029/yr
For passive investors: Depreciation is non-cash, so a rental often shows a tax loss while cash-flowing — sheltering income. Rental losses are passive: they offset passive income freely, and up to $25,000/yr can offset ordinary (W-2) income if you actively participate and your MAGI is under $100k (phasing out to $0 by $150k); unused losses carry forward. On sale, claimed depreciation is recaptured at up to 25%, and gains may owe capital-gains tax (a 1031 exchange can defer both). Figures are a year-1 estimate at your 24.0% rate — not tax advice; consult a CPA.
Schools (NCES district)
- District
- New London School District
- NCES district ID
- 0902820
- Math proficiency
- 11% ▼ -11.00%
- Reading proficiency
- 21% ▼ -11.00%
- Median HH income
- $40,640
- Composite
- 13.66/100
- National rank
- #9502
- State rank
- #149 of 153 in CT
Livability — New London
- Score
- 74/100
- State rank
- #66
- US rank
- #4772
Category grades
Schools grade is shown separately in the Schools card above.
Census & demographics
- Census place
- New London, CT
- County
- New London County · 147,197 people
- City population
- 27,703
- Metro
- Norwich-New London, CT
- Population (ZIP)
- 27,703
- Household income
- $59,170
- Rent vs Own
- Severe rent burden
- 2014.0
Population outlook (Southeastern Connecticut County) Hauer SSP2
- By 2040
- 293,442
Race, ethnicity, and origin ACS 2023
- Neighborhood character
- Diverse neighborhood (Simpson 0.66)
- Race & ethnicity
- White 45% Hispanic / Latino 34% Black 13% Two or more races 13% Asian 2%
- Hispanic origin (detail)
- Mexican 1% Puerto Rican 17% Dominican 7%
- Common ancestry
- Romanian 3% Hispanic 3% Lithuanian 1%
- Foreign-born
- 19% · Canada, Jamaica
- Languages at home
- 67% English-only · Spanish 27% French/Haitian/Cajun 2% Other Indo-European 1%
Political lean MEDSL · Southeastern Connecticut
- 2024 margin
- D (+13.0) · D 55.6% · R 42.6% · Other 1.8%
- All cycles
- 2024: D+13.0
Not yet ingested
- Civics
- —
Market trends
- HPI YoY
- ▼ -71.39%
- Current HPI
- 273.3024
- Rent YoY
- ▲ 0.70%
- Metro
- Norwich-New London, CT
- State GDP YoY
- ▲ 1.06%
- F500 in state
- 38
Industry mix (Fortune 500 HQ in CT)
| Industry | F500 HQs | Revenue |
|---|---|---|
| Industrial Machinery | 4 | $38B |
|
||
| Insurance | 3 | $71B |
|
||
| Financial Services | 2 | $25B |
|
||
| Transportation / Logistics | 2 | $18B |
|
||
| Healthcare | 1 | $247B |
|
||
| Telecommunications | 1 | $55B |
|
||
Price history
-12.5% since first listed4 events — show timeline
- 2026-06-11 Listing Removed — Smart MLS
- 2026-05-19 Price Changed $175,000 Smart MLS
- 2026-05-05 Listed $199,900 Smart MLS
- 2026-05-03 Coming Soon — Smart MLS
Property tax history
+0.5%/yrLatest (2023): $2,834 · -0.2% YoY. Source: county tax records.
Cash-flow waterfall
monthlySold comps — $/sqft
last 12 mo · ≤1 miLoading sold comps…