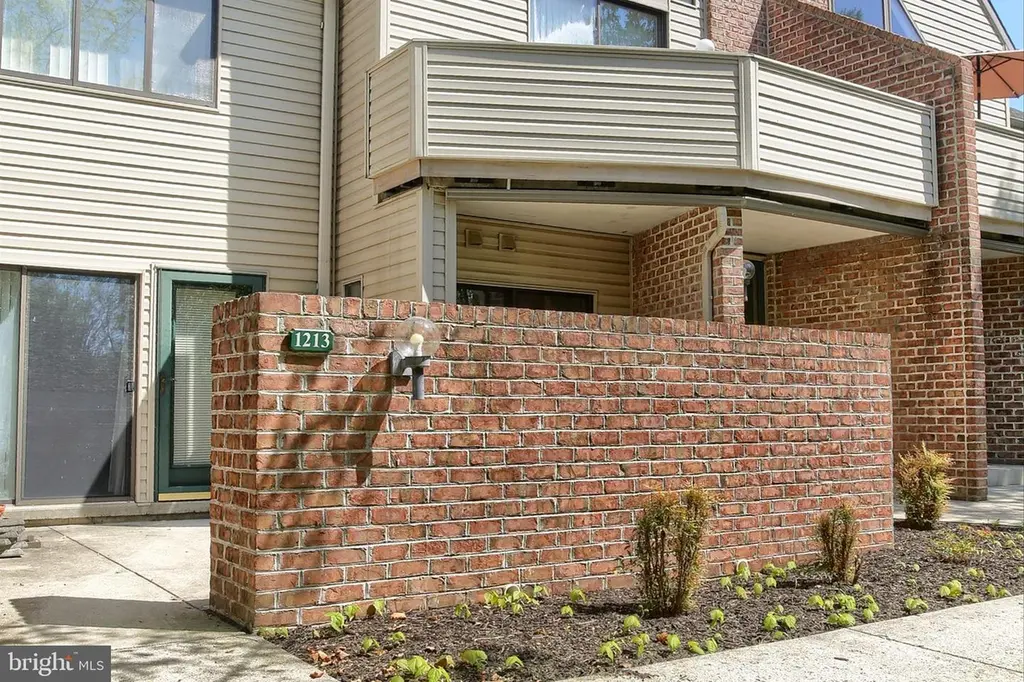
1213 Cherrington Dr · Susquehanna, PA
Flood risk 1/10 · Minimal
- FEMA flood zone
- X (unshaded)
- Chance of flooding over 30 yrs
- 0.0%
- Est. flood insurance / yr
- $507 – $1,088
Fire risk 1/10 · Minimal
- Est. fire insurance / yr
- $511 – $949
Heat risk 5/10 · Moderate
- Hot days now (above 100°F)
- 7 days/yr
- Hot days in 30 yrs
- 15 days/yr
Wind risk 3/10 · Minor
- Chance of severe wind over 30 yrs
- 5.0%
Air-quality risk 2/10 · Minimal
- Unhealthy air days now
- 1 days/yr
- Unhealthy air days in 30 yrs
- 3 days/yr
Risk factors via First Street. Map © Google.
Why this score? — see what drove the D- grade
The composite is a weighted blend of 9 inputs, each scored 0–100. Each bar is that input's sub-score; the figure is the points it added to the 100-point composite (weight × sub-score).
- Cash flow +10.1/30.0
- ARV discount +7.5/15.0
- 1% rule +5.7/10.0
- DSCR +2.9/10.0
- Rent growth +2.9/5.0
- Schools +2.6/10.0
- Livability +2.5/5.0
- Condition / age +2.5/5.0
- Appreciation +0.0/10.0
$125,000
🖨 Deal sheet (PDF) 📄 Offer letter ✓ Due diligence
Listing remarks
This unit comes with a garage! The seller has loved this space for many years, and now it's time for you to freshen it up with new flooring and paint to make it your own little oasis. Your patio backs up to a wooded area of trees and shrubs where you'll see deer and hear the birds chirping while enjoying your morning coffee. With easy access to Progress Ave and Route 81, it makes heading out to dinner, running errands, or commuting to work a breeze! This home is cheaper than rent. .. but you could also rent it out as a solid investment!
Key facts
- $199 HOA
- Garage
- Built 1998
Property features AI
Finance
- HOA & community: Condo fee approximately $199.65 per month; HOA covers lawn maintenance, snow removal, trash, and sewer; Community amenities include common grounds and an exercise room
Exterior
- Parking: Detached garage (1 space); Garage with door opener; Additional parking lot
- Utilities: Public water; Public sewer; Electric service
- Home design: Condominium unit; Garden-style building (1–4 floors); Unit/flat structure; Entry on level 1
- Construction: Frame construction; Architectural shingle roof; Year built: estimated
- Exterior features: Not in a federal flood zone; Tidal water: No; Other structures above and below grade
Interior
- Kitchen: Dishwasher; Electric oven/range; Refrigerator
- Bedrooms: One bedroom on the main level
- Flooring: Carpet; Vinyl
- Bathrooms: One full bathroom (one on the main level)
- Heating & cooling: Heat pump(s) heating; Central air conditioning; Electric heating and cooling; Electric hot water
- Interior features: Soaking tub; No basement
- Laundry & utility: Washer and dryer in unit; Main-floor laundry
Neighborhood map
What this means for you Summary
Snapshot
- This is a 1-bed/1.0-bath condo listed at $125k.
Deal economics
- At list price, monthly cash flow is $-73 ($-870/yr) — negative.
- To cash-flow at today's rent, offer at most $112k (10.2% below list).
- Meets the 1% rule at list price ($1k rent vs $125k).
- Recommended offer: $112k (10.2% below list) — sets the bar for cash-flow.
Location & tenants
- Location reads: area grade D — affects rentability + tenant quality, not the cash-flow math above.
- Susquehanna Township SD (suburban): math 17% / reading 39% proficiency, ranked #444 of 539 in PA (top 82%) — low school quality limits family demand, transient renter base, plan for 1-2y turnover.
- Zoned schools: Thomas W Holtzman Jr El Sch (math 22% / reading 45%, grade F, #1,081 of 1,518 statewide, top 71%, 820 students, 67% FRL); Susquehanna Twp Ms (math 7% / reading 34%, grade F, #435 of 512 statewide, top 85%, 723 students, 63% FRL); Susquehanna Twp Hs (math 37% / reading 10%, grade F, #379 of 437 statewide, top 87%, 743 students, 55% FRL) — zoned schools average 62% FRL vs 35% district-wide (27 pts higher); higher-poverty schools than district average — tighter screening recommended.
- Market conditions: Rents rising (+1.6%/yr); 174 active listings in the ZIP; 8 comparable units currently listed for rent nearby; rentals at typical pace (median 16d on market — plan ~3-4 weeks tenant-placement turnaround); solid renter incomes; 540 units permitted in Dauphin County in 2024 (194 in 5+ unit buildings).
Forward outlook
- Local home prices are declining (-3.0%/yr); year-one equity from $864 of loan paydown is wiped out by about $4k of value loss. Plan a longer hold.
Negotiation context
- Only 2 days on market — expect competitive offers; lowballing is unlikely to land.
- Current owner paid $74k; list at $125k implies a 70% gain — meaningful room to come down on a strong offer.
Risks & watch-outs
- Climate carrying-cost: extreme-heat days projected 7→15/yr by 2055 (HVAC capex compounding) — expect insurance premiums to compound above CPI over the hold.
Questions for the listing agent
- What do current leases actually rent for vs. the listed asking? Can we see a recent rent roll and the last 12 months of T-12 income?
- What does the HOA fee cover, when was the last increase, and are there any pending special assessments or reserve-fund shortfalls?
- Any open or pending special assessments — roof, HVAC, plumbing, elevator, façade? What's the per-unit balance and payoff schedule, and is the seller paying it off at close or rolling it to the buyer?
- Is there a deadline driving the sale (1031 exchange, divorce, estate, relocation)? That informs how much negotiation room exists.
- The area grade is low — what's the realistic commute time and amenity access for the typical tenant pool here? Any planned neighborhood developments (good or bad) we should know about?
- What's the average days-on-market for RENTAL listings here right now (not sales)? A rising rental-DOM trend means longer vacancies and softer asking-rent achievability than the comps imply.
- What's the recent tenant-quality profile in this submarket — average credit score on applications, eviction rate, late-payment / NSF rate, and stable-employment percentage? A property-management company in the area should have these aggregated.
- How much new apartment / multifamily construction is in the pipeline within 1–3 miles? Heavy new supply (>2% of stock underway) typically softens rents 12–24 months out; light construction supports rent growth.
Investment metrics
- 1% rule
- 1.07% ✓
- Cap rate
- 5.60%
- Cash-on-cash
- -2.49%
- DSCR
- 0.89
- GRM
- 7.8
CMA / ARV
No comps found within radius.
Projected returns pro-forma
-3.0% appreciation · 1.55% rent growth · sell at horizon
- IRR
- -22.4%
- Equity multiple
- 0.24×
- Total profit
- $-26,611
- Equity at exit
- $18,638
- IRR
- -21.7%
- Equity multiple
- -0.03×
- Total profit
- $-36,028
- Equity at exit
- $10,808
Cash invested: $35,000 (down + closing). Projections, not guarantees.
Landlord ↔ Tenant lean methodology
- Overall (STATE)
- 62 Landlord-Friendly
- State Pennsylvania
- 62 Landlord-Friendly · EVEN
- County
- — inherits STATE
- City
- — inherits STATE
ZIP-level market 17110
- Rents YoY
- 1.6%
- Active inventory
- 174
- Price-to-rent
- 7.8×
Monthly cashflow live
- Estimated rent
- $1,333 high interval (Pro) →
- Mortgage (P&I)
- −$656
- Tax from tax record
- −$219 /mo · $2,632/yr
- Insurance
- −$52
- HOA
- −$199
- Vacancy / Maint / Mgmt
- −$280
- Net cashflow
- $-73
Break-even live
Sensitivity live
| Price | -10% $-2 | -5% $-37 | +0% $-73 | +5% $-108 | +10% $-143 |
|---|---|---|---|---|---|
| Rent | -10% $-178 | -5% $-125 | +0% $-73 | +5% $-20 | +10% $33 |
| Rate | -1.0pp $-10 | -0.5pp $-41 | base $-73 | +0.5pp $-105 | +1.0pp $-138 |
UW: 25.0% down · 7.5% · 30yr · 1.5% tax · 5.0% vac · 8.0% maint · 8.0% mgmt
Financing live
Cash to close
- Down payment
- $31,250
- Closing costs
- $3,750
- Reserves months
- —
- Total cash needed
- —
Loan-product check · same deal, 3 products live
Conventional
25% down · 7.5% · 30yr
- Down + closing
- —
- Monthly P&I
- —
- Monthly cashflow
- —
- DSCR
- —
- Eligible?
- —
Personal DTI + credit; lowest rate.
DSCR
20% down · 8.5% · 30yr
- Down + closing
- —
- Monthly P&I
- —
- Monthly cashflow
- —
- DSCR
- —
- Eligible?
- —
No personal income docs; deal must DSCR.
Hard money
10% down · 12.0% · 12mo
- Down + closing
- —
- Monthly P&I
- —
- Monthly cashflow
- —
- DSCR
- —
- Eligible?
- —
Short-term bridge; refi at stabilization.
Rent comps 8 comps
| Address | Beds | Baths | Sqft | Rent | $/sqft | DOM | Units | Dist |
|---|---|---|---|---|---|---|---|---|
| 504 Cherrington Dr Harrisburg, PA | 1.0 | 1.0 | 806 | $1,300 | $1.61 | 45d | 1 | 0.16mi |
| 2161 Camelot Dr Harrisburg, PA | 2.0 | 2.0 | 950 | $1,288 | $1.36 | 16d | 22 | 0.37mi |
| 2950 Ashwood Ln Unit 103 Susquehanna Township, PA | 1.0 | 1.0 | 766 | $1,571 | $2.05 | 25d | 1 | 0.74mi |
| 1500 High Pointe Dr Harrisburg, PA | 1.0–2.0 | 1.0–2.0 | 800 | $1,358 | $1.70 | 16d | 10 | 0.75mi |
| 2679 Alessandro Blvd Harrisburg, PA | 2.0–3.0 | 1.5 | 1217 | $1,662 | $1.37 | 16d | 4 | 0.77mi |
| 2505 Union Green Way Harrisburg, PA | 1.0–2.0 | 1.0–2.0 | 1048 | $1,650 | $1.57 | 16d | 4 | 0.79mi |
| 101 N Timber Ridge Dr Harrisburg, PA | 2.0 | 1.5–2.5 | 1055 | $1,575 | $1.49 | 16d | 1 | 1.26mi |
| 136 Hiddenwood Dr Unit 1 Harrisburg, PA | 2.0 | 2.0 | 1100 | $1,500 | $1.36 | 23d | 1 | 1.40mi |
HOA detail condo
- Monthly dues
- $199 · $2,388/yr
- Assessments
- None detected in remarks — confirm with the listing agent.
Listing history 4 events
-
2026-05-02status Pending 542-char remark
-
2026-05-01$125,000 Active 542-char remark
-
2026-04-27historical $125,000 542-char remark
-
1998-08-24soldstatus $73,610
ⓘ Source: listings_history table (triggers on properties + properties_extension) + one-shot
backfill from property_details.listing_events for pre-trigger history.
Tax reassessment forecast PA · Partial reset (capped growth)
- Current annual tax
- $2,632 · $219/mo
- Projected year-2 tax
- $2,632 · $219/mo
- Expected delta
- $0/yr ($0/mo · 0.0%)
ⓘ Screening estimate from a state-policy table — verify with the county assessor before closing.
Climate risk First Street
- Flood 1/10 Low FEMA zone X (unshaded) · 0% chance over 30 yrs
- Wildfire 1/10 Low
- Heat 5/10 Major 7 d/yr ≥100°F today · 15 d/yr by 30 yrs out
- Wind 3/10 Moderate 5% chance of damaging wind over 30 yrs
- Air quality 2/10 Low 1 unhealthy d/yr today · 3 by 30 yrs out
Nearby sold comps map
Loading sold comps map…
Walkable amenities ~0.75 mi
Loading nearby amenities…
Taxation est. · year 1
- Rental income
- $16,001
- − Mortgage interest
- −$7,002
- − Property taxes
- −$2,632
- − Insurance
- −$625
- − Repairs & maintenance
- −$1,280
- − Management
- −$1,280
- − HOA
- −$2,388
- − Depreciation
- −$3,636
- Taxable loss
- −$2,842
- Est. tax savings @ 24.0%
- +$682
- After-tax cash flow
- $-188/yr
For passive investors: Depreciation is non-cash, so a rental often shows a tax loss while cash-flowing — sheltering income. Rental losses are passive: they offset passive income freely, and up to $25,000/yr can offset ordinary (W-2) income if you actively participate and your MAGI is under $100k (phasing out to $0 by $150k); unused losses carry forward. On sale, claimed depreciation is recaptured at up to 25%, and gains may owe capital-gains tax (a 1031 exchange can defer both). Figures are a year-1 estimate at your 24.0% rate — not tax advice; consult a CPA.
Schools (NCES district)
- District
- Susquehanna Township SD
- NCES district ID
- 4223010
- Math proficiency
- 17% ▼ -15.00%
- Reading proficiency
- 39% ▼ -10.00%
- Median HH income
- $61,794
- Composite
- 25.59/100
- National rank
- #7424
- State rank
- #444 of 539 in PA
Livability — Susquehanna
No livability data for this city. (Only ~50 U.S. cities are tracked.)
Census & demographics
- County
- Dauphin County · 247,857 people
- Metro
- Harrisburg-Carlisle, PA
- Population (ZIP)
- 27,364
- Household income
- $80,699
- Rent vs Own
- Severe rent burden
- 1037.0
Population outlook (Dauphin County) Hauer SSP2
- Today (2025)
- 281,628 people
- By 2030
- 283,549 · +0.7%
- By 2040
- 285,385 · +1.3%
- By 2050
- 286,188 · +1.6%
- By 2075
- 291,053 · +3.3%
- By 2100
- 282,374 · +0.3%
Race, ethnicity, and origin ACS 2023
- Neighborhood character
- Diverse neighborhood (Simpson 0.66)
- Race & ethnicity
- White 47% Black 32% Hispanic / Latino 9% Asian 7% Two or more races 6%
- Hispanic origin (detail)
- Puerto Rican 6% Dominican 1%
- Common ancestry
- Italian 3% Romanian 2% Slovak 1%
- Foreign-born
- 8% · Canada, India, Vietnam
- Languages at home
- 88% English-only · Spanish 6% Other Indo-European 2% Vietnamese 1%
Political lean MEDSL · Dauphin
- 2024 margin
- Lean D (+5.9) · D 52.4% · R 46.5% · Other 1.1%
- 2008→2024 swing
- -3.1pp toward R · 2008: 9.1pp · 2024: 5.9pp
- All cycles
- 2024: D+5.9 2020: D+8.5 2016: D+2.8 2012: D+6.0 2008: D+9.1
Not yet ingested
- Civics
- —
Market trends
- HPI YoY
- ▼ -144.07%
- Current HPI
- 257.826
- Rent YoY
- ▲ 1.55%
- Metro
- Harrisburg-Carlisle, PA
- State GDP YoY
- ▲ 1.68%
- F500 in state
- 34
Industry mix (Fortune 500 HQ in PA)
| Industry | F500 HQs | Revenue |
|---|---|---|
| Healthcare | 2 | $309B |
|
||
| Insurance | 2 | $27B |
|
||
| Telecommunications / Media | 1 | $124B |
|
||
| Industrial Distribution | 1 | $22B |
|
||
| Financial Services | 1 | $20B |
|
||
| Chemicals / Materials | 1 | $18B |
|
||
Price history
+69.8% since first listed4 events — show timeline
- 2026-05-02 Pending — BRIGHT MLS
- 2026-05-01 Listed $125,000 BRIGHT MLS
- 2026-04-27 Coming Soon $125,000 BRIGHT MLS
- 1998-08-24 Sold (Public Records) $73,610 Public Records
Property tax history
+3.1%/yrLatest (2026): $2,632 · +5.7% YoY. Source: county tax records.
Cash-flow waterfall
monthlySold comps — $/sqft
last 12 mo · ≤1 miLoading sold comps…