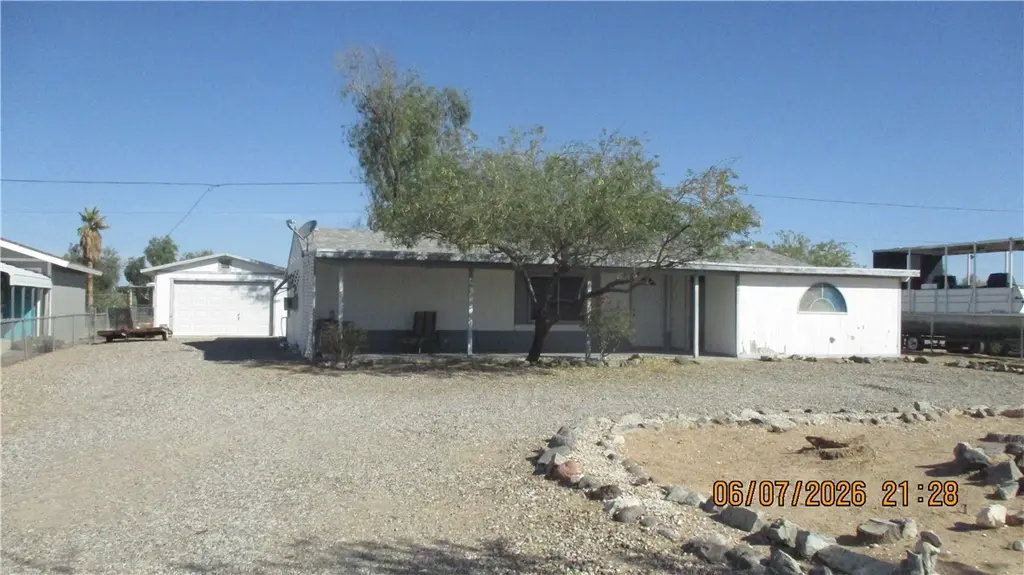
12671 S Pima Pkwy · Golden Shores, AZ
Flood risk 1/10 · Minimal
- FEMA flood zone
- X (unshaded)
- Chance of flooding over 30 yrs
- 0.0%
- Est. flood insurance / yr
- $507 – $1,088
Fire risk 4/10 · Minor
- Est. fire insurance / yr
- $610 – $1,132
Heat risk 9/10 · Severe
- Hot days now (above 114°F)
- 7 days/yr
- Hot days in 30 yrs
- 15 days/yr
Wind risk 1/10 · Minimal
- Chance of severe wind over 30 yrs
- —
Air-quality risk 1/10 · Minimal
- Unhealthy air days now
- 0 days/yr
- Unhealthy air days in 30 yrs
- 0 days/yr
Risk factors via First Street. Map © Google.
Why this score? — see what drove the C grade
The composite is a weighted blend of 9 inputs, each scored 0–100. Each bar is that input's sub-score; the figure is the points it added to the 100-point composite (weight × sub-score).
- Cash flow +19.1/30.0
- Appreciation +10.0/10.0
- ARV discount +7.5/15.0
- DSCR +6.0/10.0
- 1% rule +4.0/10.0
- Schools +3.6/10.0
- Livability +3.1/5.0
- Rent growth +2.5/5.0
- Condition / age +2.5/5.0
$143,000
🖨 Deal sheet 📄 Offer letter ✓ Due diligence
Listing remarks MLS
Spacious flloor plan - home sold same day. ..
Key facts
- 0.29 acre lot
- Garage
- Built 1992
Property features AI
Finance
- Other: Zoned R1 Single-Family Residential
Exterior
- Parking: Detached drive-through garage with 1 garage space
- Utilities: Electricity available; Natural gas available; Septic tank
- Home design: Manufactured double-wide home; Residential property; Faces south; Entry opens to breakfast bar / casual dining / partially open kitchen
- Construction: Shingle roof
- Exterior features: Chain link fencing; Paved road access; Private maintained road
Interior
- Kitchen: Oven; Range; Refrigerator
- Bathrooms: 2 full bathrooms
- Heating & cooling: Natural gas central heating
- Interior features: Breakfast bar; Vaulted ceilings
- Laundry & utility: Washer; Dryer; Water heater
Neighborhood map
What this means for you Summary
Snapshot
- This is a 3-bed/2.0-bath land listed at $143k.
Deal economics
- At list price, monthly cash flow is $151 ($2k/yr) — positive.
- The deal already cash-flows at list — no discount required.
- To meet the 1% rule (rent ≥ 1% of price), the offer needs to be $129k (9.6% below list).
- Recommended offer: $129k (9.6% below list) — sets the bar for 1% rule.
- Cap rate 7.6% vs local median 2.7% in Golden Shores — top-decile yield for the area; either an underpriced asset or a hidden risk that comps aren't pricing in. Stress-test before assuming the spread holds.
Location & tenants
- Location reads 61/100 on livability (#155 in AZ) — a middle-class / working-renter tenant base. Strengths: cost of living A+, crime A, housing B; Watch: health & safety C-, schools F, amenities F.
- Topock Elementary District (4376) (rural): math 45% / reading 35% proficiency, ranked #209 of 501 in AZ (top 42%) — families likely to look elsewhere, expect single-tenant / working-renter base with shorter leases.
- Market conditions: 112 active listings in the ZIP; 2,543 units permitted in Mohave County in 2024 (33 in 5+ unit buildings).
Forward outlook
- In year one you build about $15k of equity ($989 loan paydown + $14k appreciation (10.0% local appreciation)).
- Mohave County population projected to shrink 6% by 2050 — rents likely to lag national; underwrite the cash flow, not the appreciation.
- At projected returns (10.0% appreciation + 3.0% rent growth), your $40k cash investment doubles in ~3 years — after that, you're playing with house money.
- By year 3, paydown + projected appreciation supports a ~$39k cash-out refi (75% LTV) — recoverable capital for the next deal without selling this one.
Negotiation context
- Only 6 days on market — expect competitive offers; lowballing is unlikely to land.
- 2 sale attempts since 10y ago with the ask held roughly flat each time — persistent listings suggest the price (not the market) is what's stuck; bring a comps-based counter.
- Current owner paid $84k; list at $143k implies a 70% gain — meaningful room to come down on a strong offer.
Risks & watch-outs
- Climate carrying-cost: extreme-heat days projected 7→15/yr by 2055 (HVAC capex compounding) — expect insurance premiums to compound above CPI over the hold.
Questions for the listing agent
- Is there a deadline driving the sale (1031 exchange, divorce, estate, relocation)? That informs how much negotiation room exists.
- Schools are F-rated, which usually means shorter tenancies and higher turnover. Who's the typical renter profile here, and what's been the actual vacancy rate?
- What's the average days-on-market for RENTAL listings here right now (not sales)? A rising rental-DOM trend means longer vacancies and softer asking-rent achievability than the comps imply.
- What's the recent tenant-quality profile in this submarket — average credit score on applications, eviction rate, late-payment / NSF rate, and stable-employment percentage? A property-management company in the area should have these aggregated.
- How much new for-sale + rental construction is in the pipeline within 1–3 miles? Heavy new supply typically softens prices + rents 12–24 months out; constrained supply supports both.
Investment metrics
- 1% rule
- 0.90% ✗
- Cap rate
- 7.56%
- Cash-on-cash
- 4.52%
- DSCR
- 1.20
- GRM
- 9.2
CMA / ARV
No comps found within radius.
Projected returns pro-forma
10.0% appreciation · 3.0% rent growth · sell at horizon
- IRR
- 27.5%
- Equity multiple
- 3.18×
- Total profit
- $87,444
- Equity at exit
- $128,826
- IRR
- 24.0%
- Equity multiple
- 7.24×
- Total profit
- $249,841
- Equity at exit
- $277,818
Cash invested: $40,040 (down + closing). Projections, not guarantees.
Landlord ↔ Tenant lean methodology
- Overall (STATE)
- 87 Strongly Landlord-Friendly
- State Arizona
- 87 Strongly Landlord-Friendly · R+3
- County
- — inherits STATE
- City
- — inherits STATE
ZIP-level market 86436
- Home prices YoY
- 3.6%
- Active inventory
- 112
- Price-to-rent
- 9.2×
Monthly cashflow live
- Estimated rent
- $1,292 medium interval (Pro) →
- Mortgage (P&I)
- −$750
- Tax from tax record
- −$60 /mo · $725/yr
- Insurance
- −$60
- HOA
- −$0
- Vacancy / Maint / Mgmt
- −$271
- Net cashflow
- $151
Break-even live
UW: 25.0% down · 7.5% · 30yr · 1.5% tax · 5.0% vac · 8.0% maint · 8.0% mgmt
Financing live
Cash to close
- Down payment
- $35,750
- Closing costs
- $4,290
- Reserves months
- —
- Total cash needed
- —
Loan-product check · same deal, 3 products live
Conventional
25% down · 7.5% · 30yr
- Down + closing
- —
- Monthly P&I
- —
- Monthly cashflow
- —
- DSCR
- —
- Eligible?
- —
Personal DTI + credit; lowest rate.
DSCR
20% down · 8.5% · 30yr
- Down + closing
- —
- Monthly P&I
- —
- Monthly cashflow
- —
- DSCR
- —
- Eligible?
- —
No personal income docs; deal must DSCR.
Hard money
10% down · 12.0% · 12mo
- Down + closing
- —
- Monthly P&I
- —
- Monthly cashflow
- —
- DSCR
- —
- Eligible?
- —
Short-term bridge; refi at stabilization.
Listing history 7 events
-
2026-06-19days on market $143,000 Active 6 DOM
-
2026-06-18days on market $143,000 Active 5 DOM
-
2026-06-17days on market $143,000 Active 4 DOM
-
2026-06-16days on market $143,000 Active 3 DOM
-
2026-06-15days on market $143,000 Active 2 DOM
-
2026-06-14remarks 464-char remark
-
2026-06-14$143,000 Active 1 DOM
ⓘ Source: listings_history table (triggers on properties + properties_extension) + one-shot
backfill from property_details.listing_events for pre-trigger history.
Tax reassessment forecast AZ · Resets to sale price
- Current annual tax
- $725 · $60/mo
- Projected year-2 tax
- $944 · $79/mo
- Expected delta
- +$219/yr (+$18/mo · 30.2%)
ⓘ Screening estimate from a state-policy table — verify with the county assessor before closing.
Climate risk First Street
- Flood 1/10 Low FEMA zone X (unshaded) · 0% chance over 30 yrs
- Wildfire 4/10 Moderate
- Heat 9/10 Extreme 7 d/yr ≥114°F today · 15 d/yr by 30 yrs out
- Wind 1/10 Low
- Air quality 1/10 Low 0 unhealthy d/yr today · 0 by 30 yrs out
Nearby sold comps map
Loading sold comps map…
Walkable amenities ~0.75 mi
Loading nearby amenities…
Taxation est. · year 1
- Rental income
- $15,507
- − Mortgage interest
- −$8,010
- − Property taxes
- −$725
- − Insurance
- −$715
- − Repairs & maintenance
- −$1,241
- − Management
- −$1,241
- − Depreciation
- −$4,160
- Taxable loss
- −$584
- Est. tax savings @ 24.0%
- +$140
- After-tax cash flow
- $1,952/yr
For passive investors: Depreciation is non-cash, so a rental often shows a tax loss while cash-flowing — sheltering income. Rental losses are passive: they offset passive income freely, and up to $25,000/yr can offset ordinary (W-2) income if you actively participate and your MAGI is under $100k (phasing out to $0 by $150k); unused losses carry forward. On sale, claimed depreciation is recaptured at up to 25%, and gains may owe capital-gains tax (a 1031 exchange can defer both). Figures are a year-1 estimate at your 24.0% rate — not tax advice; consult a CPA.
Schools (NCES district)
- District
- Topock Elementary District (4376)
- NCES district ID
- 0408640
- Math proficiency
- 45% ▼ -5.00%
- Reading proficiency
- 35% ▲ 5.00%
- Median HH income
- $37,388
- Composite
- 35.73/100
- National rank
- #9658
- State rank
- #209 of 501 in AZ
Livability — Golden Shores
- Score
- 61/100
- State rank
- #155
- US rank
- #17886
Category grades
Schools grade is shown separately in the Schools card above.
Census & demographics
- Census place
- Golden Shores, AZ
- Population (ZIP)
- 1,319
Population outlook (Mohave County) Hauer SSP2
- Today (2025)
- 209,184 people
- By 2030
- 209,674 · +0.2%
- By 2040
- 205,897 · -1.6%
- By 2050
- 196,810 · -5.9%
- By 2075
- 169,454 · -19.0%
- By 2100
- 136,630 · -34.7%
Race, ethnicity, and origin ACS 2023
- Neighborhood character
- Predominantly White (92%)
- Race & ethnicity
- White 92% Hispanic / Latino 5% Native American 2%
- Hispanic origin (detail)
- Cuban 5%
- Common ancestry
- Lithuanian 3% Serbian 3% German 1%
Political lean MEDSL · Mohave
- 2024 margin
- Solid R (+55.8) · D 21.8% · R 77.6%
- 2008→2024 swing
- -22.9pp toward R · 2008: -32.9pp · 2024: -55.8pp
- All cycles
- 2024: R+55.8 2020: R+51.3 2016: R+51.5 2012: R+42.6 2008: R+32.9
Not yet ingested
- Civics
- —
Market trends
- HPI YoY
- ▲ 13.31%
- Current HPI
- 386.168
- Rent YoY
- —
- Metro
- —
- State GDP YoY
- ▲ 4.54%
- F500 in state
- 20
Industry mix (Fortune 500 HQ in AZ)
| Industry | F500 HQs | Revenue |
|---|---|---|
| Technology | 2 | $13B |
|
||
| Mining / Metals | 1 | $23B |
|
||
| Environmental Services | 1 | $16B |
|
||
| Metals / Steel | 1 | $14B |
|
||
| Technology Distribution | 1 | $9B |
|
||
| Homebuilding | 1 | $8B |
|
||
Price history
+1091.7% since first listed7 events — show timeline
- 2026-06-13 Listed $143,000 WARDEX
- 2016-11-03 Sold (MLS) $84,000 WARDEX
- 2016-10-28 Sold (Public Records) $80,000 Public Records
- 2016-10-05 Listed $89,000 WARDEX
- 2002-08-02 Sold (Public Records) $45,000 Public Records
- 2002-06-03 Sold (Public Records) $45,000 Public Records
- 1991-11-19 Sold (Public Records) $12,000 Public Records
Property tax history
+3.1%/yrLatest (2025): $725 · +14.1% YoY. Source: county tax records.
Cash-flow waterfall
monthlySold comps — $/sqft
last 12 mo · ≤1 miLoading sold comps…