 Duplex
786 39th · Lakehills, TX
Flood risk 1/10 · Minimal
- FEMA flood zone
- X (unshaded)
- Chance of flooding over 30 yrs
- 0.0%
- Est. flood insurance / yr
- $507 – $1,088
Fire risk 2/10 · Minimal
- Est. fire insurance / yr
- $1,222 – $2,270
Heat risk 7/10 · Major
- Hot days now (above 106°F)
- 7 days/yr
- Hot days in 30 yrs
- 20 days/yr
Wind risk 6/10 · Moderate
- Chance of severe wind over 30 yrs
- 57.0%
Air-quality risk 1/10 · Minimal
- Unhealthy air days now
- 0 days/yr
- Unhealthy air days in 30 yrs
- 0 days/yr
Risk factors via First Street. Map © Google.
Why this score? — see what drove the B- grade
The composite is a weighted blend of 9 inputs, each scored 0–100. Each bar is that input's sub-score; the figure is the points it added to the 100-point composite (weight × sub-score).
- Cash flow +30.0/30.0
- 1% rule +10.0/10.0
- DSCR +10.0/10.0
- ARV discount +7.5/15.0
- Schools +3.1/10.0
- Livability +3.1/5.0
- Rent growth +2.5/5.0
- Condition / age +2.2/5.0
- Appreciation +0.0/10.0
$160,000
🖨 Deal sheet 📄 Offer letter ✓ Due diligence
Multi-family units
County records classify this as Multi-Family (2-4 Unit). Listing-text estimate: 2 units. confirmed
Listing remarks MLS
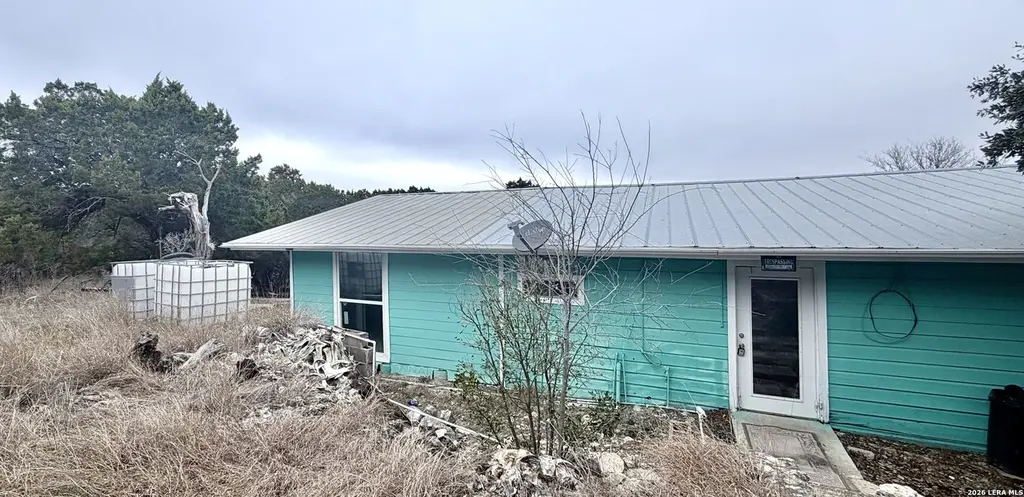
This presents a unique investment opportunity: a single-story duplex currently under construction, offering substantial income potential once completed. The property is conveniently located on a generous 1.24-acre lot within the highly sought-after "Avalon" subdivision in Lakehills, TX. Investors will appreciate the strategic location, poised to benefit from the projected economic expansion of the San Antonio, TX metropolitan area as it extends in this direction. Do not miss out on this rare find!
Key facts
- Income potential
- 1.24-acre lot
- Single-story duplex
Tags
Neighborhood map
What this means for you Summary
Snapshot
- This is a 2 × 2-bed/1.0-bath units multifamily listed at $160k. Condition is rated fair.
Deal economics
- At list price, monthly cash flow is $1k ($13k/yr) — positive. Per door: $533/mo.
- The deal already cash-flows at list — no discount required.
- Meets the 1% rule at list price ($3k rent vs $160k).
- Recommended offer: $146k (9.0% below list) — sets the bar for market timing.
- Cap rate 14.3% vs local median 2.3% in Lakehills — top-decile yield for the area; either an underpriced asset or a hidden risk that comps aren't pricing in. Stress-test before assuming the spread holds.
Location & tenants
- Location reads 62/100 on livability (#963 in TX) — a middle-class / working-renter tenant base. Strengths: cost of living A+, housing A+, crime B+; Watch: schools D-, amenities F, commute F.
- Bandera ISD (rural): math 30% / reading 41% proficiency, ranked #500 of 826 in TX (top 60%) — families likely to look elsewhere, expect single-tenant / working-renter base with shorter leases.
- Market conditions: 267 active listings in the ZIP; 1 comparable units currently listed for rent nearby; 6 units permitted in Bandera County in 2024 (0 in 5+ unit buildings).
Forward outlook
- Local home prices are declining (-3.0%/yr); year-one equity from $1k of loan paydown is wiped out by about $5k of value loss. Plan a longer hold.
- At projected returns (-3.0% appreciation + 3.0% rent growth), your $45k cash investment doubles in ~5 years — after that, you're playing with house money.
Negotiation context
- It's been on market 114 days — a 9% lower offer ($146k) is reasonable based on typical stale-listing flexibility.
Risks & watch-outs
- Climate carrying-cost: major wind risk, 57% chance of damaging wind over 30y; extreme-heat days projected 7→20/yr by 2055 (HVAC capex compounding) — expect insurance premiums to compound above CPI over the hold.
Questions for the listing agent
- It's been on market 114 days. Have you received any prior offers? Is the seller open to a 9% concession, seller financing, or rate buy-down credit?
- Can we see the unit-by-unit rent roll, current vacancy, and any below-market leases? What's the average tenancy length?
- What capital expenditures (roof, boiler, parking lot, exteriors) have been made in the last 5 years, and what's planned in the next 2?
- Have any recent inspections been done? Can we get a copy of the seller's disclosures and any deferred-maintenance estimates?
- Built in 1969 — when were the roof, HVAC, electrical panel, plumbing, and water heater last replaced?
- Why hasn't it sold? Are there any deal-killer items the seller is aware of (foundation, flood, title, zoning, code violations)?
- Is there a deadline driving the sale (1031 exchange, divorce, estate, relocation)? That informs how much negotiation room exists.
- Schools are D-rated, which usually means shorter tenancies and higher turnover. Who's the typical renter profile here, and what's been the actual vacancy rate?
- What's the average days-on-market for RENTAL listings here right now (not sales)? A rising rental-DOM trend means longer vacancies and softer asking-rent achievability than the comps imply.
- What's the recent tenant-quality profile in this submarket — average credit score on applications, eviction rate, late-payment / NSF rate, and stable-employment percentage? A property-management company in the area should have these aggregated.
- How much new apartment / multifamily construction is in the pipeline within 1–3 miles? Heavy new supply (>2% of stock underway) typically softens rents 12–24 months out; light construction supports rent growth.
Investment metrics
- 1% rule
- 1.72% ✓
- Cap rate
- 14.29%
- Cash-on-cash
- 28.57%
- DSCR
- 2.27
- GRM
- 4.8
CMA / ARV
No comps found within radius.
Projected returns pro-forma
-3.0% appreciation · 3.0% rent growth · sell at horizon
- IRR
- 22.9%
- Equity multiple
- 1.94×
- Total profit
- $42,058
- Equity at exit
- $23,857
- IRR
- 30.8%
- Equity multiple
- 3.77×
- Total profit
- $124,280
- Equity at exit
- $13,834
Cash invested: $44,800 (down + closing). Projections, not guarantees.
Landlord ↔ Tenant lean methodology
- Overall (STATE)
- 87 Strongly Landlord-Friendly
- State Texas
- 87 Strongly Landlord-Friendly · R+5
- County
- — inherits STATE
- City
- — inherits STATE
ZIP-level market 78063
- Home prices YoY
- -31.6%
- Active inventory
- 267
- Price-to-rent
- 9.7×
Monthly cashflow live
- Estimated rent
- $2,750 medium interval (Pro) →
- Mortgage (P&I)
- −$839
- Tax est. 1.5%
- −$200 /mo · $2,400/yr
- Insurance
- −$67
- HOA
- −$0
- Vacancy / Maint / Mgmt
- −$578
- Net cashflow
- $1,067
Break-even live
2-unit breakdown (identical units grouped — click to expand)
| Units | Beds | Baths | Est. rent |
|---|---|---|---|
| 2× units | 2 | 1 | $2,750 |
| #1 | 2 | 1 | $1,375 |
| #2 | 2 | 1 | $1,375 |
| Total (2 units) | $2,750 | ||
UW: 25.0% down · 7.5% · 30yr · 1.5% tax · 5.0% vac · 8.0% maint · 8.0% mgmt
Financing live
Cash to close
- Down payment
- $40,000
- Closing costs
- $4,800
- Reserves months
- —
- Total cash needed
- —
Loan-product check · same deal, 3 products live
Conventional
25% down · 7.5% · 30yr
- Down + closing
- —
- Monthly P&I
- —
- Monthly cashflow
- —
- DSCR
- —
- Eligible?
- —
Personal DTI + credit; lowest rate.
DSCR
20% down · 8.5% · 30yr
- Down + closing
- —
- Monthly P&I
- —
- Monthly cashflow
- —
- DSCR
- —
- Eligible?
- —
No personal income docs; deal must DSCR.
Hard money
10% down · 12.0% · 12mo
- Down + closing
- —
- Monthly P&I
- —
- Monthly cashflow
- —
- DSCR
- —
- Eligible?
- —
Short-term bridge; refi at stabilization.
Rent comps 1 comps
| Address | Beds | Baths | Sqft | Rent | $/sqft | DOM | Units | Dist |
|---|---|---|---|---|---|---|---|---|
| 10685 Park Road 37 Unit D Lakehills, TX | 3.0 | 2.0 | 1216 | $1,025 | $0.84 | 14d | 1 | 1.45mi |
Listing history 14 events
-
2026-06-18days on market $160,000 Active 114 DOM
-
2026-06-17days on market $160,000 Active 113 DOM
-
2026-06-16days on market $160,000 Active 112 DOM
-
2026-06-15days on market $160,000 Active 111 DOM
-
2026-06-13days on market $160,000 Active 109 DOM
-
2026-06-09days on market $160,000 Active 105 DOM
-
2026-06-07days on market $160,000 Active 103 DOM
-
2026-06-04days on market $160,000 Active 100 DOM
-
2026-06-03days on market $160,000 Active 99 DOM
-
2026-06-02days on market $160,000 Active 98 DOM
-
2026-06-01days on market $160,000 Active 97 DOM
-
2026-05-31days on market $160,000 Active 96 DOM
-
2026-05-18price $160,000 512-char remark
Show marketing remark (512 chars)
This presents a unique investment opportunity: a single-story duplex currently under construction, offering substantial income potential once completed. The property is conveniently located on a generous 1.24-acre lot within the highly sought-after "Avalon" subdivision in Lakehills, TX. Investors will appreciate the strategic location, poised to benefit from the projected economic expansion of the San Antonio, TX metropolitan area as it extends in this direction. Do not miss out on this rare find!
-
2026-02-24$175,000 New 512-char remark
Show marketing remark (512 chars)
This presents a unique investment opportunity: a single-story duplex currently under construction, offering substantial income potential once completed. The property is conveniently located on a generous 1.24-acre lot within the highly sought-after "Avalon" subdivision in Lakehills, TX. Investors will appreciate the strategic location, poised to benefit from the projected economic expansion of the San Antonio, TX metropolitan area as it extends in this direction. Do not miss out on this rare find!
ⓘ Source: listings_history table (triggers on properties + properties_extension) + one-shot
backfill from property_details.listing_events for pre-trigger history.
Climate risk First Street
- Flood 1/10 Low FEMA zone X (unshaded) · 0% chance over 30 yrs
- Wildfire 2/10 Low
- Heat 7/10 Severe 7 d/yr ≥106°F today · 20 d/yr by 30 yrs out
- Wind 6/10 Major 57% chance of damaging wind over 30 yrs
- Air quality 1/10 Low 0 unhealthy d/yr today · 0 by 30 yrs out
Nearby sold comps map
Loading sold comps map…
Walkable amenities ~0.75 mi
Loading nearby amenities…
Taxation est. · year 1
- Rental income
- $33,000
- − Mortgage interest
- −$8,962
- − Property taxes
- −$2,400
- − Insurance
- −$800
- − Repairs & maintenance
- −$2,640
- − Management
- −$2,640
- − Depreciation
- −$4,655
- Taxable income
- $10,903
- Est. tax owed @ 24.0%
- −$2,617
- After-tax cash flow
- $10,185/yr
For passive investors: Depreciation is non-cash, so a rental often shows a tax loss while cash-flowing — sheltering income. Rental losses are passive: they offset passive income freely, and up to $25,000/yr can offset ordinary (W-2) income if you actively participate and your MAGI is under $100k (phasing out to $0 by $150k); unused losses carry forward. On sale, claimed depreciation is recaptured at up to 25%, and gains may owe capital-gains tax (a 1031 exchange can defer both). Figures are a year-1 estimate at your 24.0% rate — not tax advice; consult a CPA.
Condition & rehab AI · 13 photos
This single-story duplex is currently under construction and presents a unique investment opportunity. However, it requires extensive repairs and updates to improve its condition and increase its resale and rental value.
Repairs flagged
- Major roof — The roof appears to be in poor condition and may need replacement.
- Major exterior siding — The exterior siding is peeling and in need of repainting or replacement.
- Major flooring — The flooring in the kitchen and bathrooms appears to be in poor condition and needs replacement.
- Major interior walls — The interior walls have visible damage and need repainting or repair.
- Major bathrooms — The bathrooms have outdated fixtures and need updates.
- Major kitchen — The kitchen has outdated appliances and needs updates.
- Major HVAC/mechanicals — The HVAC system appears to be old and may need replacement or repair.
Value-add opportunities
- Resale Re-roofing the house — A new roof will improve the home's appearance and increase its resale value.
- Resale Repainting the exterior siding — Repainting the exterior siding will improve the home's appearance and increase its resale value.
- Resale Replacing the flooring — Replacing the flooring will improve the home's appearance and increase its resale value.
- Resale Repainting the interior walls — Repainting the interior walls will improve the home's appearance and increase its resale value.
- Resale Updating the bathrooms — Updating the bathrooms will improve the home's appearance and increase its resale value.
- Resale Updating the kitchen appliances — Updating the kitchen appliances will improve the home's appearance and increase its resale value.
- Resale Replacing the HVAC system — Replacing the HVAC system will improve the home's appearance and increase its resale value.
- Rental Trimming and maintaining the landscaping — Trimming and maintaining the landscaping will improve the home's curb appeal and increase its rental value.
Renovation cost estimate screening
| Repair item | Severity | Est. cost |
|---|---|---|
| roof · The roof appears to be in poor condition and may need replacement. | Major | $15,000–50,000 |
| exterior siding · The exterior siding is peeling and in need of repainting or replacement. | Major | $15,000–50,000 |
| flooring · The flooring in the kitchen and bathrooms appears to be in poor condition and needs replacement. | Major | $15,000–50,000 |
| interior walls · The interior walls have visible damage and need repainting or repair. | Major | $15,000–50,000 |
| bathrooms · The bathrooms have outdated fixtures and need updates. | Major | $15,000–50,000 |
| kitchen · The kitchen has outdated appliances and needs updates. | Major | $15,000–50,000 |
| HVAC/mechanicals · The HVAC system appears to be old and may need replacement or repair. | Major | $15,000–50,000 |
| Total estimated repair cost · 7 items | $105,000–350,000 |
Value-add ROI direction
- Resale Re-roofing the house — A new roof will improve the home's appearance and increase its resale value. ↑
- Resale Repainting the exterior siding — Repainting the exterior siding will improve the home's appearance and increase its resale value. ↑
- Resale Replacing the flooring — Replacing the flooring will improve the home's appearance and increase its resale value. ↑
- Resale Repainting the interior walls — Repainting the interior walls will improve the home's appearance and increase its resale value. ↑
- Resale Updating the bathrooms — Updating the bathrooms will improve the home's appearance and increase its resale value. ↑
- Resale Updating the kitchen appliances — Updating the kitchen appliances will improve the home's appearance and increase its resale value. ↑
- Resale Replacing the HVAC system — Replacing the HVAC system will improve the home's appearance and increase its resale value. ↑
- Rental Trimming and maintaining the landscaping — Trimming and maintaining the landscaping will improve the home's curb appeal and increase its rental value. ↑
ⓘ Cost ranges are severity-bucket heuristics (US national rule-of-thumb). Get contractor quotes + a written scope before underwriting a rehab budget.
Schools (NCES district)
- District
- Bandera ISD
- NCES district ID
- 4809360
- Math proficiency
- 30% ▼ -7.00%
- Reading proficiency
- 41% ▼ -3.00%
- Median HH income
- $48,771
- Composite
- 30.61/100
- National rank
- #6194
- State rank
- #500 of 826 in TX
Livability — Lakehills
- Score
- 62/100
- State rank
- #963
- US rank
- #17024
Category grades
Schools grade is shown separately in the Schools card above.
Census & demographics
- Census place
- Lakehills, TX
- City population
- 10,594
- Population (ZIP)
- 10,594
Population outlook (Bandera County) Hauer SSP2
- Today (2025)
- 22,614 people
- By 2030
- 23,102 · +2.2%
- By 2040
- 23,489 · +3.9%
- By 2050
- 23,264 · +2.9%
- By 2075
- 23,607 · +4.4%
- By 2100
- 22,265 · -1.5%
Race, ethnicity, and origin ACS 2023
- Neighborhood character
- Predominantly White (76%)
- Race & ethnicity
- White 76% Hispanic / Latino 18% Two or more races 15%
- Hispanic origin (detail)
- Mexican 15%
- Common ancestry
- Slovak 5% Romanian 3% Serbian 2%
- Foreign-born
- 5% · Canada
- Languages at home
- 88% English-only · Spanish 9% German/W. Germanic 2%
Political lean MEDSL · Bandera
- 2024 margin
- Solid R (+61.9) · D 18.6% · R 80.5%
- 2008→2024 swing
- -11.5pp toward R · 2008: -50.4pp · 2024: -61.9pp
- All cycles
- 2024: R+61.9 2020: R+59.4 2016: R+63.0 2012: R+59.0 2008: R+50.4
Not yet ingested
- Civics
- —
Market trends
- HPI YoY
- ▼ -87.38%
- Current HPI
- 189.1086
- Rent YoY
- —
- Metro
- —
- State GDP YoY
- ▲ 3.95%
- F500 in state
- 110
Industry mix (Fortune 500 HQ in TX)
| Industry | F500 HQs | Revenue |
|---|---|---|
| Energy | 16 | $1,198B |
|
||
| Technology | 5 | $198B |
|
||
| Engineering / Construction | 4 | $72B |
|
||
| Energy Services | 3 | $60B |
|
||
| Utilities | 3 | $41B |
|
||
| Healthcare | 2 | $330B |
|
||
Price history
-8.6% since first listed2 events — show timeline
- 2026-05-18 Price Changed $160,000 LERA
- 2026-02-24 Listed $175,000 LERA
Cash-flow waterfall
monthlySold comps — $/sqft
last 12 mo · ≤1 miLoading sold comps…