 🏷️ Likely Rental
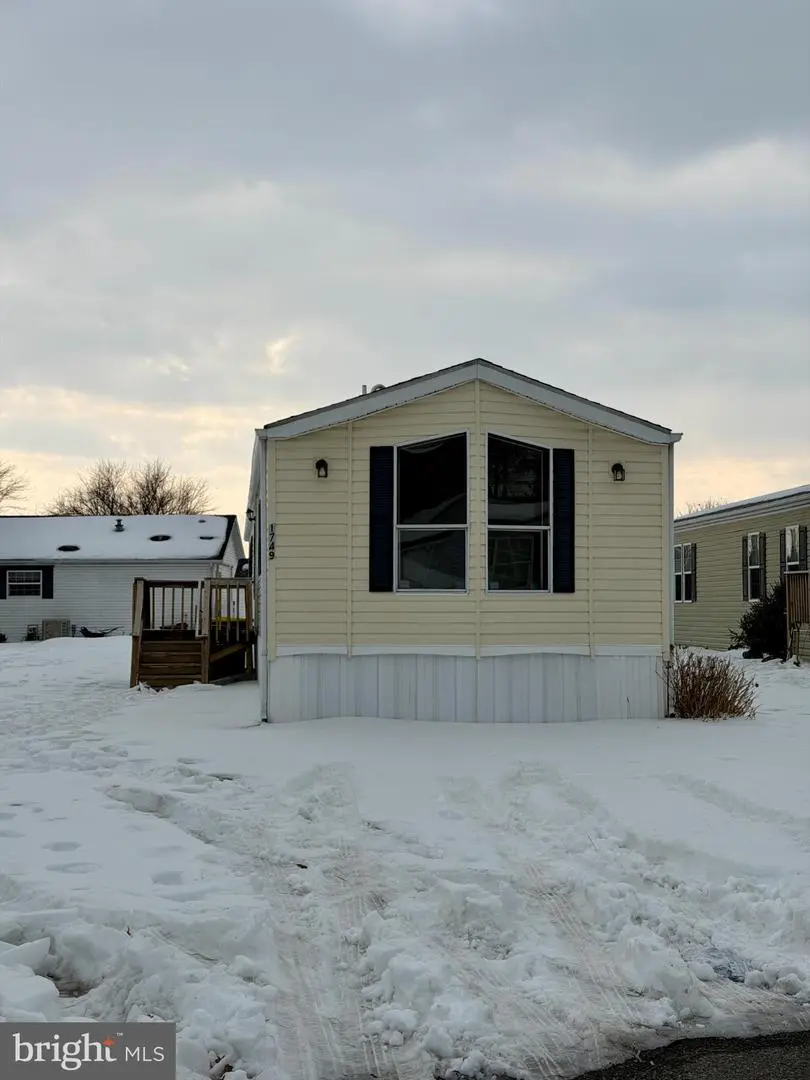
1749 Barbara Cir · Bear, DE
Flood risk No data
- FEMA flood zone
- —
- Chance of flooding over 30 yrs
- —
- Est. flood insurance / yr
- —
Fire risk No data
- Est. fire insurance / yr
- —
Heat risk No data
- Hot days now (above threshold)
- —
- Hot days in 30 yrs
- —
Wind risk No data
- Chance of severe wind over 30 yrs
- —
Air-quality risk No data
- Unhealthy air days now
- —
- Unhealthy air days in 30 yrs
- —
Risk factors via First Street. Map © Google.
Why this score? — see what drove the D+ grade
The composite is a weighted blend of 9 inputs, each scored 0–100. Each bar is that input's sub-score; the figure is the points it added to the 100-point composite (weight × sub-score).
- Cash flow +15.0/30.0
- ARV discount +7.5/15.0
- 1% rule +5.0/10.0
- DSCR +5.0/10.0
- Rent growth +4.8/5.0
- Livability +3.7/5.0
- Schools +2.5/10.0
- Condition / age +2.5/5.0
- Appreciation +0.0/10.0
$15,999
🖨 Deal sheet 📄 Offer letter ✓ Due diligence
Listing remarks
Welcome to Waterford Estates in Bear, Delaware! Water, sewer, trash/recycling, and basic cable are all included in the monthly lot rent. The current market lot rent for a single-wide home is $1,087.00 per month, plus $1.50 for the Relocation Trust Fund. This home is being sold as-is, offering a great opportunity for a buyer ready to add cosmetic updates and personal touches. The seller has never occupied the property and makes no warranties regarding its condition. With a little vision and effort, this three-bedroom home — featuring a primary suite — can truly shine. The layout offers bedrooms at opposite ends of the home for added privacy, with a spacious eat-in kitchen and lar
Key facts
- Large living room
- 2 parking spots
- Built 1992
Tags
Neighborhood map
What this means for you Summary
Snapshot
- This is a 3-bed/2.0-bath other listed at $16k.
Deal economics
- At list price, monthly cash flow is $2k ($23k/yr) — positive.
- The deal already cash-flows at list — no discount required.
- Meets the 1% rule at list price ($3k rent vs $16k).
- Recommended offer: $15k (9.0% below list) — sets the bar for market timing.
- Cap rate 148.3% vs local median 4.7% in Bear — top-decile yield for the area; either an underpriced asset or a hidden risk that comps aren't pricing in. Stress-test before assuming the spread holds.
Location & tenants
- Location reads 73/100 on livability (#8 in DE) — a middle-class / working-renter tenant base. Strengths: housing A+, employment A-, cost of living A-; Watch: crime C-, schools D+, amenities F.
- Christina School District (suburban): math 22% / reading 33% proficiency, ranked #18 of 26 in DE (top 69%) — low school quality limits family demand, transient renter base, plan for 1-2y turnover.
- Market conditions: Rents rising fast (+9.0%/yr); 103 active listings in the ZIP; 9 comparable units currently listed for rent nearby; rentals leasing fast (median 2d on market — plan ~1-2 weeks tenant-placement turnaround); high-income renter base; 1,367 units permitted in New Castle County in 2024 (201 in 5+ unit buildings).
Forward outlook
- Local home prices are declining (-3.0%/yr); year-one equity from $110 of loan paydown is wiped out by about $480 of value loss. Plan a longer hold.
- New Castle County population projected at +9% by 2050 — modest demand growth; plan on rents tracking national, not racing it.
- At projected returns (-3.0% appreciation + 8.0% rent growth), your $4k cash investment doubles in ~1 year — after that, you're playing with house money.
Negotiation context
- It's been on market 115 days — a 9% lower offer ($15k) is reasonable based on typical stale-listing flexibility.
Risks & watch-outs
- Watch-outs: property tax is 2.8% of price.
Questions for the listing agent
- It's been on market 115 days. Have you received any prior offers? Is the seller open to a 9% concession, seller financing, or rate buy-down credit?
- Property tax is high relative to price — has the assessment been appealed recently, and will the sale trigger a re-assessment?
- Why hasn't it sold? Are there any deal-killer items the seller is aware of (foundation, flood, title, zoning, code violations)?
- Is there a deadline driving the sale (1031 exchange, divorce, estate, relocation)? That informs how much negotiation room exists.
- Schools are D-rated, which usually means shorter tenancies and higher turnover. Who's the typical renter profile here, and what's been the actual vacancy rate?
- The area grade is low — what's the realistic commute time and amenity access for the typical tenant pool here? Any planned neighborhood developments (good or bad) we should know about?
- What's the average days-on-market for RENTAL listings here right now (not sales)? A rising rental-DOM trend means longer vacancies and softer asking-rent achievability than the comps imply.
- What's the recent tenant-quality profile in this submarket — average credit score on applications, eviction rate, late-payment / NSF rate, and stable-employment percentage? A property-management company in the area should have these aggregated.
- How much new for-sale + rental construction is in the pipeline within 1–3 miles? Heavy new supply typically softens prices + rents 12–24 months out; constrained supply supports both.
Investment metrics
- 1% rule
- 15.99% ✓
- Cap rate
- 148.26%
- Cash-on-cash
- 507.02%
- DSCR
- 23.56
- GRM
- 0.5
CMA / ARV
- ARV (median comp)
- $61,651
- List price
- $15,999
- Delta
- -74.05%
- Verdict
- UNDERPRICED
- Comps
- 20 within 1.0 mi
Projected returns pro-forma
-3.0% appreciation · 8.0% rent growth · sell at horizon
- IRR
- —
- Equity multiple
- 30.36×
- Total profit
- $131,530
- Equity at exit
- $2,386
- IRR
- —
- Equity multiple
- 75.00×
- Total profit
- $331,506
- Equity at exit
- $1,383
Cash invested: $4,480 (down + closing). Projections, not guarantees.
Landlord ↔ Tenant lean methodology
- Overall (STATE)
- 70 Landlord-Friendly
- State Delaware
- 70 Landlord-Friendly · D+7
- County
- — inherits STATE
- City
- — inherits STATE
ZIP-level market 19701
- Rents YoY
- 9.0%
- Active inventory
- 103
- Price-to-rent
- 0.5×
Monthly cashflow live
- Estimated rent
- $2,559 high interval (Pro) →
- Mortgage (P&I)
- −$84
- Tax from tax record
- −$38 /mo · $456/yr
- Insurance
- −$7
- HOA
- −$0
- Vacancy / Maint / Mgmt
- −$537
- Net cashflow
- $1,893
Break-even live
UW: 25.0% down · 7.5% · 30yr · 1.5% tax · 5.0% vac · 8.0% maint · 8.0% mgmt
Financing live
Cash to close
- Down payment
- $4,000
- Closing costs
- $480
- Reserves months
- —
- Total cash needed
- —
Loan-product check · same deal, 3 products live
Conventional
25% down · 7.5% · 30yr
- Down + closing
- —
- Monthly P&I
- —
- Monthly cashflow
- —
- DSCR
- —
- Eligible?
- —
Personal DTI + credit; lowest rate.
DSCR
20% down · 8.5% · 30yr
- Down + closing
- —
- Monthly P&I
- —
- Monthly cashflow
- —
- DSCR
- —
- Eligible?
- —
No personal income docs; deal must DSCR.
Hard money
10% down · 12.0% · 12mo
- Down + closing
- —
- Monthly P&I
- —
- Monthly cashflow
- —
- DSCR
- —
- Eligible?
- —
Short-term bridge; refi at stabilization.
Rent comps 9 comps
| Address | Beds | Baths | Sqft | Rent | $/sqft | DOM | Units | Dist |
|---|---|---|---|---|---|---|---|---|
| 1 Kennedy Cir Bear, DE | 1.0–3.0 | 1.0–3.0 | 1582 | $3,315 | $2.09 | 1d | 39 | 0.56mi |
| 885 Salem Church Rd Newark, DE | 1.0–2.0 | 1.0–2.0 | 850 | $1,795 | $2.11 | 1d | 1 | 0.60mi |
| 10 McFarland Dr Newark, DE | 2.0 | 2.0 | 1082 | $2,176 | $2.01 | 2d | 2 | 0.79mi |
| 50 Turnberry Ct Bear, DE | 1.0–3.0 | 1.0–3.0 | 1598 | $3,400 | $2.13 | 1d | 194 | 1.03mi |
| 138 Creekside Ct Newark, DE | 2.0 | 2.5 | 1225 | $2,200 | $1.80 | 43d | 1 | 1.13mi |
| 182 Darling St Newark, DE | 3.0 | 2.5 | 1345 | $2,450 | $1.82 | 43d | 1 | 1.18mi |
| 2102 Ashkirk Dr Newark, DE | 1.0–2.0 | 1.0–2.0 | 880 | $1,865 | $2.12 | 1d | 6 | 1.19mi |
| 2139 Valence Pl Newark, DE | 2.0–3.0 | 2.0 | 1183 | $2,505 | $2.12 | 15d | 6 | 1.41mi |
| 325 Barley Dr Newark, DE | 2.0 | 1.5 | 1000 | $1,675 | $1.68 | 24d | 1 | 1.43mi |
Listing history 16 events
-
2026-06-18days on market $15,999 Active 115 DOM
-
2026-06-17days on market $15,999 Active 114 DOM
-
2026-06-15days on market $15,999 Active 113 DOM
-
2026-06-13days on market $15,999 Active 111 DOM
-
2026-06-13days on market $15,999 Active 110 DOM
-
2026-06-09days on market $15,999 Active 107 DOM
-
2026-06-08days on market $15,999 Active 106 DOM
-
2026-06-07days on market $15,999 Active 105 DOM
-
2026-06-04days on market $15,999 Active 102 DOM
-
2026-06-03days on market $15,999 Active 101 DOM
-
2026-06-02days on market $15,999 Active 100 DOM
-
2026-06-01days on market $15,999 Active 99 DOM
-
2026-05-31days on market $15,999 Active 98 DOM
-
2026-05-16historical
-
2026-04-15price $15,999
-
2026-02-13$22,000 Active
ⓘ Source: listings_history table (triggers on properties + properties_extension) + one-shot
backfill from property_details.listing_events for pre-trigger history.
Tax reassessment forecast DE · Partial reset (capped growth)
- Current annual tax
- $456 · $38/mo
- Projected year-2 tax
- $456 · $38/mo
- Expected delta
- $0/yr ($0/mo · 0.0%)
ⓘ Screening estimate from a state-policy table — verify with the county assessor before closing.
Nearby sold comps map
Loading sold comps map…
Walkable amenities ~0.75 mi
Loading nearby amenities…
Taxation est. · year 1
- Rental income
- $30,703
- − Mortgage interest
- −$896
- − Property taxes
- −$456
- − Insurance
- −$80
- − Repairs & maintenance
- −$2,456
- − Management
- −$2,456
- − Depreciation
- −$465
- Taxable income
- $23,893
- Est. tax owed @ 24.0%
- −$5,734
- After-tax cash flow
- $16,979/yr
For passive investors: Depreciation is non-cash, so a rental often shows a tax loss while cash-flowing — sheltering income. Rental losses are passive: they offset passive income freely, and up to $25,000/yr can offset ordinary (W-2) income if you actively participate and your MAGI is under $100k (phasing out to $0 by $150k); unused losses carry forward. On sale, claimed depreciation is recaptured at up to 25%, and gains may owe capital-gains tax (a 1031 exchange can defer both). Figures are a year-1 estimate at your 24.0% rate — not tax advice; consult a CPA.
Schools (NCES district)
- District
- Christina School District
- NCES district ID
- 1000200
- Math proficiency
- 22% ▼ -12.00%
- Reading proficiency
- 33% ▼ -5.00%
- Median HH income
- $58,838
- Composite
- 24.93/100
- National rank
- #7567
- State rank
- #18 of 26 in DE
Livability — Bear
- Score
- 73/100
- State rank
- #8
- US rank
- #5158
Category grades
Schools grade is shown separately in the Schools card above.
Census & demographics
- Census place
- Bear, DE
- County
- New Castle County · 483,412 people
- City population
- 42,984
- Metro
- Philadelphia-Camden-Wilmington, PA-NJ-DE-MD
- Population (ZIP)
- 42,984
- Household income
- $111,198
- Rent vs Own
- Severe rent burden
- 619.0
Population outlook (New Castle County) Hauer SSP2
- Today (2025)
- 594,686 people
- By 2030
- 609,164 · +2.4%
- By 2040
- 632,154 · +6.3%
- By 2050
- 649,068 · +9.1%
- By 2075
- 687,771 · +15.7%
- By 2100
- 694,961 · +16.9%
Race, ethnicity, and origin ACS 2023
- Neighborhood character
- Diverse neighborhood (Simpson 0.67)
- Race & ethnicity
- White 50% Black 26% Hispanic / Latino 11% Asian 10% Two or more races 7%
- Hispanic origin (detail)
- Mexican 4% Puerto Rican 4%
- Common ancestry
- Romanian 4% Lithuanian 2% Slovak 1%
- Foreign-born
- 17% · Canada, China, Vietnam
- Languages at home
- 78% English-only · Spanish 8% Other Asian/Pacific 3% Other Indo-European 3%
Political lean MEDSL · New Castle
- 2024 margin
- Solid D (+32.6) · D 65.5% · R 32.9% · Other 1.6%
- 2008→2024 swing
- -8.1pp toward R · 2008: 40.6pp · 2024: 32.6pp
- All cycles
- 2024: D+32.6 2020: D+37.1 2016: D+29.6 2012: D+34.1 2008: D+40.6
Not yet ingested
- Civics
- —
Market trends
- HPI YoY
- ▼ -159.00%
- Current HPI
- 261.2988
- Rent YoY
- ▲ 9.03%
- Metro
- Philadelphia-Camden-Wilmington, PA-NJ-DE-MD
- State GDP YoY
- —
- F500 in state
- 0
Price history
-27.3% since first listed3 events — show timeline
- 2026-05-16 Listing Removed — BRIGHT MLS
- 2026-04-15 Price Changed $15,999 BRIGHT MLS
- 2026-02-13 Listed $22,000 BRIGHT MLS
Property tax history
+2.9%/yrLatest (2024): $456 · +2.8% YoY. Source: county tax records.
Cash-flow waterfall
monthlySold comps — $/sqft
last 12 mo · ≤1 miLoading sold comps…