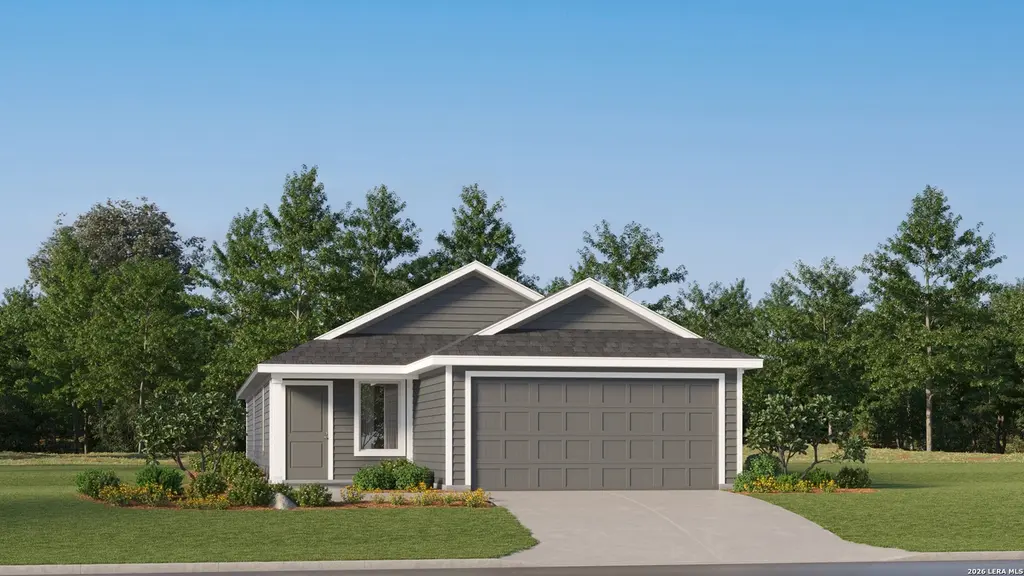
418 River Run Way · San Antonio, TX
Flood risk 1/10 · Minimal
- FEMA flood zone
- X (unshaded)
- Chance of flooding over 30 yrs
- 0.0%
- Est. flood insurance / yr
- $507 – $1,088
Fire risk 4/10 · Minor
- Est. fire insurance / yr
- $1,222 – $2,270
Heat risk 8/10 · Major
- Hot days now (above 108°F)
- 7 days/yr
- Hot days in 30 yrs
- 22 days/yr
Wind risk 8/10 · Major
- Chance of severe wind over 30 yrs
- 80.0%
Air-quality risk 2/10 · Minimal
- Unhealthy air days now
- 0 days/yr
- Unhealthy air days in 30 yrs
- 2 days/yr
Risk factors via First Street. Map © Google.
Why this score? — see what drove the D- grade
The composite is a weighted blend of 9 inputs, each scored 0–100. Each bar is that input's sub-score; the figure is the points it added to the 100-point composite (weight × sub-score).
- Cash flow +8.1/30.0
- ARV discount +7.7/15.0
- Appreciation +6.4/10.0
- Rent growth +4.4/5.0
- Livability +4.0/5.0
- 1% rule +2.7/10.0
- Condition / age +2.5/5.0
- DSCR +2.1/10.0
- Schools +1.4/10.0
$225,999
🖨 Deal sheet 📄 Offer letter ✓ Due diligence
Listing remarks
The Pinehollow - This single-level home showcases a spacious open floorplan shared between the kitchen, dining area and family room for easy entertaining. An owner's suite enjoys a private location in a rear corner of the home, complemented by an en-suite bathroom and walk-in closet. There are three secondary bedrooms along the side of the home, which are comfortable spaces for household members and overnight guests. The completion date, prices and features may vary and are subject to change. Please verify with Lennar directly. Estimated Completion June 2026. The completion date, prices and features may vary and are subject to change. Please verify with Lennar directly. Photos are for illus
Key facts
- Walk-in closet
- Open floorplan
- Secondary bedrooms
Tags
Neighborhood map
What this means for you Summary
Snapshot
- This is a 4-bed/2.0-bath single-family listed at $226k.
Deal economics
- At list price, monthly cash flow is $-224 ($-3k/yr) — negative.
- To cash-flow at today's rent, offer at most $194k (14.4% below list).
- To meet the 1% rule (rent ≥ 1% of price), the offer needs to be $173k (23.4% below list).
- Recommended offer: $173k (23.4% below list) — sets the bar for 1% rule.
- Cap rate 5.1% vs local median 3.8% in San Antonio — top-decile yield for the area; either an underpriced asset or a hidden risk that comps aren't pricing in. Stress-test before assuming the spread holds.
Location & tenants
- Location reads 80/100 on livability (#31 in TX, #1,616 nationally) — a professional / high-income tenant draw. Strengths: amenities A+, commute A+, cost of living A+; Watch: crime F.
- San Antonio ISD (urban): math 12% / reading 22% proficiency, ranked #805 of 826 in TX (top 98%) — low school quality limits family demand, transient renter base, plan for 1-2y turnover; 80% free/reduced lunch — lower-income household profile, screen leases tightly.
- Zoned schools: Hirsch El (math 10% / reading 16%, grade F, #4,152 of 4,322 statewide, top 96%, 533 students, 95% FRL); Houston H S (math 12% / reading 18%, grade F, #1,507 of 1,632 statewide, top 93%, 856 students, 95% FRL) — zoned schools average 95% FRL vs 80% district-wide (15 pts higher); higher-poverty schools than district average — tighter screening recommended.
- Market conditions: Rents rising fast (+7.7%/yr); 66 active listings in the ZIP; 24 comparable units currently listed for rent nearby; rentals at typical pace (median 24d on market — plan ~3-4 weeks tenant-placement turnaround); 8,308 units permitted in Bexar County in 2024 (2,506 in 5+ unit buildings).
- This rent runs 40% of the median local income ($52k/yr) — at the standard rent-burdened threshold; future hikes will face affordability resistance.
Forward outlook
- In year one you build about $8k of equity ($2k loan paydown + $6k appreciation (2.7% local appreciation)).
- Bexar County population projected at +50% by 2050 — long-run rental-demand tailwind backs the buy-and-hold thesis.
- By year 5, paydown + projected appreciation supports a ~$34k cash-out refi (75% LTV) — recoverable capital for the next deal without selling this one.
Negotiation context
- It's been on market 15 days — a 2% lower offer ($223k) is reasonable based on typical stale-listing flexibility.
Risks & watch-outs
- Climate carrying-cost: severe wind risk, 80% chance of damaging wind over 30y; extreme-heat days projected 7→22/yr by 2055 (HVAC capex compounding) — expect insurance premiums to compound above CPI over the hold.
Questions for the listing agent
- What do current leases actually rent for vs. the listed asking? Can we see a recent rent roll and the last 12 months of T-12 income?
- What does the HOA fee cover, when was the last increase, and are there any pending special assessments or reserve-fund shortfalls?
- Is there a deadline driving the sale (1031 exchange, divorce, estate, relocation)? That informs how much negotiation room exists.
- Crime grade is F in this area — have there been break-ins, vandalism, or insurance claims at this property in the last 3 years? What carrier currently insures it and at what premium?
- The area grade is low — what's the realistic commute time and amenity access for the typical tenant pool here? Any planned neighborhood developments (good or bad) we should know about?
- What's the average days-on-market for RENTAL listings here right now (not sales)? A rising rental-DOM trend means longer vacancies and softer asking-rent achievability than the comps imply.
- What's the recent tenant-quality profile in this submarket — average credit score on applications, eviction rate, late-payment / NSF rate, and stable-employment percentage? A property-management company in the area should have these aggregated.
- How much new for-sale + rental construction is in the pipeline within 1–3 miles? Heavy new supply typically softens prices + rents 12–24 months out; constrained supply supports both.
Investment metrics
- 1% rule
- 0.77% ✗
- Cap rate
- 5.10%
- Cash-on-cash
- -4.25%
- DSCR
- 0.81
- GRM
- 10.9
CMA / ARV
- ARV (on-the-fly)
- $227,200
- Comps found
- 12
Show comp detail 12 sales within ~0.75 mi
| Address | Dist | Beds/Ba | Sqft | Sold | Price | $/sf | Match |
|---|---|---|---|---|---|---|---|
| 418 River Run Way | 0.00mi | 4/2.0 | 1,600 (0%) | 1mo | $225,999 | $141 | 99 |
| 451 River Run Way | 0.06mi | 4/2.0 | 1,600 (0%) | 2mo | $220,999 | $138 | 96 |
| 450 River Run Way | 0.04mi | 4/2.0 | 1,575 (-2%) | 2mo | $217,999 | $138 | 94 |
| 463 River Run Way | 0.08mi | 4/2.0 | 1,600 (0%) | 2mo | $217,999 | $136 | 94 |
| 527 River Run Way | 0.20mi | 4/2.0 | 1,600 (0%) | 2mo | $211,999 | $132 | 89 |
| 402 River Run Way | 0.03mi | 3/2.0 (-1) | 1,411 (-12%) | 1mo | $214,999 | $152 | 73 |
| 410 River Run Way | 0.02mi | 3/2.0 (-1) | 1,402 (-12%) | 1mo | $209,999 | $150 | 73 |
| 442 River Run Way | 0.02mi | 3/2.0 (-1) | 1,402 (-12%) | 2mo | $209,999 | $150 | 72 |
| 443 River Run Way | 0.06mi | 3/2.0 (-1) | 1,402 (-12%) | 1mo | $211,999 | $151 | 71 |
| 458 River Run Way | 0.05mi | 3/2.0 (-1) | 1,402 (-12%) | 2mo | $200,999 | $143 | 70 |
| 503 River Run Way | 0.08mi | 3/2.0 (-1) | 1,402 (-12%) | 4mo | $198,999 | $142 | 67 |
| 202 Reuben Kemper | 0.33mi | 3/2.0 (-1) | 1,450 (-9%) | 2mo | $200,000 | $138 | 63 |
Match score weights: distance 35% · size 25% · config 20% · recency 20%. Top-matched comps best support the ARV.
Projected returns pro-forma
2.73% appreciation · 7.72% rent growth · sell at horizon
- IRR
- 5.0%
- Equity multiple
- 1.29×
- Total profit
- $18,368
- Equity at exit
- $98,190
- IRR
- 10.5%
- Equity multiple
- 2.67×
- Total profit
- $105,367
- Equity at exit
- $148,710
Cash invested: $63,280 (down + closing). Projections, not guarantees.
Landlord ↔ Tenant lean methodology
- Overall (STATE)
- 87 Strongly Landlord-Friendly
- State Texas
- 87 Strongly Landlord-Friendly · R+5
- County
- — inherits STATE
- City
- — inherits STATE
ZIP-level market 78219
- Home prices YoY
- 0.8%
- Rents YoY
- 7.7%
- Active inventory
- 66
- Price-to-rent
- 10.9×
Monthly cashflow live
- Estimated rent
- $1,731 high interval (Pro) →
- Mortgage (P&I)
- −$1,185
- Tax est. 1.5%
- −$282 /mo · $3,390/yr
- Insurance
- −$94
- HOA
- −$30
- Vacancy / Maint / Mgmt
- −$363
- Net cashflow
- $-224
Break-even live
UW: 25.0% down · 7.5% · 30yr · 1.5% tax · 5.0% vac · 8.0% maint · 8.0% mgmt
Financing live
Cash to close
- Down payment
- $56,500
- Closing costs
- $6,780
- Reserves months
- —
- Total cash needed
- —
Loan-product check · same deal, 3 products live
Conventional
25% down · 7.5% · 30yr
- Down + closing
- —
- Monthly P&I
- —
- Monthly cashflow
- —
- DSCR
- —
- Eligible?
- —
Personal DTI + credit; lowest rate.
DSCR
20% down · 8.5% · 30yr
- Down + closing
- —
- Monthly P&I
- —
- Monthly cashflow
- —
- DSCR
- —
- Eligible?
- —
No personal income docs; deal must DSCR.
Hard money
10% down · 12.0% · 12mo
- Down + closing
- —
- Monthly P&I
- —
- Monthly cashflow
- —
- DSCR
- —
- Eligible?
- —
Short-term bridge; refi at stabilization.
Rent comps 24 comps
| Address | Beds | Baths | Sqft | Rent | $/sqft | DOM | Units | Dist |
|---|---|---|---|---|---|---|---|---|
| 462 River Run Way San Antonio, TX | 3.0 | 2.0 | 1411 | $1,555 | $1.10 | 23d | 1 | 0.06mi |
| 463 River Run Way San Antonio, TX | 4.0 | 2.0 | 1600 | $1,545 | $0.97 | 21d | 1 | 0.06mi |
| 414 Retama Pass San Antonio, TX | 3.0 | 2.5 | 1836 | $1,800 | $0.98 | 23d | 1 | 0.20mi |
| 535 Wild Olive Way San Antonio, TX | 3.0 | 2.0 | 1570 | $1,550 | $0.99 | 4d | 1 | 0.24mi |
| 603 Wild Olive Way San Antonio, TX | 3.0 | 2.0 | 1207 | $1,600 | $1.33 | 23d | 1 | 0.26mi |
| 6410 Magee Run San Antonio, TX | 3.0 | 2.0 | 1450 | $1,715 | $1.18 | 10d | 1 | 0.27mi |
| 242 Ambush Rdg San Antonio, TX | 3.0 | 2.0 | 1276 | $1,495 | $1.17 | 23d | 1 | 0.28mi |
| 6102 Walnut Way San Antonio, TX | 4.0 | 2.5 | 1611 | $1,750 | $1.09 | 43d | 1 | 0.29mi |
| 6110 Willow Point Blvd San Antonio, TX | 3.0 | 2.5 | 1833 | $1,795 | $0.98 | 20d | 1 | 0.29mi |
| 6110 Willow Point Blvd Unit NA San Antonio, TX | 3.0 | 2.5 | 1850 | $1,750 | $0.95 | 23d | 1 | 0.29mi |
| 6110 Willow Point Blvd San Antonio, TX | 3.0 | 2.5 | 1833 | $1,795 | $0.98 | 10d | 1 | 0.29mi |
| 6422 Magee Run San Antonio, TX | 3.0 | 2.0 | 1450 | $1,690 | $1.17 | 23d | 1 | 0.29mi |
| 6422 Magee Run San Antonio, TX | 3.0 | 2.0 | 1450 | $1,690 | $1.17 | 17d | 1 | 0.29mi |
| 6422 Magee Run San Antonio, TX | 3.0 | 2.0 | 1450 | $1,550 | $1.07 | 1d | 1 | 0.29mi |
| 550 Retama Pass San Antonio, TX | 3.0 | 2.0 | 1207 | $1,750 | $1.45 | 4d | 1 | 0.32mi |
| 115 Katy Post San Antonio, TX | 4.0 | 2.5 | 1725 | $1,995 | $1.16 | 23d | 1 | 0.33mi |
| 6406 Kemper Pl San Antonio, TX | 3.0 | 2.0 | 1450 | $1,499 | $1.03 | 14d | 1 | 0.34mi |
| 627 Retama Pass San Antonio, TX | 4.0 | 2.5 | 1776 | $1,900 | $1.07 | 23d | 1 | 0.35mi |
| 422 De Herrera San Antonio, TX | 3.0 | 2.0 | 1450 | $1,595 | $1.10 | 23d | 1 | 0.36mi |
| 422 De Herrera San Antonio, TX | 3.0 | 2.0 | 1450 | $1,625 | $1.12 | 43d | 1 | 0.36mi |
| 6427 Kemper Pl San Antonio, TX | 3.0 | 2.0 | 1266 | $1,700 | $1.34 | 17d | 1 | 0.39mi |
| 134 Samuel Kemper San Antonio, TX | 3.0 | 2.0 | 1450 | $1,550 | $1.07 | 12d | 1 | 0.42mi |
| 6334 Willow Point Blvd San Antonio, TX | 3.0 | 2.0 | 1497 | $1,797 | $1.20 | 23d | 1 | 0.43mi |
| 5847 Tree View St San Antonio, TX | 3.0 | 2.0 | 1362 | $1,900 | $1.40 | 17d | 1 | 0.70mi |
HOA detail
- Monthly dues
- $30 · $360/yr
Listing history 6 events
-
2026-04-08status Pending
-
2026-04-07price $225,999
-
2026-04-02price $229,999
-
2026-03-31price $231,999
-
2026-03-28price $228,999
-
2026-03-24$238,999 New
ⓘ Source: listings_history table (triggers on properties + properties_extension) + one-shot
backfill from property_details.listing_events for pre-trigger history.
Climate risk First Street
- Flood 1/10 Low FEMA zone X (unshaded) · 0% chance over 30 yrs
- Wildfire 4/10 Moderate
- Heat 8/10 Severe 7 d/yr ≥108°F today · 22 d/yr by 30 yrs out
- Wind 8/10 Severe 80% chance of damaging wind over 30 yrs
- Air quality 2/10 Low 0 unhealthy d/yr today · 2 by 30 yrs out
Nearby sold comps map
Loading sold comps map…
Walkable amenities ~0.75 mi
Loading nearby amenities…
Taxation est. · year 1
- Rental income
- $20,771
- − Mortgage interest
- −$12,659
- − Property taxes
- −$3,390
- − Insurance
- −$1,130
- − Repairs & maintenance
- −$1,662
- − Management
- −$1,662
- − HOA
- −$360
- − Depreciation
- −$6,575
- Taxable loss
- −$6,666
- Est. tax savings @ 24.0%
- +$1,600
- After-tax cash flow
- $-1,093/yr
For passive investors: Depreciation is non-cash, so a rental often shows a tax loss while cash-flowing — sheltering income. Rental losses are passive: they offset passive income freely, and up to $25,000/yr can offset ordinary (W-2) income if you actively participate and your MAGI is under $100k (phasing out to $0 by $150k); unused losses carry forward. On sale, claimed depreciation is recaptured at up to 25%, and gains may owe capital-gains tax (a 1031 exchange can defer both). Figures are a year-1 estimate at your 24.0% rate — not tax advice; consult a CPA.
Schools (NCES district)
- District
- San Antonio ISD
- NCES district ID
- 4838730
- Math proficiency
- 12% ▼ -21.00%
- Reading proficiency
- 22% ▼ -7.00%
- Median HH income
- $30,952
- Composite
- 13.57/100
- National rank
- #9512
- State rank
- #805 of 826 in TX
Livability — San Antonio
- Score
- 80/100
- State rank
- #31
- US rank
- #1616
Category grades
Schools grade is shown separately in the Schools card above.
Census & demographics
- Census place
- San Antonio, TX
- County
- Bexar County · 1,990,555 people
- City population
- 1,806,925
- Metro
- San Antonio-New Braunfels, TX
- Population (ZIP)
- 17,924
- Household income
- $52,094
- Rent vs Own
- Severe rent burden
- 852.0
Population outlook (Bexar County) Hauer SSP2
- Today (2025)
- 2,336,851 people
- By 2030
- 2,560,728 · +9.6%
- By 2040
- 3,020,569 · +29.3%
- By 2050
- 3,493,522 · +49.5%
- By 2075
- 4,668,459 · +99.8%
- By 2100
- 5,533,242 · +136.8%
Race, ethnicity, and origin ACS 2023
- Neighborhood character
- Diverse neighborhood (Simpson 0.63)
- Race & ethnicity
- Hispanic / Latino 53% Two or more races 27% Black 26% White 16% Asian 1%
- Hispanic origin (detail)
- Mexican 45%
- Common ancestry
- Lithuanian 1% Romanian 1% Slovak 1%
- Foreign-born
- 13% · Canada
- Languages at home
- 67% English-only · Spanish 31% Vietnamese 1%
Political lean MEDSL · Bexar
- 2024 margin
- Lean D (+9.8) · D 54.3% · R 44.6% · Other 1.1%
- 2008→2024 swing
- +4.2pp toward D · 2008: 5.6pp · 2024: 9.8pp
- All cycles
- 2024: D+9.8 2020: D+18.2 2016: D+13.5 2012: D+4.6 2008: D+5.6
Not yet ingested
- Civics
- —
Market trends
- HPI YoY
- ▲ 2.73%
- Current HPI
- 328.5107
- Rent YoY
- ▲ 7.72%
- Metro
- San Antonio-New Braunfels, TX
- State GDP YoY
- ▲ 3.95%
- F500 in state
- 110
Industry mix (Fortune 500 HQ in TX)
| Industry | F500 HQs | Revenue |
|---|---|---|
| Energy | 16 | $1,198B |
|
||
| Technology | 5 | $198B |
|
||
| Engineering / Construction | 4 | $72B |
|
||
| Energy Services | 3 | $60B |
|
||
| Utilities | 3 | $41B |
|
||
| Healthcare | 2 | $330B |
|
||
Price history
-5.4% since first listed6 events — show timeline
- 2026-04-08 Pending — LERA
- 2026-04-07 Price Changed $225,999 LERA
- 2026-04-02 Price Changed $229,999 LERA
- 2026-03-31 Price Changed $231,999 LERA
- 2026-03-28 Price Changed $228,999 LERA
- 2026-03-24 Listed $238,999 LERA
Cash-flow waterfall
monthlySold comps — $/sqft
last 12 mo · ≤1 miLoading sold comps…