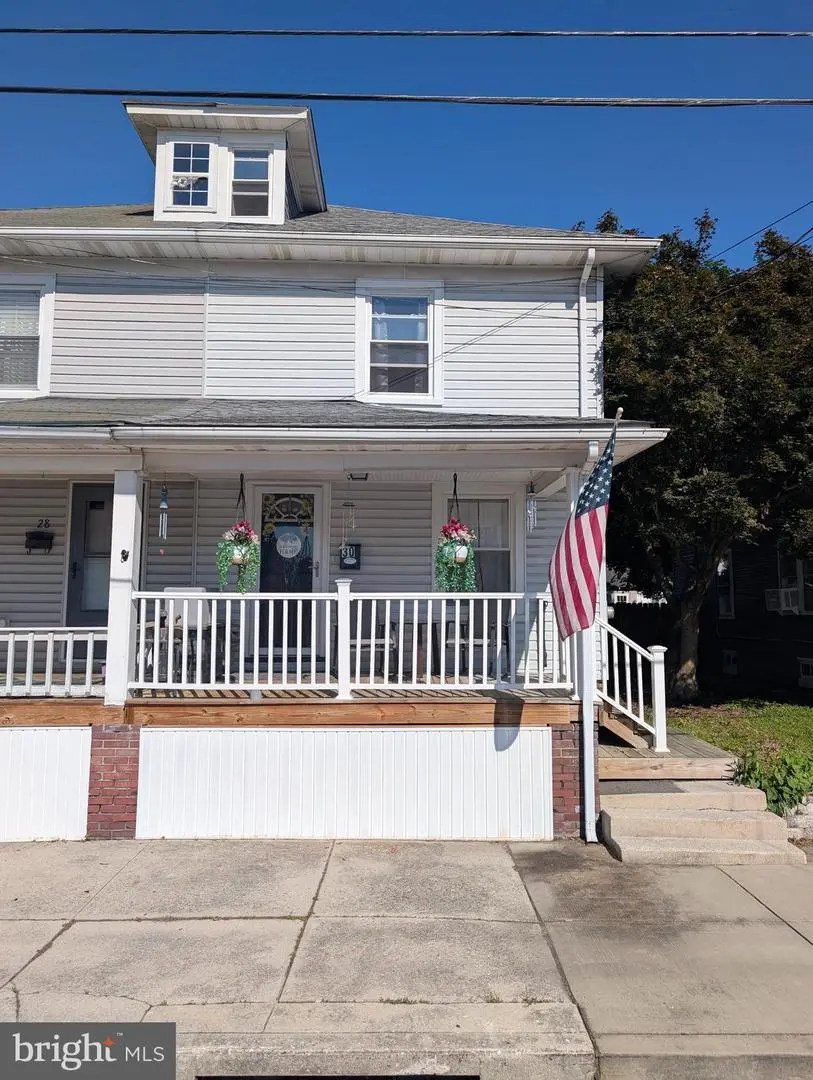
30 N Penn St · Hanover, PA
Flood risk 1/10 · Minimal
- FEMA flood zone
- X (unshaded)
- Chance of flooding over 30 yrs
- 0.0%
- Est. flood insurance / yr
- $473 – $860
Fire risk 1/10 · Minimal
- Est. fire insurance / yr
- $511 – $949
Heat risk 6/10 · Moderate
- Hot days now (above 102°F)
- 7 days/yr
- Hot days in 30 yrs
- 15 days/yr
Wind risk 4/10 · Minor
- Chance of severe wind over 30 yrs
- 8.0%
Air-quality risk 2/10 · Minimal
- Unhealthy air days now
- 1 days/yr
- Unhealthy air days in 30 yrs
- 3 days/yr
Risk factors via First Street. Map © Google.
Why this score? — see what drove the F grade
The composite is a weighted blend of 9 inputs, each scored 0–100. Each bar is that input's sub-score; the figure is the points it added to the 100-point composite (weight × sub-score).
- Cash flow +6.0/30.0
- Livability +3.8/5.0
- Rent growth +3.7/5.0
- Schools +3.7/10.0
- Condition / age +2.5/5.0
- 1% rule +1.4/10.0
- DSCR +0.4/10.0
- ARV discount +0.0/15.0
- Appreciation +0.0/10.0
$205,000
🖨 Deal sheet 📄 Offer letter ✓ Due diligence
Listing remarks MLS
Welcome to 30 Penn St in Hanover, located in Hanover Public School District. This FULLY renovated Colonial-style home offers 4 bedrooms and 1 bathroom, making it a perfect choice for comfortable and convenient living. Exterior renovations include repaired and cleaned gutters, new windows, and updated landscaping, giving the home a refreshed and appealing curb appeal. The front porch features new vinyl railing, new steps, and decking. Inside, the living room welcomes you with new paint, carpet flooring, and natural light. The dining room offers a perfect space for meals and gatherings, with new paint, vinyl plank flooring, and modern lighting fixtures. The custom kitchen showcases a complete transformation with new cabinets, countertops, and appliances. The fresh paint, vinyl plank flooring, and new lighting create an inviting atmosphere for culinary creativity. The second floor features three bedrooms, each with new paint, carpet flooring, and updated interior doors and hardware. The bathroom on this level has been completely remodeled with new fixtures, tub, tile surround, and vinyl flooring. The third floor boasts a private bedroom with new paint, carpet flooring, and a baseboard heater, providing a cozy and comfortable space. Additional highlights of this home include a basement with a freshly painted stairwell, new interior door and hardware, drylock walls, and improved lighting. The back porch features T-111 walls and ceiling, a new exterior door with weatherstripping, and a storm door. The entire house has undergone extensive renovations, including a new HVAC system, hot water heater, electrical panel, and updated wiring. Don't miss the opportunity to own this fully renovated home in the Hanover Borough. Schedule a showing today and experience the exceptional quality and thoughtful updates firsthand.
Key facts
- Built 1920
Property features AI
Finance
- Other: Below-grade area approximately 600 (unfinished); Above-grade finished area approximately 1,440 (estimated)
- HOA & community: Ground rent paid annually
Exterior
- Parking: Off-street parking
- Utilities: Public water; Public sewer; Municipal trash service; Natural gas hot water
- Home design: Semi-detached; Fee simple ownership; Major renovation in 2023 (effective year)
- Construction: Vinyl siding; Aluminum siding; Brick/mortar foundation; Above-grade structures present; Full basement
- Exterior features: Porch(es); Not in a federal flood zone; Multiple access exits
Interior
- Bedrooms: Three bedrooms on the first upper level; One bedroom on the second upper level
- Flooring: Luxury vinyl plank; Carpet
- Bathrooms: One full bathroom
- Heating & cooling: Forced air heating (natural gas); Central air conditioning
- Interior features: Upgraded countertops; Tub with shower
Neighborhood map
What this means for you Summary
Snapshot
- This is a 3-bed/1.5-bath townhouse listed at $205k.
Deal economics
- At list price, monthly cash flow is $-391 ($-5k/yr) — negative.
- To cash-flow at today's rent, offer at most $136k (33.7% below list).
- To meet the 1% rule (rent ≥ 1% of price), the offer needs to be $132k (35.8% below list).
- Recommended offer: $132k (35.8% below list) — sets the bar for 1% rule.
Location & tenants
- Location reads 76/100 on livability (#373 in PA, #3,295 nationally) — a middle-class / working-renter tenant base. Strengths: cost of living A+, housing A+, health & safety A+; Watch: amenities C-, employment D, commute F.
- Hanover Public SD (urban): math 34% / reading 54% proficiency, ranked #294 of 539 in PA (top 54%) — families likely to look elsewhere, expect single-tenant / working-renter base with shorter leases.
- Zoned schools: Hanover Shs (math 67%, 585 students, 64% FRL) — zoned schools average 64% FRL vs 49% district-wide (15 pts higher); higher-poverty schools than district average — tighter screening recommended.
- Market conditions: Rents rising fast (+4.7%/yr); 386 active listings in the ZIP; 15 comparable units currently listed for rent nearby; rentals at typical pace (median 21d on market — plan ~3-4 weeks tenant-placement turnaround); solid renter incomes; 1,328 units permitted in York County in 2024 (338 in 5+ unit buildings).
Forward outlook
- Local home prices are declining (-3.0%/yr); year-one equity from $1k of loan paydown is wiped out by about $6k of value loss. Plan a longer hold.
Negotiation context
- Only 1 days on market — expect competitive offers; lowballing is unlikely to land.
- 2 sale attempts since 18y ago; this cycle's ask is 17% above the opening price — seller raised mid-cycle; expect resistance to lowballs.
- Current owner paid $174k; 18% above their basis — modest negotiation headroom, anchor on the comps not their cost.
Risks & watch-outs
- Watch-outs: built in 1920 — expect roof / HVAC / electrical / plumbing capex.
- Climate carrying-cost: extreme-heat days projected 7→15/yr by 2055 (HVAC capex compounding) — expect insurance premiums to compound above CPI over the hold.
Questions for the listing agent
- What do current leases actually rent for vs. the listed asking? Can we see a recent rent roll and the last 12 months of T-12 income?
- Built in 1920 — when were the roof, HVAC, electrical panel, plumbing, and water heater last replaced?
- Is there a deadline driving the sale (1031 exchange, divorce, estate, relocation)? That informs how much negotiation room exists.
- The area grade is low — what's the realistic commute time and amenity access for the typical tenant pool here? Any planned neighborhood developments (good or bad) we should know about?
- What's the average days-on-market for RENTAL listings here right now (not sales)? A rising rental-DOM trend means longer vacancies and softer asking-rent achievability than the comps imply.
- What's the recent tenant-quality profile in this submarket — average credit score on applications, eviction rate, late-payment / NSF rate, and stable-employment percentage? A property-management company in the area should have these aggregated.
- How much new for-sale + rental construction is in the pipeline within 1–3 miles? Heavy new supply typically softens prices + rents 12–24 months out; constrained supply supports both.
Investment metrics
- 1% rule
- 0.64% ✗
- Cap rate
- 4.01%
- Cash-on-cash
- -8.17%
- DSCR
- 0.64
- GRM
- 13.0
CMA / ARV
- ARV (on-the-fly)
- $171,648
- Comps found
- 12
Show comp detail 12 sales within ~0.75 mi
| Address | Dist | Beds/Ba | Sqft | Sold | Price | $/sf | Match |
|---|---|---|---|---|---|---|---|
| 633 E Middle St | 0.30mi | 3/1.0 | 1,176 (+2%) | 9mo | $125,000 | $106 | 73 |
| 117 Fulton St | 0.34mi | 3/1.0 | 1,120 (-3%) | 8mo | $164,000 | $146 | 71 |
| 36 Ridge Ave | 0.27mi | 3/1.0 | 1,267 (+10%) | 4mo | $191,000 | $151 | 65 |
| 608 Spring Ave | 0.68mi | 3/1.5 | 1,160 (+1%) | 6mo | $195,000 | $168 | 62 |
| 714 Randolph St | 0.72mi | 2/2.0 (-1) | 1,136 (-1%) | 0mo | $225,000 | $198 | 57 |
| 211 Fulton St | 0.39mi | 3/1.5 | 1,320 (+15%) | 2mo | $189,900 | $144 | 56 |
| 209 Fulton St | 0.39mi | 3/2.0 | 1,320 (+15%) | 4mo | $174,900 | $133 | 52 |
| 138 Mussetta St | 0.74mi | 2/1.5 (-1) | 1,160 (+1%) | 9mo | $185,000 | $159 | 52 |
| 703 Grant Dr | 0.56mi | 3/1.5 | 1,240 (+8%) | 11mo | $230,000 | $185 | 52 |
| 220 Baltimore St | 0.72mi | 2/1.0 (-1) | 1,107 (-4%) | 9mo | $100,000 | $90 | 45 |
| 113 Locust St | 0.49mi | 2/2.0 (-1) | 1,310 (+14%) | 4mo | $185,500 | $142 | 44 |
| 183 Center St | 0.68mi | 2/1.0 (-1) | 1,070 (-7%) | 8mo | $159,000 | $149 | 43 |
Match score weights: distance 35% · size 25% · config 20% · recency 20%. Top-matched comps best support the ARV.
Projected returns pro-forma
-3.0% appreciation · 4.67% rent growth · sell at horizon
- IRR
- -28.8%
- Equity multiple
- 0.03×
- Total profit
- $-55,820
- Equity at exit
- $30,566
- IRR
- -22.8%
- Equity multiple
- -0.24×
- Total profit
- $-70,975
- Equity at exit
- $17,725
Cash invested: $57,400 (down + closing). Projections, not guarantees.
Landlord ↔ Tenant lean methodology
- Overall (STATE)
- 62 Landlord-Friendly
- State Pennsylvania
- 62 Landlord-Friendly · EVEN
- County
- — inherits STATE
- City
- — inherits STATE
ZIP-level market 17331
- Home prices YoY
- -33.8%
- Rents YoY
- 4.7%
- Active inventory
- 386
- Price-to-rent
- 13.0×
Monthly cashflow live
- Estimated rent
- $1,317 high interval (Pro) →
- Mortgage (P&I)
- −$1,075
- Tax from tax record
- −$271 /mo · $3,247/yr
- Insurance
- −$85
- HOA
- −$0
- Vacancy / Maint / Mgmt
- −$277
- Net cashflow
- $-391
Break-even live
UW: 25.0% down · 7.5% · 30yr · 1.5% tax · 5.0% vac · 8.0% maint · 8.0% mgmt
Financing live
Cash to close
- Down payment
- $51,250
- Closing costs
- $6,150
- Reserves months
- —
- Total cash needed
- —
Loan-product check · same deal, 3 products live
Conventional
25% down · 7.5% · 30yr
- Down + closing
- —
- Monthly P&I
- —
- Monthly cashflow
- —
- DSCR
- —
- Eligible?
- —
Personal DTI + credit; lowest rate.
DSCR
20% down · 8.5% · 30yr
- Down + closing
- —
- Monthly P&I
- —
- Monthly cashflow
- —
- DSCR
- —
- Eligible?
- —
No personal income docs; deal must DSCR.
Hard money
10% down · 12.0% · 12mo
- Down + closing
- —
- Monthly P&I
- —
- Monthly cashflow
- —
- DSCR
- —
- Eligible?
- —
Short-term bridge; refi at stabilization.
Rent comps 15 comps
| Address | Beds | Baths | Sqft | Rent | $/sqft | DOM | Units | Dist |
|---|---|---|---|---|---|---|---|---|
| 11 Penn St Unit 2nd Fl Hanover, PA | 2.0 | 1.0 | 1000 | $1,050 | $1.05 | 13d | 1 | 0.09mi |
| 514 Broadway Unit 1st Floor Hanover, PA | 2.0 | 1.0 | 1130 | $1,320 | $1.17 | 13d | 1 | 0.17mi |
| 342 E Walnut St Unit 29 Hanover, PA | 2.0 | 1.0 | 700 | $945 | $1.35 | 21d | 1 | 0.31mi |
| 261 N Franklin St Unit 302 Hanover, PA | 3.0 | 2.0 | 1398 | $1,130 | $0.81 | 43d | 1 | 0.56mi |
| 261 N Franklin St Unit 212 Hanover, PA | 2.0 | 1.0 | 1187 | $1,139 | $0.96 | 21d | 1 | 0.56mi |
| 125 Grant Dr Hanover, PA | 3.0 | 2.0 | 780 | $1,445 | $1.85 | 21d | 1 | 0.70mi |
| 203 W Clearview Rd Hanover, PA | 1.0–2.0 | 1.0 | 844 | $1,660 | $1.97 | 13d | 14 | 0.96mi |
| 807 W Alvin St Hanover, PA | 1.0–2.0 | 1.0 | 625 | $1,000 | $1.60 | 13d | 2 | 1.03mi |
| 807 W Alvin St Unit 835 Hanover, PA | 2.0 | 1.0 | 700 | $1,000 | $1.43 | 21d | 1 | 1.04mi |
| 285 South St Hanover, PA | 3.0 | 1.5 | 1000 | $1,350 | $1.35 | 13d | 1 | 1.28mi |
| 612 Maple Ave Hanover, PA | 2.0 | 2.0 | 900 | $1,295 | $1.44 | 13d | 1 | 1.41mi |
| 607 3rd St Hanover, PA | 3.0 | 1.0 | 1276 | $1,400 | $1.10 | 21d | 1 | 1.41mi |
| 101 Pacer Dr Unit L Hanover, PA | 3.0 | 2.5 | 1252 | $1,901 | $1.52 | 13d | 1 | 1.47mi |
| 101 Pacer Dr Unit K Hanover, PA | 3.0 | 2.5 | 1252 | $1,846 | $1.47 | 43d | 1 | 1.47mi |
| 101 Pacer Dr Unit M Hanover, PA | 3.0 | 2.5 | 1252 | $1,751 | $1.40 | 43d | 1 | 1.47mi |
Listing history 4 events
-
2026-06-07statusdays on market $205,000 Pending 1 DOM
-
2026-06-03days on market $205,000 Coming Soon 2 DOM
-
2026-06-01remarks 257-char remark
-
2026-06-01$205,000 Coming Soon 1 DOM
ⓘ Source: listings_history table (triggers on properties + properties_extension) + one-shot
backfill from property_details.listing_events for pre-trigger history.
Tax reassessment forecast PA · Partial reset (capped growth)
- Current annual tax
- $3,247 · $271/mo
- Projected year-2 tax
- $3,247 · $271/mo
- Expected delta
- $0/yr ($0/mo · -0.0%)
ⓘ Screening estimate from a state-policy table — verify with the county assessor before closing.
Climate risk First Street
- Flood 1/10 Low FEMA zone X (unshaded) · 0% chance over 30 yrs
- Wildfire 1/10 Low
- Heat 6/10 Major 7 d/yr ≥102°F today · 15 d/yr by 30 yrs out
- Wind 4/10 Moderate 8% chance of damaging wind over 30 yrs
- Air quality 2/10 Low 1 unhealthy d/yr today · 3 by 30 yrs out
Nearby sold comps map
Loading sold comps map…
Walkable amenities ~0.75 mi
Loading nearby amenities…
Taxation est. · year 1
- Rental income
- $15,804
- − Mortgage interest
- −$11,483
- − Property taxes
- −$3,247
- − Insurance
- −$1,025
- − Repairs & maintenance
- −$1,264
- − Management
- −$1,264
- − Depreciation
- −$5,964
- Taxable loss
- −$8,444
- Est. tax savings @ 24.0%
- +$2,026
- After-tax cash flow
- $-2,661/yr
For passive investors: Depreciation is non-cash, so a rental often shows a tax loss while cash-flowing — sheltering income. Rental losses are passive: they offset passive income freely, and up to $25,000/yr can offset ordinary (W-2) income if you actively participate and your MAGI is under $100k (phasing out to $0 by $150k); unused losses carry forward. On sale, claimed depreciation is recaptured at up to 25%, and gains may owe capital-gains tax (a 1031 exchange can defer both). Figures are a year-1 estimate at your 24.0% rate — not tax advice; consult a CPA.
Schools (NCES district)
- District
- Hanover Public SD
- NCES district ID
- 4211450
- Math proficiency
- 34% ▼ -11.00%
- Reading proficiency
- 54% ▼ -8.00%
- Median HH income
- $45,022
- Composite
- 37.26/100
- National rank
- #4457
- State rank
- #294 of 539 in PA
Livability — Hanover
- Score
- 76/100
- State rank
- #373
- US rank
- #3295
Category grades
Schools grade is shown separately in the Schools card above.
Census & demographics
- Census place
- Hanover, PA
- County
- York County · 278,806 people
- City population
- 56,443
- Metro
- York-Hanover, PA
- Population (ZIP)
- 56,443
- Household income
- $79,488
- Rent vs Own
- Severe rent burden
- 1076.0
Population outlook (York County) Hauer SSP2
- Today (2025)
- 454,205 people
- By 2030
- 457,407 · +0.7%
- By 2040
- 457,529 · +0.7%
- By 2050
- 448,261 · -1.3%
- By 2075
- 427,388 · -5.9%
- By 2100
- 384,218 · -15.4%
Race, ethnicity, and origin ACS 2023
- Neighborhood character
- Predominantly White (86%)
- Race & ethnicity
- White 86% Hispanic / Latino 7% Two or more races 7% Black 3% Asian 1%
- Hispanic origin (detail)
- Mexican 3% Puerto Rican 2%
- Common ancestry
- Romanian 3% Lithuanian 2% Slovak 2%
- Foreign-born
- 4% · Canada
- Languages at home
- 95% English-only · Spanish 3%
Political lean MEDSL · York
- 2024 margin
- Strong R (+25.3) · D 36.9% · R 62.1%
- 2008→2024 swing
- -11.7pp toward R · 2008: -13.6pp · 2024: -25.3pp
- All cycles
- 2024: R+25.3 2020: R+24.6 2016: R+29.3 2012: R+21.2 2008: R+13.6
Not yet ingested
- Civics
- —
Market trends
- HPI YoY
- ▼ -128.48%
- Current HPI
- 251.8974
- Rent YoY
- ▲ 4.67%
- Metro
- York-Hanover, PA
- State GDP YoY
- ▲ 1.68%
- F500 in state
- 34
Industry mix (Fortune 500 HQ in PA)
| Industry | F500 HQs | Revenue |
|---|---|---|
| Healthcare | 2 | $309B |
|
||
| Insurance | 2 | $27B |
|
||
| Telecommunications / Media | 1 | $124B |
|
||
| Industrial Distribution | 1 | $22B |
|
||
| Financial Services | 1 | $20B |
|
||
| Chemicals / Materials | 1 | $18B |
|
||
Price history
+57.8% since first listed10 events — show timeline
- 2026-06-01 Coming Soon $205,000 BRIGHT MLS
- 2023-09-01 Sold (Public Records) $174,000 Public Records
- 2023-08-31 Sold (MLS) $174,000 BRIGHT MLS
- 2023-08-04 Contingent — BRIGHT MLS
- 2023-08-01 Listed $174,995 BRIGHT MLS
- 2023-02-06 Sold (Public Records) $40,000 Public Records
- 2022-07-26 Sold (Public Records) $35,000 Public Records
- 2008-10-02 Sold (Public Records) $125,000 Public Records
- 2008-09-26 Sold (MLS) $125,000 BRIGHT MLS
- 2008-04-07 Listed $129,900 BRIGHT MLS
Property tax history
+3.1%/yrLatest (2025): $3,247 · +0.8% YoY. Source: county tax records.
Cash-flow waterfall
monthlySold comps — $/sqft
last 12 mo · ≤1 miLoading sold comps…