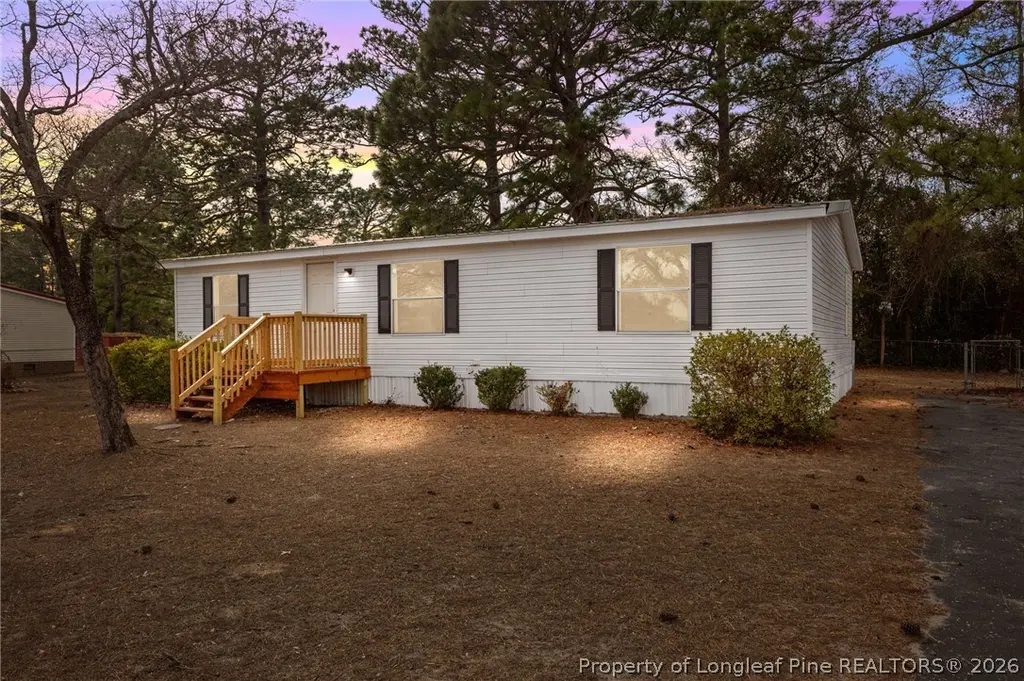
2918 Dothan Dr · Fayetteville, NC
Flood risk 1/10 · Minimal
- FEMA flood zone
- X (unshaded)
- Chance of flooding over 30 yrs
- 0.0%
- Est. flood insurance / yr
- $507 – $1,088
Fire risk 6/10 · Moderate
- Est. fire insurance / yr
- $906 – $1,684
Heat risk 7/10 · Major
- Hot days now (above 106°F)
- 7 days/yr
- Hot days in 30 yrs
- 16 days/yr
Wind risk 7/10 · Major
- Chance of severe wind over 30 yrs
- 75.0%
Air-quality risk 1/10 · Minimal
- Unhealthy air days now
- 0 days/yr
- Unhealthy air days in 30 yrs
- 0 days/yr
Risk factors via First Street. Map © Google.
Why this score? — see what drove the C- grade
The composite is a weighted blend of 9 inputs, each scored 0–100. Each bar is that input's sub-score; the figure is the points it added to the 100-point composite (weight × sub-score).
- Cash flow +18.8/30.0
- ARV discount +11.6/15.0
- DSCR +5.9/10.0
- 1% rule +4.2/10.0
- Livability +3.8/5.0
- Schools +3.1/10.0
- Rent growth +2.7/5.0
- Condition / age +2.5/5.0
- Appreciation +0.0/10.0
$149,000
🖨 Deal sheet (PDF) 📄 Offer letter ✓ Due diligence
Listing remarks
This home has been thoughtfully updated and offers a practical layout with 3 bedrooms and 2 full baths in approximately 1,200 square feet. Recent improvements create a clean, modern feel, including durable luxury vinyl plank flooring throughout the main living areas and bedrooms. The kitchen has been refreshed with laminate counters, stainless appliances, and updated finishes, while both baths include renovated shower areas with tile detail. Situated in a convenient Fayetteville area near I-95, the property provides easy access for commuting and is close to Fort Bragg, shopping, restaurants, medical services, and local venues, including Walmart, the Crown Complex, Cape Fear Valley Hospital
Key facts
- Updated finishes
- Stainless appliances
- 0.25 acre lot
Tags
Property features AI
Finance
- Other: Zoned R6A - Residential District
- Financial info:
- HOA & community:
Exterior
- Parking:
- Security:
- Utilities: Holding tank sewer; Septic tank sewer
- Home design: Manufactured home; Residential property; Located in the TANGLEWOOD subdivision; Directions: Gillespie Street to Alabama Ln, left onto Dothan Dr
- Construction: Vinyl siding
- Exterior features: Partial fencing; Cleared, level lot
Interior
- Kitchen: Refrigerator; Dishwasher; Range
- Bedrooms: Laundry on main level
- Flooring: Vinyl
- Bathrooms: 2 full bathrooms
- Heating & cooling: Heat pump heating; Central electric air conditioning; Ceiling fan cooling
- Interior features: Ceiling fans; Double vanity; Eat-in kitchen; Walk-in closets; 8 total rooms; Crawl space basement
- Laundry & utility: Laundry located on the main level
Neighborhood map
What this means for you Summary
Snapshot
- This is a 3-bed/2.0-bath manufactured listed at $149k.
Deal economics
- At list price, monthly cash flow is $150 ($2k/yr) — positive.
- The deal already cash-flows at list — no discount required.
- To meet the 1% rule (rent ≥ 1% of price), the offer needs to be $137k (7.8% below list).
- Recommended offer: $137k (7.8% below list) — sets the bar for 1% rule.
- Cap rate 7.5% vs local median 4.8% in Fayetteville — top-decile yield for the area; either an underpriced asset or a hidden risk that comps aren't pricing in. Stress-test before assuming the spread holds.
Location & tenants
- Location reads 75/100 on livability (#45 in NC, #4,031 nationally) — a middle-class / working-renter tenant base. Strengths: commute A+, cost of living A+, housing A+; Watch: crime F, employment D-.
- Cumberland County Schools (urban): math 32% / reading 41% proficiency, ranked #126 of 178 in NC (top 71%) — families likely to look elsewhere, expect single-tenant / working-renter base with shorter leases.
- Zoned schools: South View Middle (math 20% / reading 34%, grade F, #374 of 475 statewide, top 80%, 661 students, 99% FRL); South View High (math 60% / reading 43%, grade D+, #299 of 535 statewide, top 56%, 1,502 students, 66% FRL) — zoned schools average 82% FRL vs 55% district-wide (28 pts higher); higher-poverty schools than district average — tighter screening recommended.
- Market conditions: Rents flat; 400 active listings in the ZIP; 10 comparable units currently listed for rent nearby; rentals at typical pace (median 25d on market — plan ~3-4 weeks tenant-placement turnaround); 1,125 units permitted in Cumberland County in 2024 (104 in 5+ unit buildings).
Forward outlook
- Local home prices are declining (-3.0%/yr); year-one equity from $1k of loan paydown is wiped out by about $4k of value loss. Plan a longer hold.
Negotiation context
- It's been on market 31 days — a 3% lower offer ($145k) is reasonable based on typical stale-listing flexibility.
- 5 sale attempts since 6y ago with the ask held roughly flat each time — persistent listings suggest the price (not the market) is what's stuck; bring a comps-based counter.
Risks & watch-outs
- Climate carrying-cost: major wind risk, 75% chance of damaging wind over 30y; major wildfire risk; extreme-heat days projected 7→16/yr by 2055 (HVAC capex compounding) — expect insurance premiums to compound above CPI over the hold.
Questions for the listing agent
- It's been on market 31 days. Have you received any prior offers? Is the seller open to a 8% concession, seller financing, or rate buy-down credit?
- Is there a deadline driving the sale (1031 exchange, divorce, estate, relocation)? That informs how much negotiation room exists.
- Crime grade is F in this area — have there been break-ins, vandalism, or insurance claims at this property in the last 3 years? What carrier currently insures it and at what premium?
- What's the average days-on-market for RENTAL listings here right now (not sales)? A rising rental-DOM trend means longer vacancies and softer asking-rent achievability than the comps imply.
- What's the recent tenant-quality profile in this submarket — average credit score on applications, eviction rate, late-payment / NSF rate, and stable-employment percentage? A property-management company in the area should have these aggregated.
- How much new for-sale + rental construction is in the pipeline within 1–3 miles? Heavy new supply typically softens prices + rents 12–24 months out; constrained supply supports both.
Investment metrics
- 1% rule
- 0.92% ✗
- Cap rate
- 7.50%
- Cash-on-cash
- 4.32%
- DSCR
- 1.19
- GRM
- 9.0
CMA / ARV
- ARV (on-the-fly)
- $163,944
- Comps found
- 3
Show comp detail 3 sales within ~0.75 mi
| Address | Dist | Beds/Ba | Sqft | Sold | Price | $/sf | Match |
|---|---|---|---|---|---|---|---|
| 2917 Dothan Dr | 0.03mi | 3/2.0 | 1,056 (-11%) | 10mo | $150,000 | $142 | 72 |
| 204 Russellville Ct | 0.26mi | 3/2.0 | 1,159 (-2%) | 14mo | $160,000 | $138 | 72 |
| 209 Auburn St | 0.24mi | 3/2.0 | 1,104 (-7%) | 16mo | $149,000 | $135 | 64 |
Match score weights: distance 35% · size 25% · config 20% · recency 20%. Top-matched comps best support the ARV.
Projected returns pro-forma
-3.0% appreciation · 0.9% rent growth · sell at horizon
- IRR
- -11.8%
- Equity multiple
- 0.58×
- Total profit
- $-17,455
- Equity at exit
- $22,216
- IRR
- -5.8%
- Equity multiple
- 0.66×
- Total profit
- $-14,215
- Equity at exit
- $12,883
Cash invested: $41,720 (down + closing). Projections, not guarantees.
Landlord ↔ Tenant lean methodology
- Overall (STATE)
- 85 Strongly Landlord-Friendly
- State North Carolina
- 85 Strongly Landlord-Friendly · R+3
- County
- — inherits STATE
- City
- — inherits STATE
ZIP-level market 28306
- Home prices YoY
- -17.7%
- Rents YoY
- 0.9%
- Active inventory
- 400
- Price-to-rent
- 9.0×
Monthly cashflow live
- Estimated rent
- $1,374 high interval (Pro) →
- Mortgage (P&I)
- −$781
- Tax from tax record
- −$92 /mo · $1,099/yr
- Insurance
- −$62
- HOA
- −$0
- Vacancy / Maint / Mgmt
- −$288
- Net cashflow
- $150
Break-even live
Sensitivity live
| Price | -10% $235 | -5% $192 | +0% $150 | +5% $108 | +10% $66 |
|---|---|---|---|---|---|
| Rent | -10% $42 | -5% $96 | +0% $150 | +5% $205 | +10% $259 |
| Rate | -1.0pp $225 | -0.5pp $188 | base $150 | +0.5pp $112 | +1.0pp $72 |
UW: 25.0% down · 7.5% · 30yr · 1.5% tax · 5.0% vac · 8.0% maint · 8.0% mgmt
Financing live
Cash to close
- Down payment
- $37,250
- Closing costs
- $4,470
- Reserves months
- —
- Total cash needed
- —
Loan-product check · same deal, 3 products live
Conventional
25% down · 7.5% · 30yr
- Down + closing
- —
- Monthly P&I
- —
- Monthly cashflow
- —
- DSCR
- —
- Eligible?
- —
Personal DTI + credit; lowest rate.
DSCR
20% down · 8.5% · 30yr
- Down + closing
- —
- Monthly P&I
- —
- Monthly cashflow
- —
- DSCR
- —
- Eligible?
- —
No personal income docs; deal must DSCR.
Hard money
10% down · 12.0% · 12mo
- Down + closing
- —
- Monthly P&I
- —
- Monthly cashflow
- —
- DSCR
- —
- Eligible?
- —
Short-term bridge; refi at stabilization.
Rent comps 10 comps
| Address | Beds | Baths | Sqft | Rent | $/sqft | DOM | Units | Dist |
|---|---|---|---|---|---|---|---|---|
| 2910 Dunebuggy Ln Fayetteville, NC | 2.0 | 2.0 | 800 | $800 | $1.00 | 24d | 1 | 0.56mi |
| 408 Sheila St Hope Mills, NC | 3.0 | 1.0 | 1064 | $1,150 | $1.08 | 24d | 1 | 0.69mi |
| 505 Directive Dr Hope Mills, NC | 2.0 | 2.5 | 1254 | $1,495 | $1.19 | 24d | 1 | 0.77mi |
| 513 Directive Dr Hope Mills, NC | 2.0 | 2.0 | 1307 | $1,275 | $0.98 | 15d | 1 | 0.77mi |
| 405 Grand Wailea Dr Hope Mills, NC | 1.0–3.0 | 1.0–2.0 | 1061 | $1,656 | $1.56 | 24d | 9 | 1.05mi |
| 575 Countrytown Dr Hope Mills, NC | 2.0 | 2.0 | 800 | $1,325 | $1.66 | 24d | 1 | 1.07mi |
| 122 Oak St Fayetteville, NC | 2.0 | 2.0 | 1000 | $1,000 | $1.00 | 24d | 1 | 1.10mi |
| 126 Oak St Fayetteville, NC | 2.0 | 2.0 | 1000 | $1,000 | $1.00 | 24d | 1 | 1.10mi |
| 614 Drypoint Ln Apt B Hope Mills, NC | 2.0 | 2.0 | 900 | $1,050 | $1.17 | 24d | 1 | 1.30mi |
| 2253 Rustic Trl Fayetteville, NC | 3.0 | 2.5 | 1130 | $1,295 | $1.15 | 15d | 1 | 1.36mi |
Listing history 32 events
-
2026-06-21days on market $149,000 Active 31 DOM
-
2026-06-19price $149,000 Active 28 DOM
-
2026-06-18days on market $155,900 Active 28 DOM
-
2026-06-17days on market $155,900 Active 27 DOM
-
2026-06-16days on market $155,900 Active 26 DOM
-
2026-06-15days on market $155,900 Active 25 DOM
-
2026-06-14days on market $155,900 Active 23 DOM
-
2026-06-13days on market $155,900 Active 22 DOM
-
2026-06-10days on market $155,900 Active 20 DOM
-
2026-06-09days on market $155,900 Active 19 DOM
-
2026-06-08days on market $155,900 Active 18 DOM
-
2026-06-07days on market $155,900 Active 17 DOM
-
2026-06-03days on market $155,900 Active 13 DOM
-
2026-06-02days on market $155,900 Active 12 DOM
-
2026-06-01days on market $155,900 Active 11 DOM
-
2026-05-31days on market $155,900 Active 10 DOM
-
2026-05-30days on market $155,900 Active 9 DOM
-
2026-05-21$155,900 Active
-
2026-03-12status Active
-
2026-03-05status Pending
-
2026-02-26$169,900 Active
-
2025-09-22price $149,999
-
2025-09-10price $155,999
-
2025-08-29price $157,999
-
2025-08-11$159,999 Active
-
2025-06-16soldstatus $558,000
-
2021-01-06soldstatus $50,000
-
2021-01-06soldstatus $50,000
-
2020-11-17soldstatus $156,500
-
2020-06-18$57,500
-
1987-03-04soldstatus $18,000
-
1984-04-01soldstatus $10,500
ⓘ Source: listings_history table (triggers on properties + properties_extension) + one-shot
backfill from property_details.listing_events for pre-trigger history.
Tax reassessment forecast NC · Resets to sale price
- Current annual tax
- $1,099 · $92/mo
- Projected year-2 tax
- $1,222 · $102/mo
- Expected delta
- +$123/yr (+$10/mo · 11.2%)
ⓘ Screening estimate from a state-policy table — verify with the county assessor before closing.
Climate risk First Street
- Flood 1/10 Low FEMA zone X (unshaded) · 0% chance over 30 yrs
- Wildfire 6/10 Major
- Heat 7/10 Severe 7 d/yr ≥106°F today · 16 d/yr by 30 yrs out
- Wind 7/10 Severe 75% chance of damaging wind over 30 yrs
- Air quality 1/10 Low 0 unhealthy d/yr today · 0 by 30 yrs out
Nearby sold comps map
Loading sold comps map…
Walkable amenities ~0.75 mi
Loading nearby amenities…
Taxation est. · year 1
- Rental income
- $16,485
- − Mortgage interest
- −$8,346
- − Property taxes
- −$1,099
- − Insurance
- −$745
- − Repairs & maintenance
- −$1,319
- − Management
- −$1,319
- − Depreciation
- −$4,335
- Taxable loss
- −$677
- Est. tax savings @ 24.0%
- +$162
- After-tax cash flow
- $1,966/yr
For passive investors: Depreciation is non-cash, so a rental often shows a tax loss while cash-flowing — sheltering income. Rental losses are passive: they offset passive income freely, and up to $25,000/yr can offset ordinary (W-2) income if you actively participate and your MAGI is under $100k (phasing out to $0 by $150k); unused losses carry forward. On sale, claimed depreciation is recaptured at up to 25%, and gains may owe capital-gains tax (a 1031 exchange can defer both). Figures are a year-1 estimate at your 24.0% rate — not tax advice; consult a CPA.
Schools (NCES district)
- District
- Cumberland County Schools
- NCES district ID
- 3700011
- Math proficiency
- 32% ▼ -2.00%
- Reading proficiency
- 41% ▼ -1.00%
- Median HH income
- $44,168
- Composite
- 31.0/100
- National rank
- #6096
- State rank
- #126 of 178 in NC
Livability — Fayetteville
- Score
- 75/100
- State rank
- #45
- US rank
- #4031
Category grades
Schools grade is shown separately in the Schools card above.
Census & demographics
- County
- Cumberland County · 265,314 people
- City population
- 226,118
- Metro
- Fayetteville, NC
- Population (ZIP)
- 43,042
- Household income
- $67,544
- Rent vs Own
- Severe rent burden
- 1386.0
Population outlook (Cumberland County) Hauer SSP2
- Today (2025)
- 330,855 people
- By 2030
- 333,523 · +0.8%
- By 2040
- 335,583 · +1.4%
- By 2050
- 335,325 · +1.4%
- By 2075
- 342,853 · +3.6%
- By 2100
- 340,698 · +3.0%
Race, ethnicity, and origin ACS 2023
- Neighborhood character
- Diverse neighborhood (Simpson 0.68)
- Race & ethnicity
- White 44% Black 33% Hispanic / Latino 13% Two or more races 8% Asian 4% Native American 2%
- Hispanic origin (detail)
- Mexican 5% Puerto Rican 5%
- Common ancestry
- Italian 2% Slovak 1% Serbian 1%
- Foreign-born
- 8% · Canada, South Korea, Jamaica
- Languages at home
- 87% English-only · Spanish 9% Other Indo-European 1% French/Haitian/Cajun 1%
Political lean MEDSL · Cumberland
- 2024 margin
- D (+13.4) · D 56.1% · R 42.7% · Other 1.2%
- 2008→2024 swing
- -4.3pp toward R · 2008: 17.7pp · 2024: 13.4pp
- All cycles
- 2024: D+13.4 2020: D+16.6 2016: D+16.0 2012: D+19.7 2008: D+17.7
Not yet ingested
- Civics
- —
Market trends
- HPI YoY
- ▼ -51.69%
- Current HPI
- 239.7281
- Rent YoY
- ▲ 0.90%
- Metro
- Fayetteville, NC
- State GDP YoY
- ▲ 3.28%
- F500 in state
- 26
Industry mix (Fortune 500 HQ in NC)
| Industry | F500 HQs | Revenue |
|---|---|---|
| Financial Services | 2 | $213B |
|
||
| Retail | 2 | $95B |
|
||
| Industrial Conglomerate | 1 | $38B |
|
||
| Metals / Steel | 1 | $35B |
|
||
| Utilities | 1 | $30B |
|
||
| Industrial Machinery | 1 | $19B |
|
||
Price history
+1384.8% since first listed15 events — show timeline
- 2026-05-21 Listed $155,900 LPRMLS
- 2026-03-12 Relisted — LPRMLS
- 2026-03-05 Pending — LPRMLS
- 2026-02-26 Listed $169,900 LPRMLS
- 2025-09-22 Price Changed $149,999 LPRMLS
- 2025-09-10 Price Changed $155,999 LPRMLS
- 2025-08-29 Price Changed $157,999 LPRMLS
- 2025-08-11 Listed $159,999 LPRMLS
- 2025-06-16 Sold (Public Records) $558,000 Public Records
- 2021-01-06 Sold (Public Records) $50,000 Public Records
- 2021-01-06 Sold (MLS) $50,000 LPRMLS
- 2020-11-17 Sold (Public Records) $156,500 Public Records
- 2020-06-18 Listed $57,500 LPRMLS
- 1987-03-04 Sold (Public Records) $18,000 Public Records
- 1984-04-01 Sold (Public Records) $10,500 Public Records
Property tax history
+6.5%/yrLatest (2025): $1,099 · +90.6% YoY. Source: county tax records.
Cash-flow waterfall
monthlySold comps — $/sqft
last 12 mo · ≤1 miLoading sold comps…