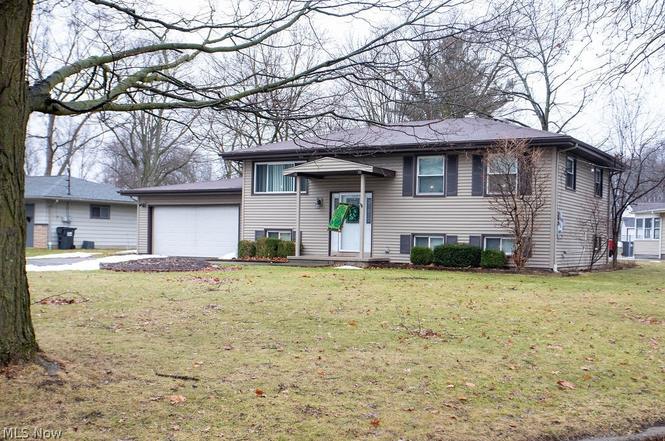
3490 Warwick Ct · Austintown, OH
Flood risk 5/10 · Moderate
- FEMA flood zone
- X (unshaded)
- Chance of flooding over 30 yrs
- 0.66%
- Est. flood insurance / yr
- $507 – $1,088
Fire risk 1/10 · Minimal
- Est. fire insurance / yr
- $713 – $1,323
Heat risk 3/10 · Minor
- Hot days now (above 97°F)
- 7 days/yr
- Hot days in 30 yrs
- 17 days/yr
Wind risk 1/10 · Minimal
- Chance of severe wind over 30 yrs
- —
Air-quality risk 2/10 · Minimal
- Unhealthy air days now
- 1 days/yr
- Unhealthy air days in 30 yrs
- 2 days/yr
Risk factors via First Street. Map © Google.
Why this score? — see what drove the B- grade
The composite is a weighted blend of 9 inputs, each scored 0–100. Each bar is that input's sub-score; the figure is the points it added to the 100-point composite (weight × sub-score).
- Cash flow +23.0/30.0
- ARV discount +15.0/15.0
- DSCR +7.4/10.0
- 1% rule +5.9/10.0
- Schools +5.1/10.0
- Livability +3.7/5.0
- Rent growth +2.5/5.0
- Condition / age +2.5/5.0
- Appreciation +0.0/10.0
$187,900
🖨 Deal sheet 📄 Offer letter ✓ Due diligence
Listing remarks MLS
Wonderful oversized BiLevel on Corner Lot. Addit. 25x11 w/ dble. closets. Many uses-Master or 4th B. R. ,Computer/Children's Rec Room, Pool Room etc. Other Fam. Rm. L-Shaped 19x12 & open to 9x7 w/ walk- out Basement. Laundry Rm/9x12 finished w/ Blt-ins.
Key facts
- Vinyl sided home
- Large family room
- Extra bonus area
Tags
Property features AI
Exterior
- Parking: Attached garage (2 car); Driveway parking; Garage faces front; Paved surfaces
- Utilities: Public water; Public sewer; Public power
- Home design: Two-story home; Vinyl siding; Asphalt/fiberglass roof; Above-grade finished living area reported
- Construction: Vinyl siding construction; Asphalt/fiberglass roof; Year built per public records
- Exterior features: Deck; Back yard; Front yard; Corner lot; Located on a cul-de-sac; City lot; Irregular lot
Interior
- Kitchen: Dishwasher; Disposal; Microwave; Range; Refrigerator; Built-in kitchen features
- Bedrooms: Three main-level bedrooms; Additional bedroom on lower level
- Flooring: Carpet in multiple rooms; Wood flooring in living areas; Slate at entry foyer; Other flooring in dining room and kitchen
- Bathrooms: Two full bathrooms
- Heating & cooling: Forced air heating (gas); Central air conditioning
- Interior features: Entrance foyer; Full walk-out basement with sump pump
- Laundry & utility: Washer hookup on lower level; Laundry tub and sink; Lower-level laundry room
Neighborhood map
What this means for you Summary
Snapshot
- This is a 3-bed/1.5-bath single-family listed at $188k.
Deal economics
- At list price, monthly cash flow is $335 ($4k/yr) — positive.
- The deal already cash-flows at list — no discount required.
- Meets the 1% rule at list price ($2k rent vs $188k).
- Recommended offer: $171k (9.0% below list) — sets the bar for market timing.
- Cap rate 8.4% vs local median 4.8% in Austintown — top-decile yield for the area; either an underpriced asset or a hidden risk that comps aren't pricing in. Stress-test before assuming the spread holds.
Location & tenants
- Location reads 73/100 on livability (#322 in OH) — a middle-class / working-renter tenant base. Strengths: cost of living A+, housing A+, schools A; Watch: amenities F, commute F, employment D-.
- Austintown Local Schools (suburban): math 56% / reading 65% proficiency, ranked #290 of 656 in OH (top 44%) — acceptable for families but not a draw, mixed tenant base, ~2y average lease.
- Market conditions: 123 active listings in the ZIP; 4 comparable units currently listed for rent nearby; rentals lingering (median 44d on market — plan ~5-8 weeks vacancy on turnover, expect pricing pressure); 50% of comp listings sitting > 30 days — soft ceiling on asking rent; solid renter incomes; 147 units permitted in Mahoning County in 2024 (0 in 5+ unit buildings).
Forward outlook
- Local home prices are declining (-3.0%/yr); year-one equity from $1k of loan paydown is wiped out by about $6k of value loss. Plan a longer hold.
- Mahoning County population projected at -14% by 2050 — secular population decline; favor cash flow + early exit over multi-decade hold.
Negotiation context
- It's been on market 96 days — a 9% lower offer ($171k) is reasonable based on typical stale-listing flexibility.
- 5 sale attempts since 31y ago with the ask held roughly flat each time — persistent listings suggest the price (not the market) is what's stuck; bring a comps-based counter.
- Current owner paid $90k; list at $188k implies a 110% gain — meaningful room to come down on a strong offer.
Risks & watch-outs
- Climate carrying-cost: moderate flood risk — expect insurance premiums to compound above CPI over the hold.
Questions for the listing agent
- It's been on market 96 days. Have you received any prior offers? Is the seller open to a 9% concession, seller financing, or rate buy-down credit?
- Built in 1963 — when were the roof, HVAC, electrical panel, plumbing, and water heater last replaced?
- Why hasn't it sold? Are there any deal-killer items the seller is aware of (foundation, flood, title, zoning, code violations)?
- Is there a deadline driving the sale (1031 exchange, divorce, estate, relocation)? That informs how much negotiation room exists.
- Schools are A-rated — typically a magnet for longer-tenancy family renters. What's the average tenant stay here, and is there a school-zone premium baked into asking?
- What's the average days-on-market for RENTAL listings here right now (not sales)? A rising rental-DOM trend means longer vacancies and softer asking-rent achievability than the comps imply.
- What's the recent tenant-quality profile in this submarket — average credit score on applications, eviction rate, late-payment / NSF rate, and stable-employment percentage? A property-management company in the area should have these aggregated.
- How much new for-sale + rental construction is in the pipeline within 1–3 miles? Heavy new supply typically softens prices + rents 12–24 months out; constrained supply supports both.
Investment metrics
- 1% rule
- 1.09% ✓
- Cap rate
- 8.43%
- Cash-on-cash
- 7.64%
- DSCR
- 1.34
- GRM
- 7.6
CMA / ARV
- ARV (on-the-fly)
- $247,000
- Comps found
- 12
Show comp detail 12 sales within ~0.75 mi
| Address | Dist | Beds/Ba | Sqft | Sold | Price | $/sf | Match |
|---|---|---|---|---|---|---|---|
| 3490 Warwick Ct | 0.00mi | 4/2.0 (+1) | 1,976 (0%) | 1mo | $182,000 | $92 | 92 |
| 4565 Plumbrook Dr | 0.22mi | 4/2.0 (+1) | 1,976 (0%) | 13mo | $219,000 | $111 | 71 |
| 3429 Heritage Ct S | 0.41mi | 3/1.5 | 1,976 (0%) | 15mo | $195,000 | $99 | 68 |
| 3671 High Meadow Dr | 0.32mi | 3/1.5 | 2,100 (+6%) | 9mo | $245,000 | $117 | 67 |
| 4132 Burgett Rd | 0.46mi | 3/2.0 | 2,000 (+1%) | 10mo | $410,000 | $205 | 66 |
| 4270 Mellinger Rd | 0.64mi | 4/2.0 (+1) | 2,052 (+4%) | 6mo | $270,000 | $132 | 51 |
| 3658 Johnson Farm Dr | 0.47mi | 3/1.5 | 1,716 (-13%) | 8mo | $159,900 | $93 | 49 |
| 4566 Sheffield Dr | 0.50mi | 4/2.5 (+1) | 1,896 (-4%) | 14mo | $248,000 | $131 | 49 |
| 3423 Tall Oaks Ln | 0.70mi | 4/2.0 (+1) | 2,112 (+7%) | 1mo | $252,000 | $119 | 48 |
| 4188 Kirk Rd | 0.52mi | 4/1.5 (+1) | 1,833 (-7%) | 14mo | $230,000 | $125 | 47 |
| 2612 Frostwood Dr | 0.74mi | 3/2.0 | 1,770 (-10%) | 0mo | $235,000 | $133 | 46 |
| 3375 Darbyshire Dr | 0.71mi | 4/1.5 (+1) | 1,716 (-13%) | 4mo | $247,000 | $144 | 36 |
Match score weights: distance 35% · size 25% · config 20% · recency 20%. Top-matched comps best support the ARV.
Projected returns pro-forma
-3.0% appreciation · 3.0% rent growth · sell at horizon
- IRR
- -4.6%
- Equity multiple
- 0.83×
- Total profit
- $-9,100
- Equity at exit
- $28,017
- IRR
- 5.1%
- Equity multiple
- 1.37×
- Total profit
- $19,635
- Equity at exit
- $16,246
Cash invested: $52,612 (down + closing). Projections, not guarantees.
Landlord ↔ Tenant lean methodology
- Overall (STATE)
- 73 Landlord-Friendly
- State Ohio
- 73 Landlord-Friendly · R+6
- County
- — inherits STATE
- City
- — inherits STATE
ZIP-level market 44406
- Home prices YoY
- -27.4%
- Active inventory
- 123
- Price-to-rent
- 7.6×
Monthly cashflow live
- Estimated rent
- $2,056 medium interval (Pro) →
- Mortgage (P&I)
- −$985
- Tax from tax record
- −$226 /mo · $2,713/yr
- Insurance
- −$78
- HOA
- −$0
- Vacancy / Maint / Mgmt
- −$432
- Net cashflow
- $335
Break-even live
UW: 25.0% down · 7.5% · 30yr · 1.5% tax · 5.0% vac · 8.0% maint · 8.0% mgmt
Financing live
Cash to close
- Down payment
- $46,975
- Closing costs
- $5,637
- Reserves months
- —
- Total cash needed
- —
Loan-product check · same deal, 3 products live
Conventional
25% down · 7.5% · 30yr
- Down + closing
- —
- Monthly P&I
- —
- Monthly cashflow
- —
- DSCR
- —
- Eligible?
- —
Personal DTI + credit; lowest rate.
DSCR
20% down · 8.5% · 30yr
- Down + closing
- —
- Monthly P&I
- —
- Monthly cashflow
- —
- DSCR
- —
- Eligible?
- —
No personal income docs; deal must DSCR.
Hard money
10% down · 12.0% · 12mo
- Down + closing
- —
- Monthly P&I
- —
- Monthly cashflow
- —
- DSCR
- —
- Eligible?
- —
Short-term bridge; refi at stabilization.
Rent comps 4 comps
| Address | Beds | Baths | Sqft | Rent | $/sqft | DOM | Units | Dist |
|---|---|---|---|---|---|---|---|---|
| 4185 Adeer Dr Canfield, OH | 4.0 | 2.5 | 2232 | $2,900 | $1.30 | 43d | 1 | 0.50mi |
| 2230 S Raccoon Rd Youngstown, OH | 3.0 | 1.0–1.5 | 1141 | $1,135 | $0.99 | 13d | 1 | 0.91mi |
| 2529 Bainbridge Ave Youngstown, OH | 3.0 | 2.0 | 1692 | $1,500 | $0.89 | 43d | 1 | 0.98mi |
| 2433 Bainbridge Ave Youngstown, OH | 3.0 | 1.0 | 1640 | $1,500 | $0.91 | 21d | 1 | 1.09mi |
Listing history 12 events
-
2026-04-22historical Contingent
-
2026-03-31price $187,900
-
2026-02-17$195,000 Active
-
2003-06-19historical
-
2003-02-20soldstatus $89,500 261-char remark
Show marketing remark (261 chars)
Wonderful oversized BiLevel on Corner Lot. Addit. 25x11 w/ dble. closets. Many uses-Master or 4th B. R. ,Computer/Children's Rec Room, Pool Room etc. Other Fam. Rm. L-Shaped 19x12 & open to 9x7 w/ walk- out Basement. Laundry Rm/9x12 finished w/ Blt-ins.
-
2003-02-20soldstatus $89,500
Show marketing remark (261 chars)
Wonderful oversized BiLevel on Corner Lot. Addit. 25x11 w/ dble. closets. Many uses-Master or 4th B. R. ,Computer/Children's Rec Room, Pool Room etc. Other Fam. Rm. L-Shaped 19x12 & open to 9x7 w/ walk- out Basement. Laundry Rm/9x12 finished w/ Blt-ins.
-
2002-10-20$95,000
Show marketing remark (261 chars)
Wonderful oversized BiLevel on Corner Lot. Addit. 25x11 w/ dble. closets. Many uses-Master or 4th B. R. ,Computer/Children's Rec Room, Pool Room etc. Other Fam. Rm. L-Shaped 19x12 & open to 9x7 w/ walk- out Basement. Laundry Rm/9x12 finished w/ Blt-ins.
-
2002-10-20$95,000 261-char remark
Show marketing remark (261 chars)
Wonderful oversized BiLevel on Corner Lot. Addit. 25x11 w/ dble. closets. Many uses-Master or 4th B. R. ,Computer/Children's Rec Room, Pool Room etc. Other Fam. Rm. L-Shaped 19x12 & open to 9x7 w/ walk- out Basement. Laundry Rm/9x12 finished w/ Blt-ins.
-
2002-09-18historical
-
2002-05-17$97,900
-
1995-10-13soldstatus $74,000
-
1995-05-04$77,550
ⓘ Source: listings_history table (triggers on properties + properties_extension) + one-shot
backfill from property_details.listing_events for pre-trigger history.
Tax reassessment forecast OH · Partial reset (capped growth)
- Current annual tax
- $2,713 · $226/mo
- Projected year-2 tax
- $2,822 · $235/mo
- Expected delta
- +$109/yr (+$9/mo · 4.0%)
ⓘ Screening estimate from a state-policy table — verify with the county assessor before closing.
Climate risk First Street
- Flood 5/10 Major FEMA zone X (unshaded) · 66% chance over 30 yrs
- Wildfire 1/10 Low
- Heat 3/10 Moderate 7 d/yr ≥97°F today · 17 d/yr by 30 yrs out
- Wind 1/10 Low
- Air quality 2/10 Low 1 unhealthy d/yr today · 2 by 30 yrs out
Nearby sold comps map
Loading sold comps map…
Walkable amenities ~0.75 mi
Loading nearby amenities…
Taxation est. · year 1
- Rental income
- $24,676
- − Mortgage interest
- −$10,525
- − Property taxes
- −$2,713
- − Insurance
- −$940
- − Repairs & maintenance
- −$1,974
- − Management
- −$1,974
- − Depreciation
- −$5,466
- Taxable income
- $1,084
- Est. tax owed @ 24.0%
- −$260
- After-tax cash flow
- $3,757/yr
For passive investors: Depreciation is non-cash, so a rental often shows a tax loss while cash-flowing — sheltering income. Rental losses are passive: they offset passive income freely, and up to $25,000/yr can offset ordinary (W-2) income if you actively participate and your MAGI is under $100k (phasing out to $0 by $150k); unused losses carry forward. On sale, claimed depreciation is recaptured at up to 25%, and gains may owe capital-gains tax (a 1031 exchange can defer both). Figures are a year-1 estimate at your 24.0% rate — not tax advice; consult a CPA.
Schools (NCES district)
- District
- Austintown Local Schools
- NCES district ID
- 3904829
- Math proficiency
- 56% ▼ -12.00%
- Reading proficiency
- 65% ▼ -7.00%
- Median HH income
- $45,129
- Composite
- 50.99/100
- National rank
- #1778
- State rank
- #290 of 656 in OH
Livability — Austintown
- Score
- 73/100
- State rank
- #322
- US rank
- #5290
Category grades
Schools grade is shown separately in the Schools card above.
Census & demographics
- Census place
- Austintown, OH
- County
- Mahoning · 224,175 people
- City population
- 27,740
- Metro
- Youngstown-Warren, OH
- Population (ZIP)
- 22,297
- Household income
- $99,542
- Rent vs Own
- Severe rent burden
- 8.2
Population outlook (Mahoning County) Hauer SSP2
- Today (2025)
- 223,932 people
- By 2030
- 218,387 · -2.5%
- By 2040
- 205,367 · -8.3%
- By 2050
- 193,606 · -13.5%
- By 2075
- 173,694 · -22.4%
- By 2100
- 151,147 · -32.5%
Race, ethnicity, and origin ACS 2023
- Neighborhood character
- Predominantly White (90%)
- Race & ethnicity
- White 90% Two or more races 5% Asian 3% Hispanic / Latino 2% Black 1%
- Common ancestry
- Romanian 6% Slovak 1% Scandinavian 1%
- Foreign-born
- 4% · Canada
- Languages at home
- 97% English-only · Other Indo-European 2% Spanish 1%
Political lean MEDSL · Mahoning
- 2024 margin
- Lean R (+9.4) · D 44.9% · R 54.4%
- 2008→2024 swing
- -36.1pp toward R · 2008: 26.6pp · 2024: -9.4pp
- All cycles
- 2024: R+9.4 2020: R+1.9 2016: D+3.0 2012: D+27.7 2008: D+26.6
Not yet ingested
- Civics
- —
Market trends
- HPI YoY
- ▼ -75.88%
- Current HPI
- 200.9335
- Rent YoY
- —
- Metro
- —
- State GDP YoY
- ▲ 1.98%
- F500 in state
- 48
Industry mix (Fortune 500 HQ in OH)
| Industry | F500 HQs | Revenue |
|---|---|---|
| Insurance | 3 | $145B |
|
||
| Industrial Machinery | 3 | $49B |
|
||
| Financial Services | 3 | $24B |
|
||
| Consumer Goods | 2 | $93B |
|
||
| Aerospace / Defense | 2 | $47B |
|
||
| Utilities | 2 | $33B |
|
||
Price history
+142.3% since first listed12 events — show timeline
- 2026-04-22 Contingent — MLSNOW
- 2026-03-31 Price Changed $187,900 MLSNOW
- 2026-02-17 Listed $195,000 MLSNOW
- 2003-06-19 Listing Removed — MLSNOW
- 2003-02-20 Sold (Public Records) $89,500 Public Records
- 2003-02-20 Sold (MLS) $89,500 MLSNOW
- 2002-10-20 Listed $95,000 MLSNOW
- 2002-10-20 Listed $95,000 MLSNOW
- 2002-09-18 Listing Removed — MLSNOW
- 2002-05-17 Listed $97,900 MLSNOW
- 1995-10-13 Sold (Public Records) $74,000 Public Records
- 1995-05-04 Listed $77,550 MLSNOW
Property tax history
+3.1%/yrLatest (2025): $2,713 · +4.6% YoY. Source: county tax records.
Cash-flow waterfall
monthlySold comps — $/sqft
last 12 mo · ≤1 miLoading sold comps…